

Key Performance Indicator (KPI)
A Key Performance Indicator aka KPI is a metric which objectively measures the numeric equivalent of goals or targets of a company, team or an organization. Any individual or a community which has a numerical target can measure success of their goal with key performance indicators.
In all business roles and levels, if you manage a team you most likely have to set at least one key performance indicator and try influence this metric to show a positive result or trend. KPIs should be both logical and achievable. If not, team motivation and morale may decrease as a result of loss of self-confidence. For this reason, we have to be careful and logical when we set key performance indicators. At the same time, we have to check KPIs at regular intervals to determine if they remain valid. We can illustrate a typical KPI life cycle below.
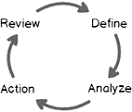
Define: The key performance indicator should be achievable, logical, simple and understandable.
Analyze: We have to analyze the result of key performance indicators at regular intervals and compare target and actual values.
Action: This is the significant process for key performance indicator life cycle. In the analyzing step, we had a basic idea about KPI target value and current value. It means that we measured the difference between KPI target and actual values. If this difference is not acceptable, we have to take action to close the gap and achieve the KPI target value.
Review: In this step, we have to review the result of analysis and actions and check the target goal of key performance indicator value. This value can increase, decrease or may not change at all.
Below, you can find some KPI examples.
- Year over year growth.
- Customer lifetime value
- Return of investments (ROI)
After all these explanations about key performance indicators, we can mention introduce SQL Server Reporting Service key performance indicators. SQL Server Reporting Service offers to add KPI objects directly to the web portal. In the SSRS portal we can set a lot of options for KPIs which we’ll be demonstrating.
Demonstration: As a first step, we will generate a synthetic data for key performance indicator. This data includes sales per past years and sales and target of the current year. We can illustrate this sales data in this table.
| Year | Sales | Target of Last Year |
| 2014 | 77 | 81.6 |
| 2015 | 66 | 81.6 |
| 2016 | 50 | 81.6 |
| 2017 | 60 | 81.6 |
| 2018 | 87 | 81.6 |
The following script will enable us to generate this dataset.
|
1 2 3 4 5 6 7 8 |
CREATE TABLE SalesPerYear (Id INT PRIMARY KEY IDENTITY(1,1), SalesYear INT, Amount Float) INSERT INTO SalesPerYear VALUES ('2014','77'),('2015','66'),('2016','50') ,('2017','60'),('2018','73') |
Before, we start to create a KPI in Reporting Service we have to create Data Source and Dataset.
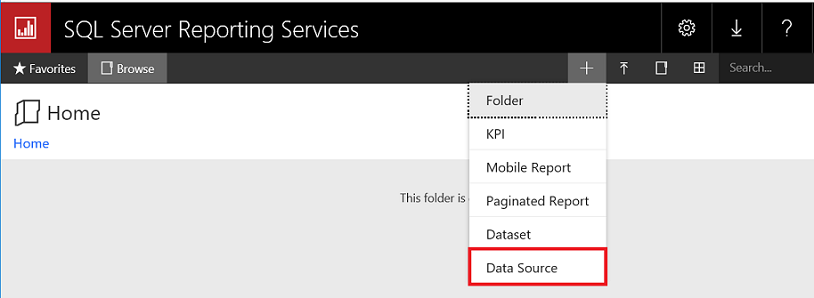
Creating the Data Source
Open the SQL Server Reporting Service home page and navigate (+) icon then click Data Source
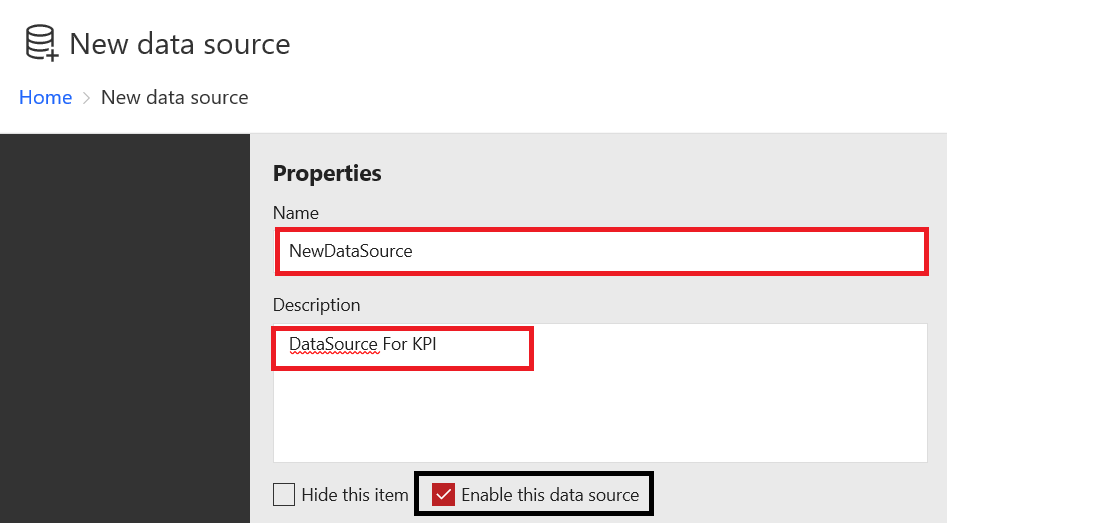
Fill the required fields (Name, Description) and click Enable this data source
In this step, we will define Connection and Credentials options. We will select connection type and then enter the connection string. Finally, fill the credentials options and click test connection.

If you get an error in this step you have to review your connection string and database connection credentials.
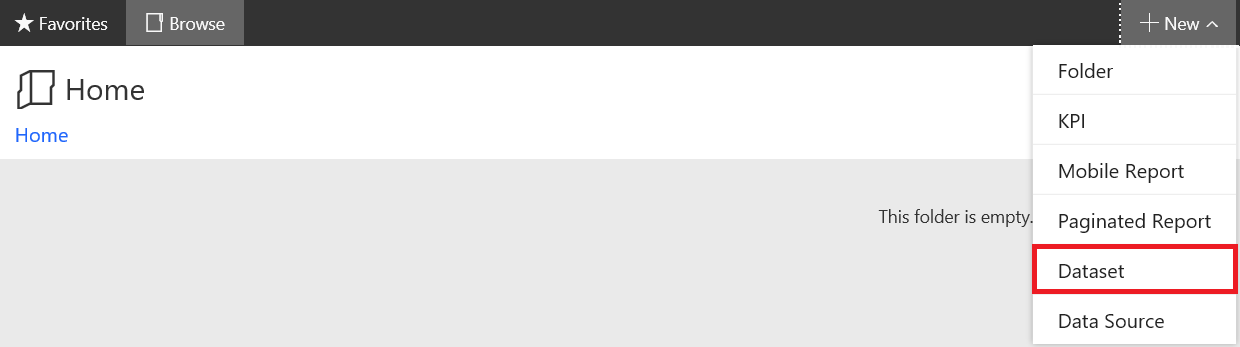
Creating a dataset
In this step, we will create dataset to use for the KPI. The Dataset will allow us to connect the result of query to the key performance indicator object.
Open the SQL Server Reporting Service home page and navigate (+) icon then click Data Set
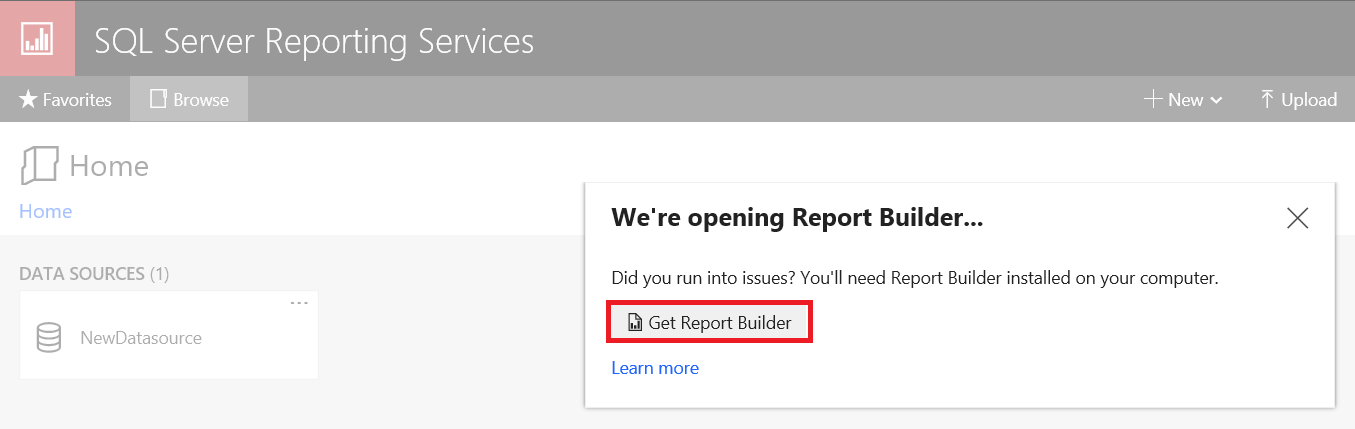
When you click Dataset, Microsoft SQL Server Report Builder will open. If SQL Server Report Builder is not installed on your computer, you can click the Get Report Builder link in the pop-up screen which appears in the Reporting Service home page and you can download Report Builder installation package.
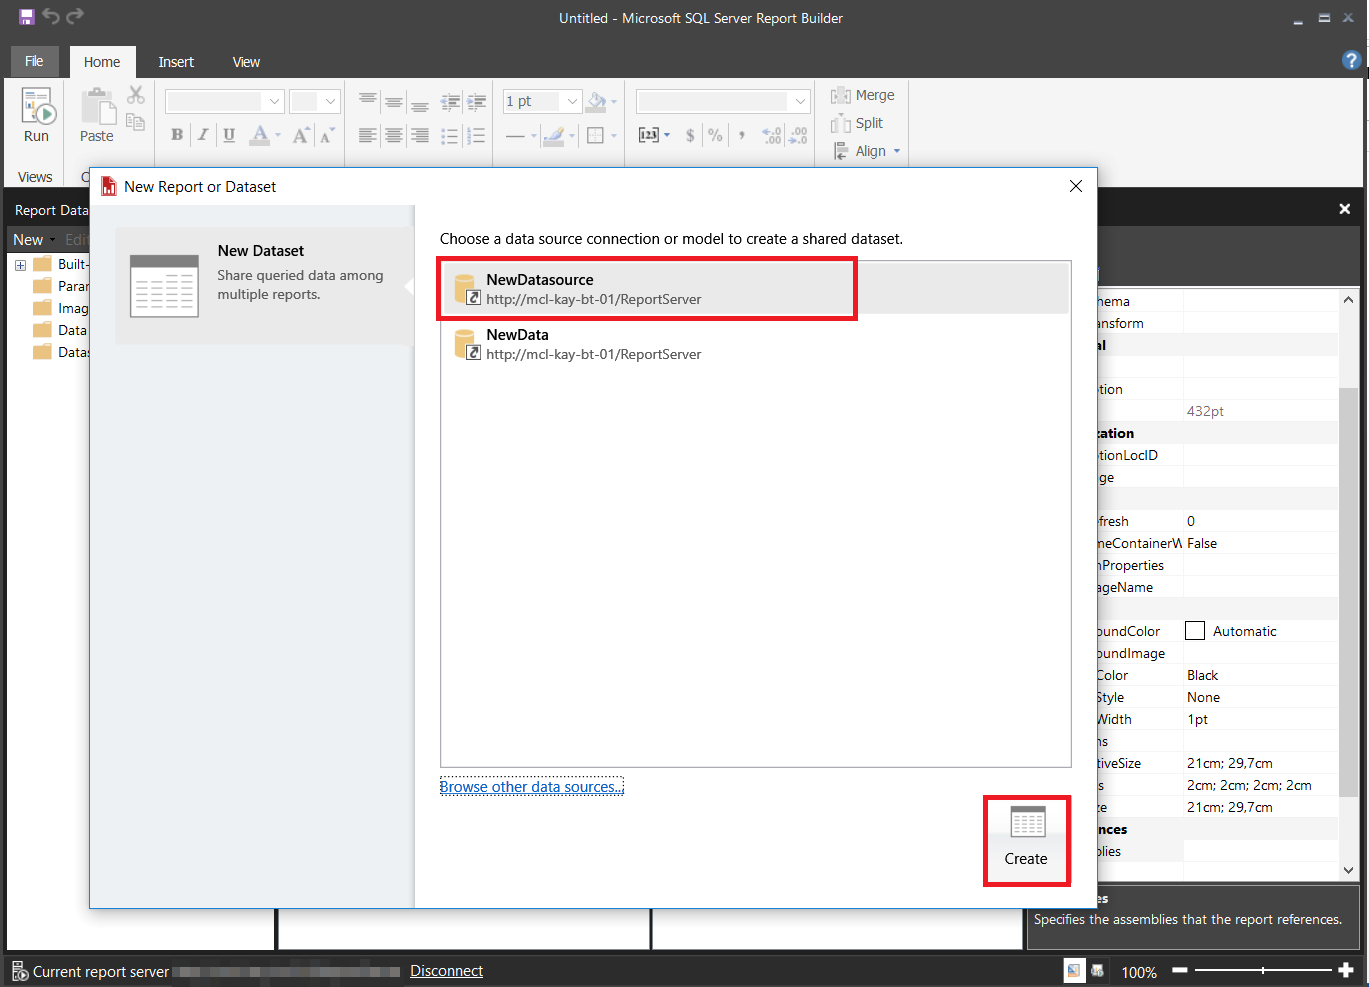
We will select our data source which we defined in the data source step and click Create.
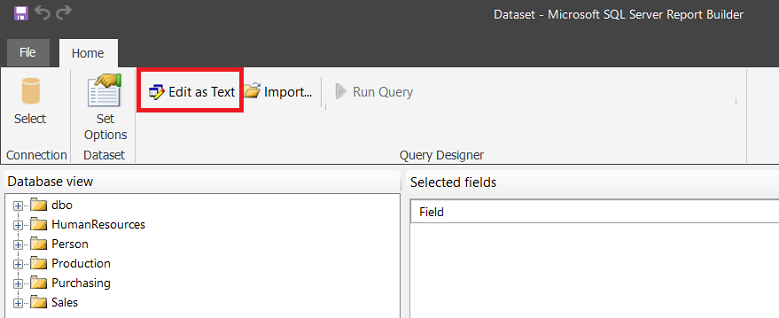
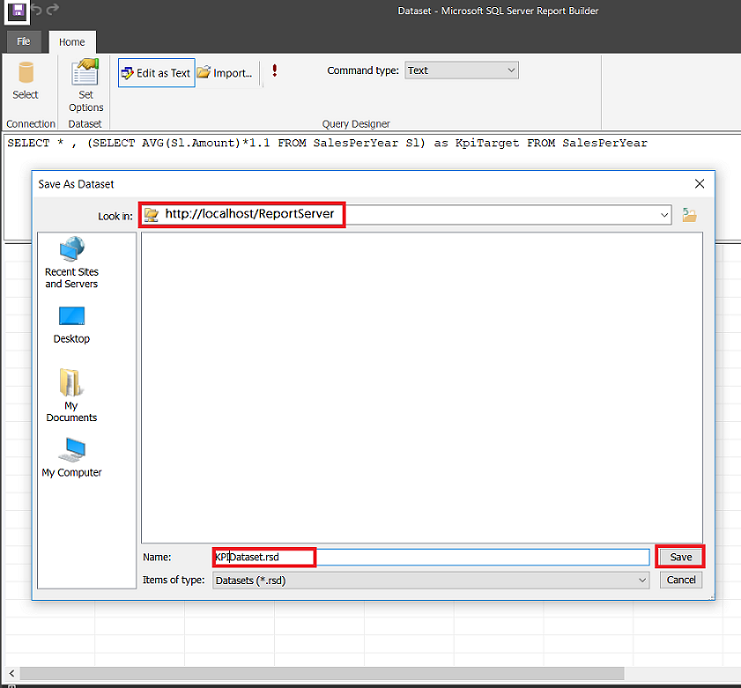
In the Dataset panel click Edit as Text.
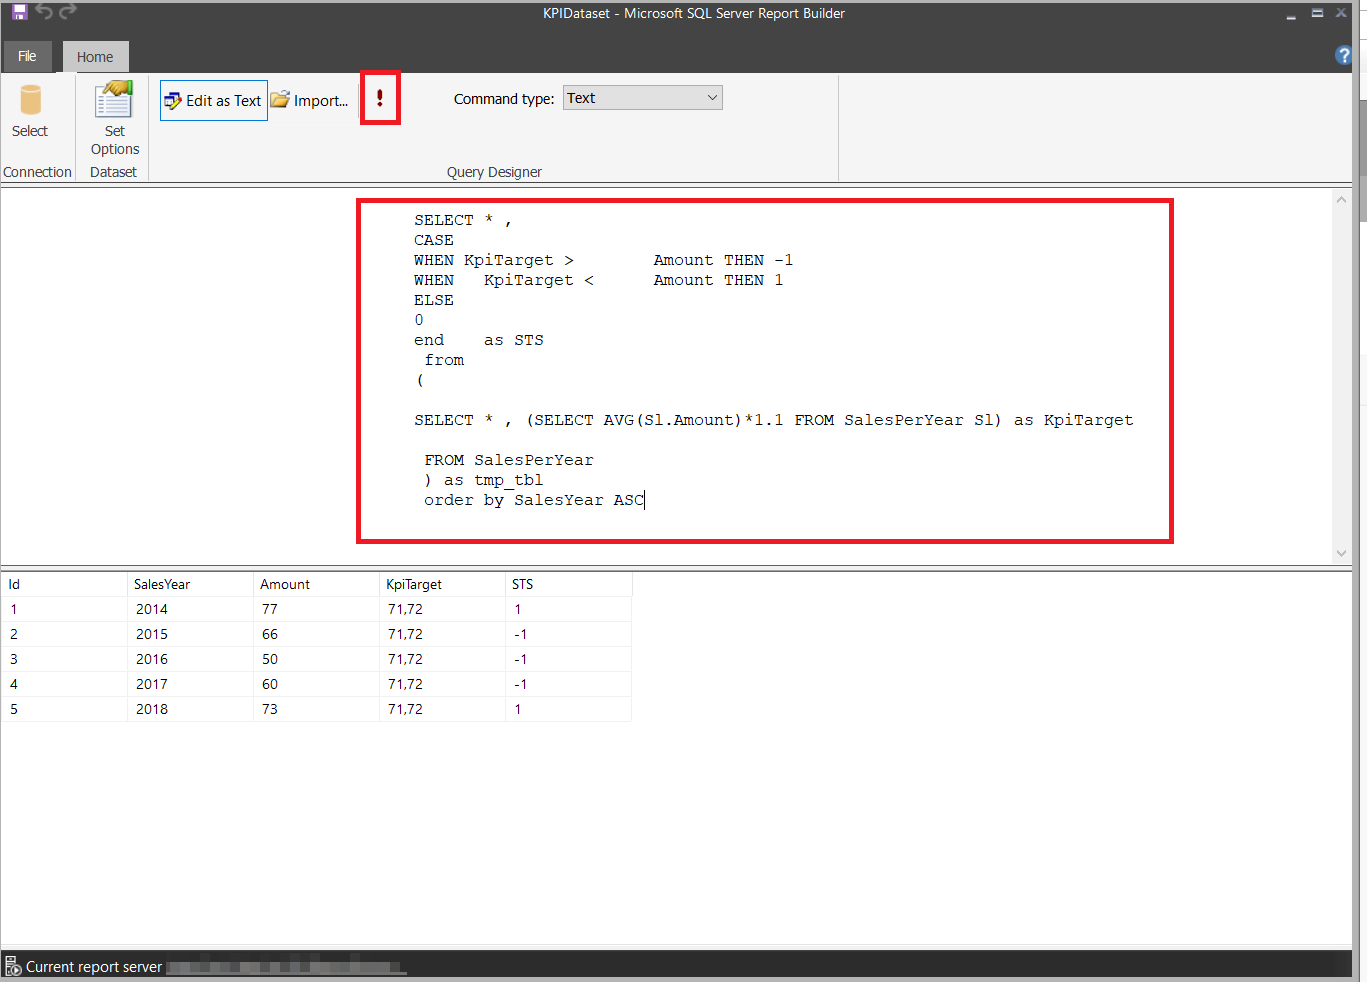
Write or paste the query to query designer text box. Click (!) run button to test query.
|
1 2 3 4 5 6 7 8 9 10 11 12 13 14 15 |
SELECT * , CASE WHEN KpiTarget > Amount THEN -1 WHEN KpiTarget < Amount THEN 1 ELSE 0 END AS Sts FROM ( SELECT * , (SELECT AVG(Sl.Amount)*1.1 FROM SalesPerYear Sl) as KpiTarget FROM SalesPerYear ) as tmp_tbl order by SalesYear ASC |
After all these steps, we will save dataset to Reporting Service.
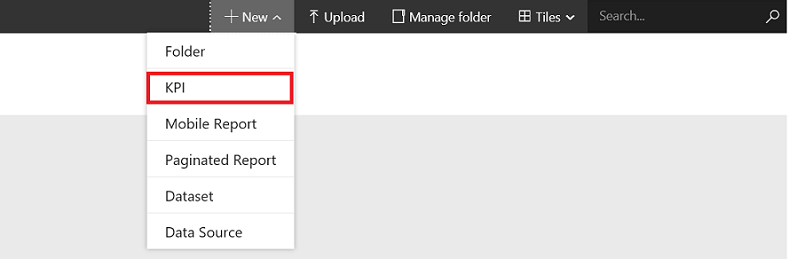
Create KPI
Open the SQL Server Reporting Service home page and navigate (+) icon then click KPI
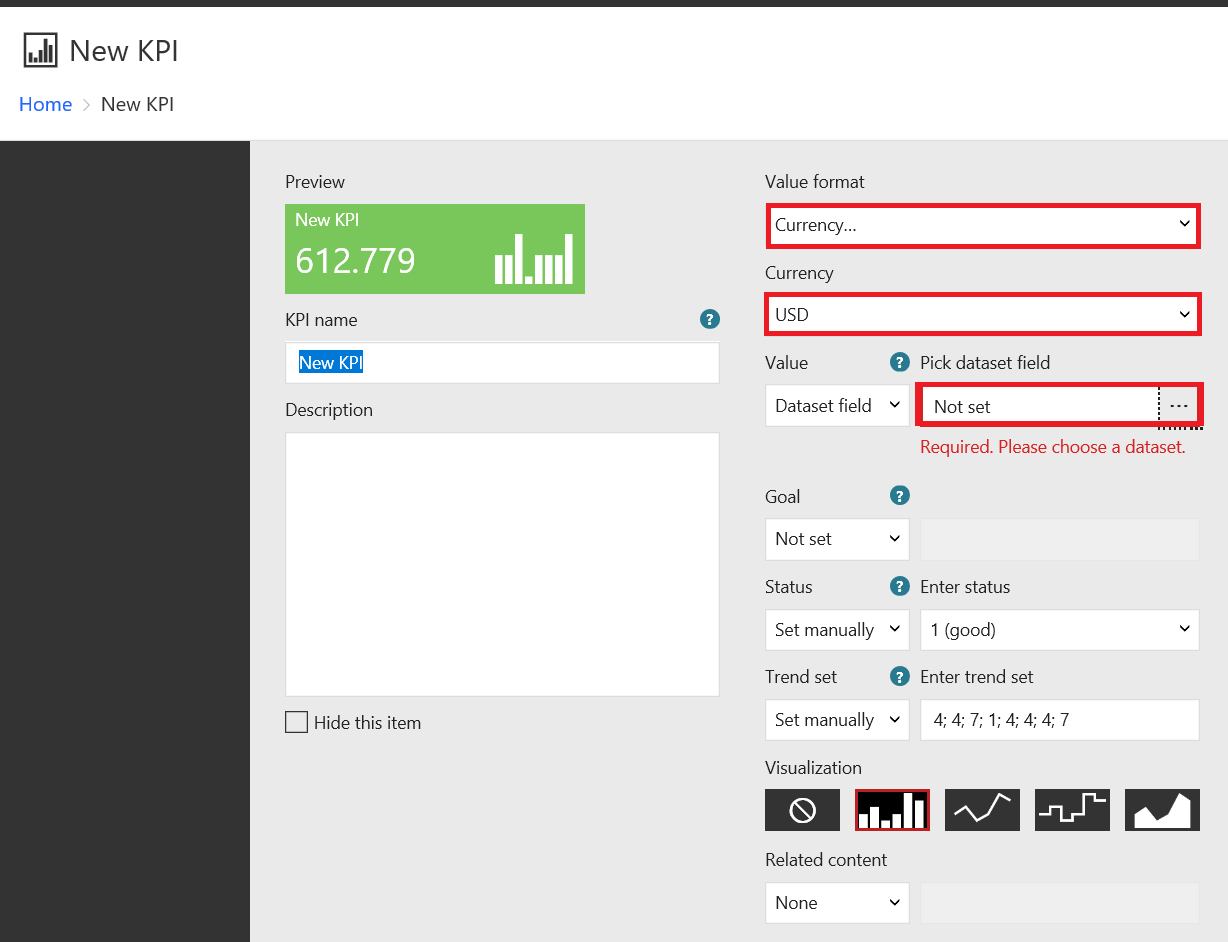
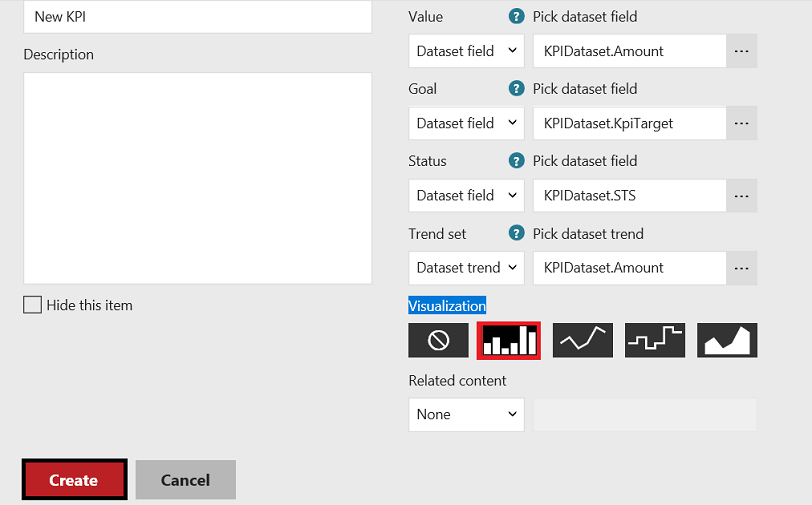
In the New KPI panel, we can see some options which change KPI visualization
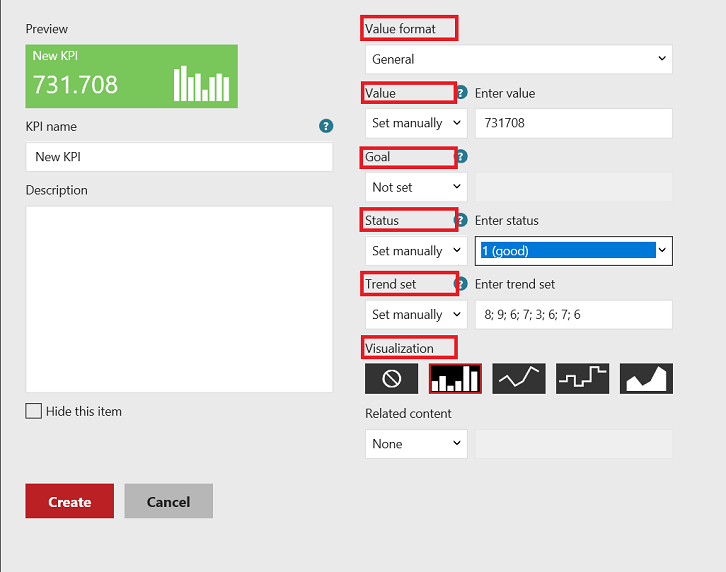
Value Format: This option provides us the option to change the format of the KPI value. In this option, we can choose currency, abbreviated or percent formats.
Value: This field identifies the actual value of the key performance indicator. This value shows us the current situation.
Goal: This field identifies target value of key performance indicator.
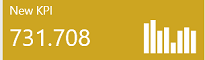
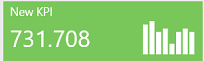
Status: This field compares the key performance indicator value and goal scores. It has only three options -1 bad, 0 (neutral) and 1 (good). At the same time, this values changes the color of the KPI.
Trend Set: In this field, we can visualize changing of past KPI values in the trend chart. In this demo, the past year’s sales amount can be viewed.
Visualization: In this option, we can enable and chose the type of trend chart.
After all these definitions we can start to create a key performance indicator.
We will choose Dataset field for Value text box and click browse button.
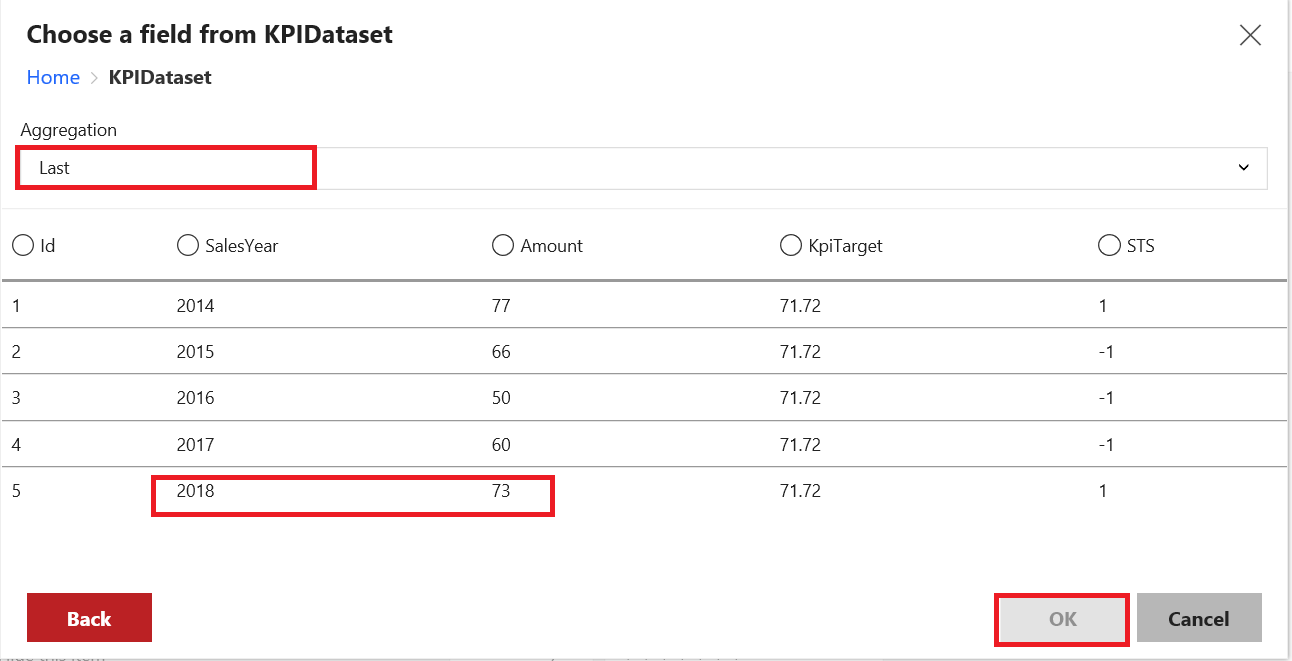
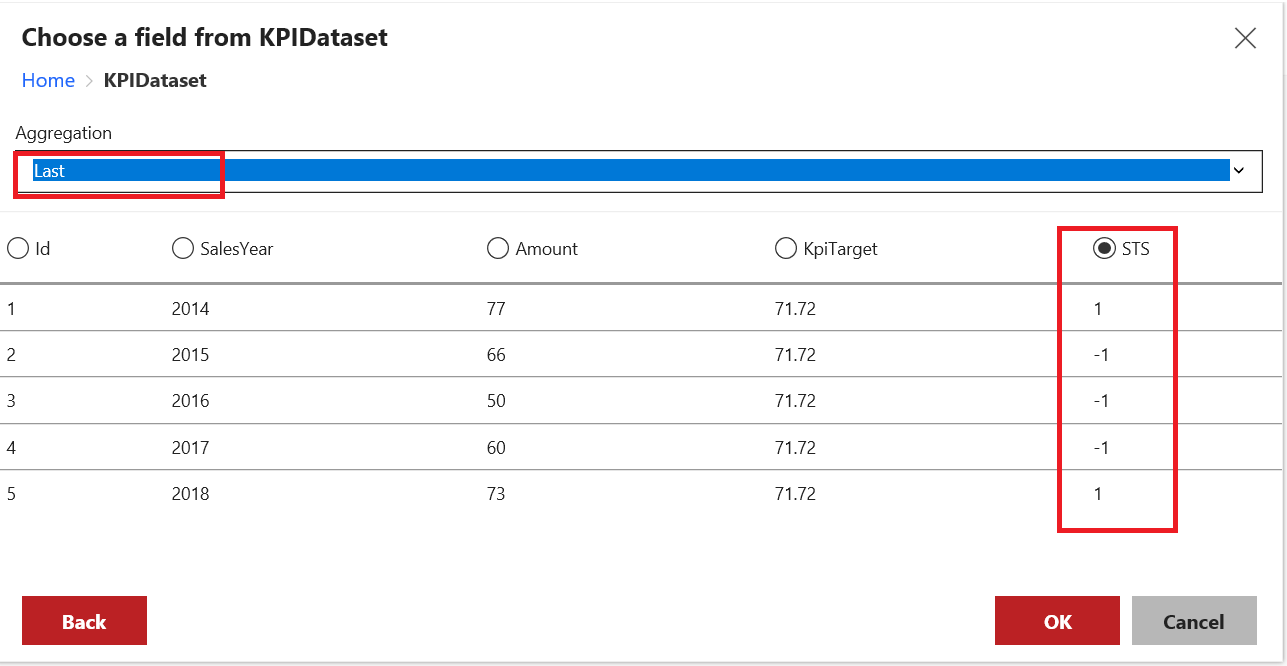
In this screen, we will select the current value in the dataset. According to our demo data, the last year (2018) refers to our current KPI value. Therefore, we will choose Amount field and set aggregation Last.
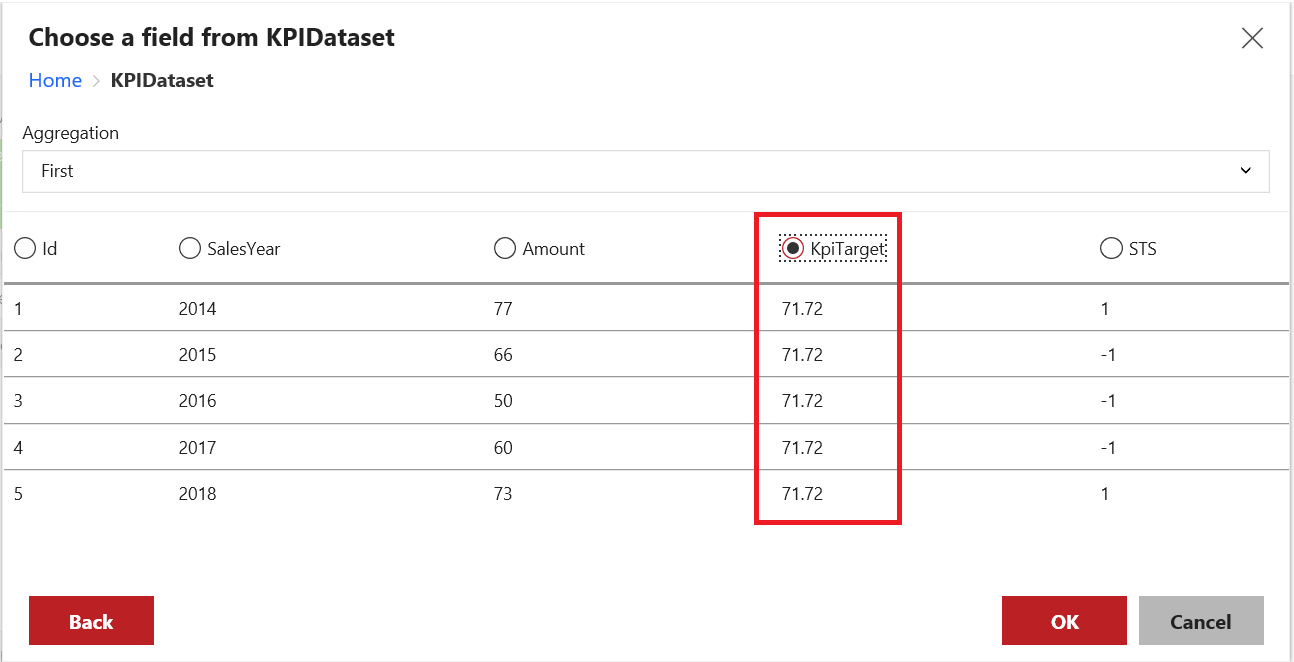
Now, we will set the Goal field. We will choose Dataset field for Value text box and click browse button. We will choose KPITarget field. All field values are the same which is why the aggregation field can be selected at last or first.
We will set the Status field. We will choose Dataset field for Value text box and click browse button. We will choose STS Field.
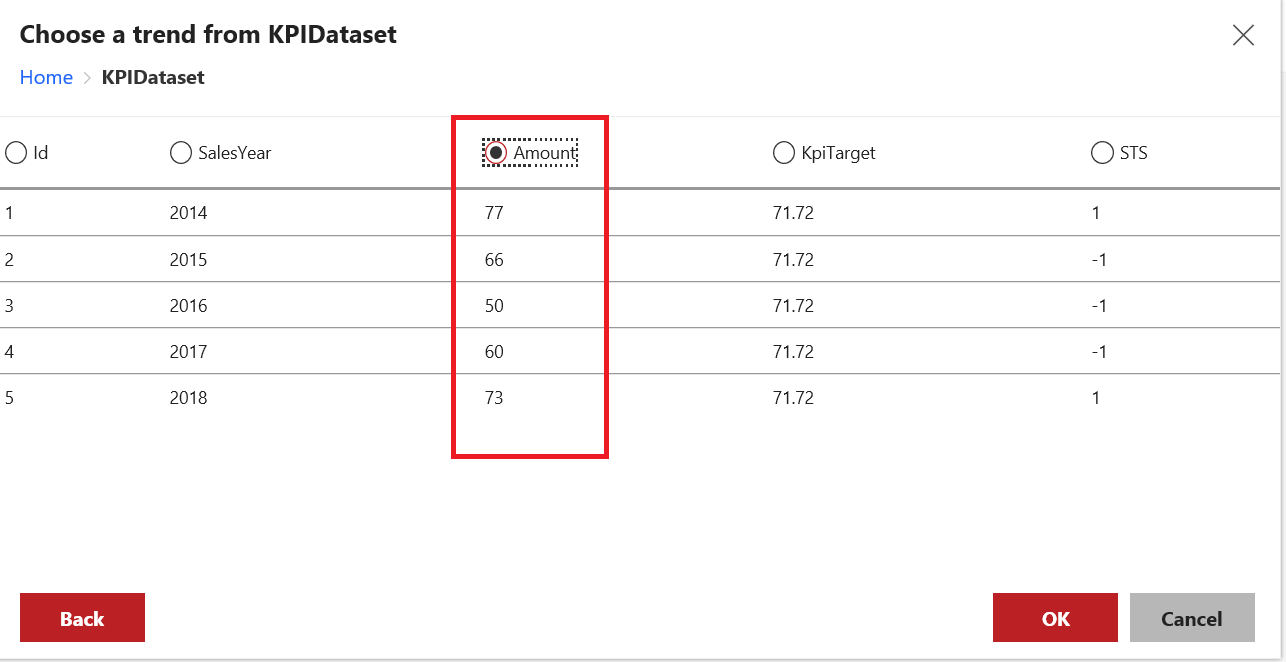
We will set the Trend Set field. We will choose Dataset field for Value text box and click browse button. We will choose the Amount field.
Finally, we will choose Visualization for trend chart and click create.
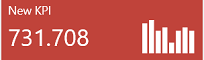
After all these steps, our KPI is ready.
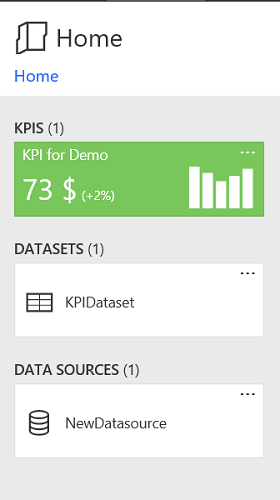
Now we will review part of KPI values with this image
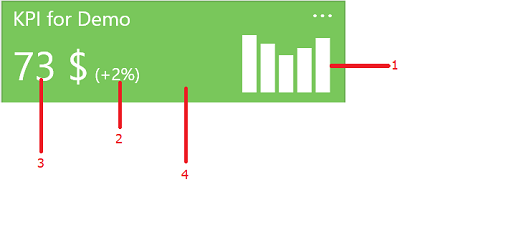
- Trend chart
- Changing percentage of goal and value of KPI
- Actual value of KPI
- Status field which defines back color of KPI
Conclusion
In this article, we discussed key performance indicators and how to create KPIs in SQL Server Reporting Services. Reporting service KPI‘s are a convenient and efficient way to analyze and compare metrics in SQL Server.
References
- Working with KPIs in Reporting Services
- Introduction to Key Performance Indicators
- Report Datasets (SSRS)

Most of his career has been focused on SQL Server Database Administration and Development. His current interests are in database administration and Business Intelligence. You can find him on LinkedIn.
View all posts by Esat Erkec
- SQL Performance Tuning tips for newbies - April 15, 2024
- SQL Unit Testing reference guide for beginners - August 11, 2023
- SQL Cheat Sheet for Newbies - February 21, 2023