
In this article, we are going to learn about the various DAX functions that are available for the summarization and aggregation of data. DAX, abbreviated as Data Analysis Expressions, is developed by Microsoft as a scripting language to interact with the Microsoft Business Intelligence stack, such as Power BI, SSAS Tabular, Power Pivot, etc. If you have prior experience working with Microsoft Excel, learning DAX Functions will not be too much of a hassle for you. One of the most popular tools in the BI market that uses DAX Functions is Power BI. Power BI can be used without using DAX, however, using DAX Functions in Power BI helps us to build powerful data models which also helps in performance optimization.
In this article, we are going to understand the basic usages of the summarization in DAX functions:
- SUMMARIZE
- SUMMARIZECOLUMNS
Preparing the Data Model
For the purpose of this tutorial, I am going to use the famous WideWorldImportersDW database. The WideWorldImportersDW is a fictitious data warehouse that has been provided by Microsoft for demonstration purposes. You can download the backup of this data from GitHub and restore it to your local SQL Server database. Once the database has been restored, you can import the database into Power BI. Let’s go ahead and import the WideWorldImportersDW database to the Power BI Data model.
Open Power BI Desktop and click on Get Data. Select SQL Server from the dropdown menu and provide the server details and click OK.
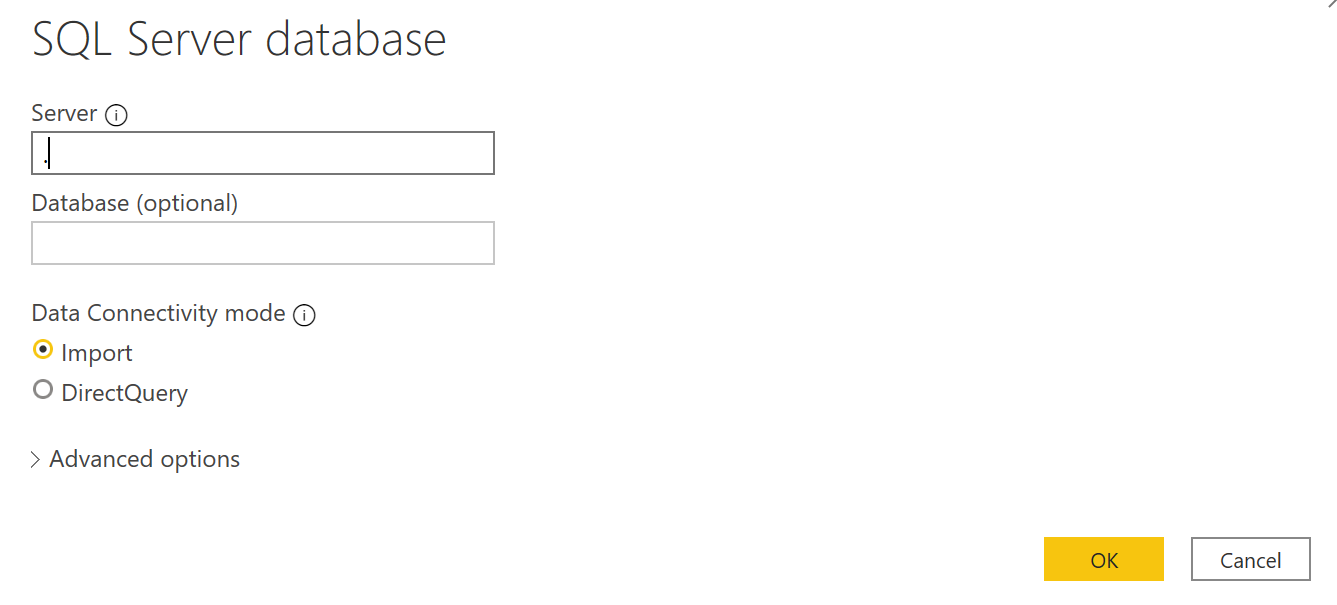
Figure 1 – Provide the SQL Server details to connect to the database engine
From the list of databases, select WideWorldImportersDW and then select the tables that you would want to import. For this demonstration, I am only fetching the following six tables to the Power BI Data Model. Click Load once done.
- Dimension.City
- Dimension.Customer
- Dimension.Date
- Dimension.StockItem
- Fact.Order
- Fact.Sale
Once all the tables are loaded into Power BI, you can see them on the right pane.
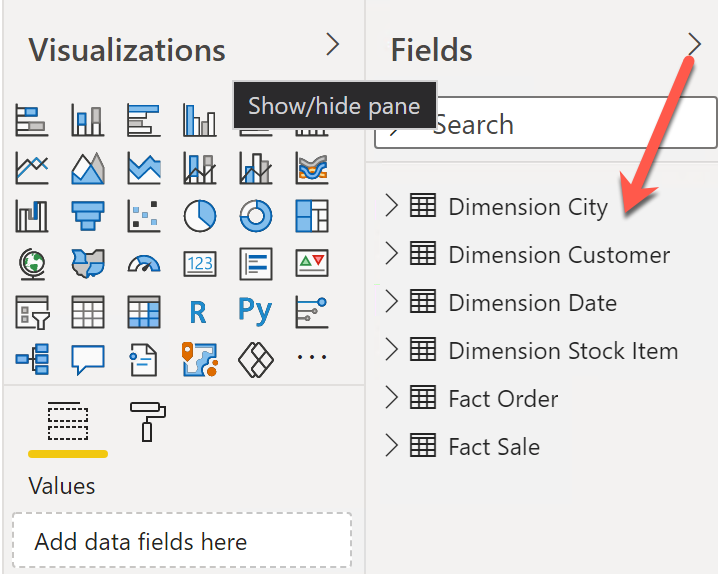
Figure 2 – Tables from the data warehouse has been imported into Power BI
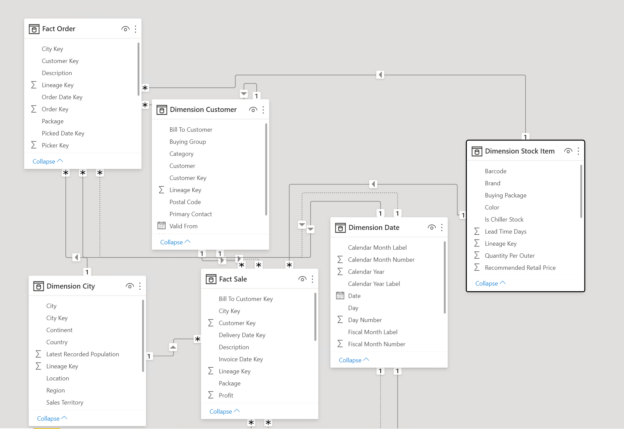
Once all the tables are fetched into the Power BI Data Model, the relationships will be established automatically. You can still view the relationships between the different tables by navigating to the Model tab on the pane on the left.
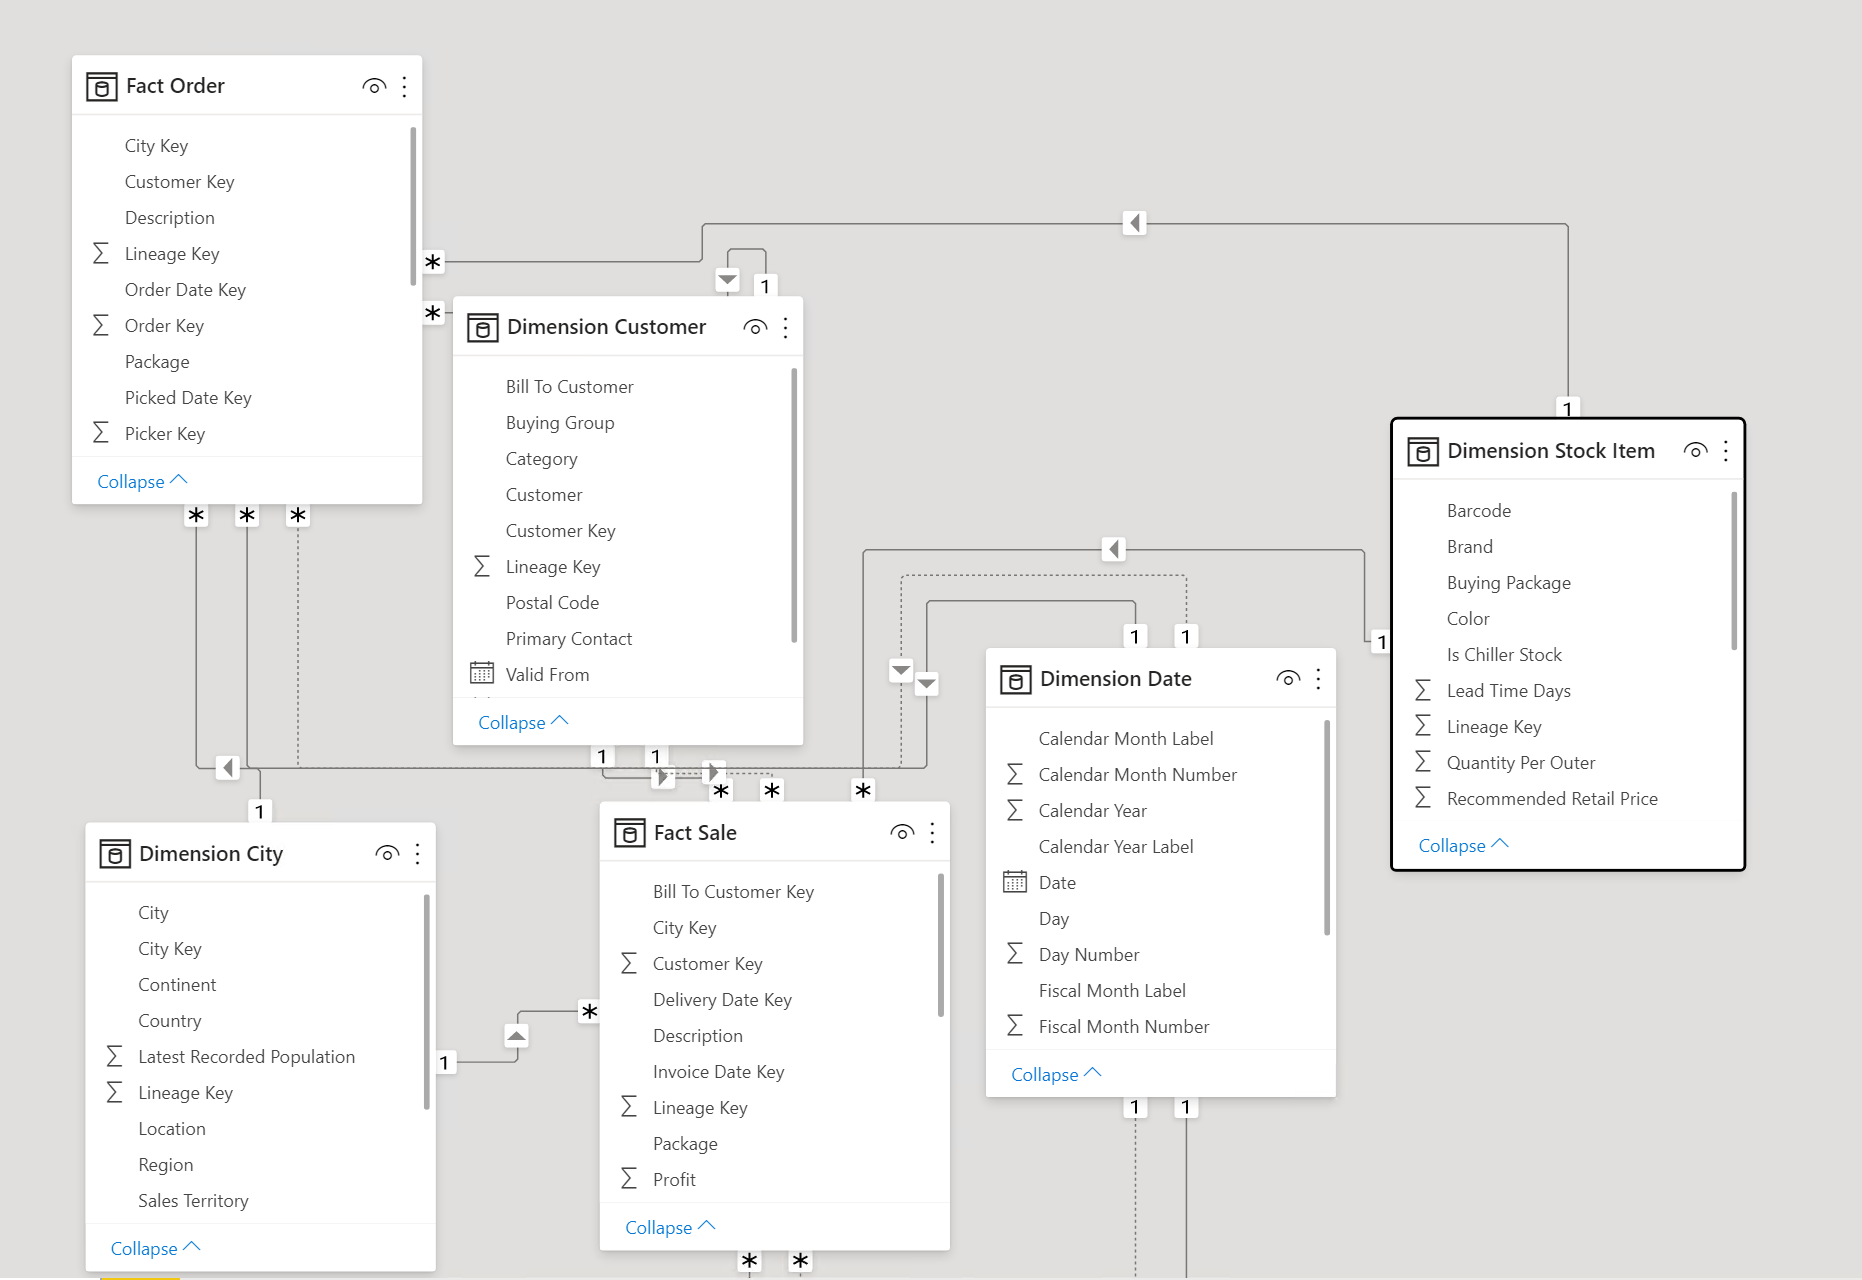
Figure 3 – The relationships in the Power BI Data Model
As you can see in the figure above, the relationships between the tables that we have imported in the previous step have been automatically established. This means that we are good to start building our visuals or enhancing the data model now.
Head over to the Power BI Desktop and select the Table visual type. Bring in the following columns to the Values pane and build the visual as follows.
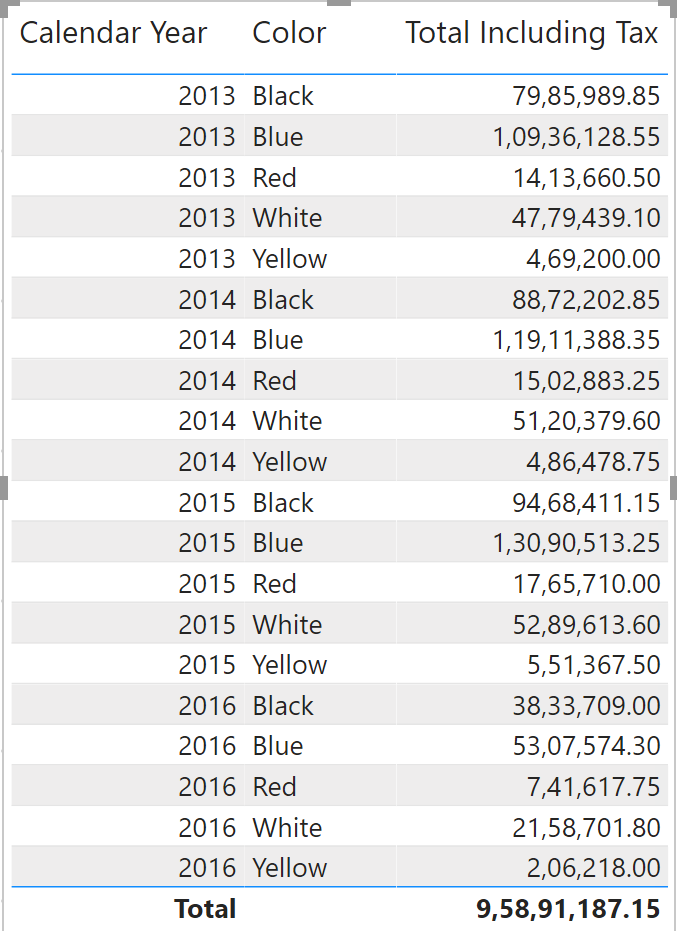
Figure 4 – Building the basic Table Visual in Power BI Desktop
In this table, we have the Total Sales (Including Tax) grouped by Year and Color. This table is built from the base data model i.e. the raw underlying data. Since this is a sample database, the actual number of rows in the data model is quite less. However, when in an actual production scenario, where the number of records in the Fact table will be more than 3-4 million, in that cases, Power BI will start facing performance issues as it has to perform the aggregation again and again on the raw data to build up this visual. To tackle this, we can build up pre-aggregated or summarized tables in the Power BI data model that can be consumed by other visuals within the report.
Summarization and Aggregation – DAX Functions
Now that we have the Power BI Data Model ready, let us start by building the aggregate tables by using the Summarization functions. In this article, we are going to talk about the following two types of summarization functions available in DAX.
- SUMMARIZE
- SUMMARIZECOLUMNS
Both of these functions are used to create summarised tables. The difference between the two is that the SUMMARIZE function allows us to have a row and a filter context within the expression whereas the SUMMARIZECOLUMNS function only allows us to have a filter context and no row context. Let us learn in detail about both these functions now.
SUMMARIZE DAX Function
As per the official documentation from Microsoft, the syntax for the SUMMARIZE function is stated as follows.
|
1 |
SUMMARIZE (<table>, <groupBy_columnName>[, <groupBy_columnName>]…[, <name>, <expression>]…) |
Let us understand the details of each of the parameters in the SUMMARIZE function.
- Table – This is the name of the table on which the summarized calculations will be performed
- GroupBy_ColumnName – The list of columns from the data model on which the measures are to be aggregated
- Name – The name of the new column that will store the summarized information
- Expression – The analytical expression that is used to create the aggregated column, for example, SUM(), AVG() etc. This has to return a scalar value that can be calculated for each row
Let us see this in action now. Navigate to the Power BI Desktop and click on New Table under Modeling. A new DAX pane will appear where you can write the following DAX code.
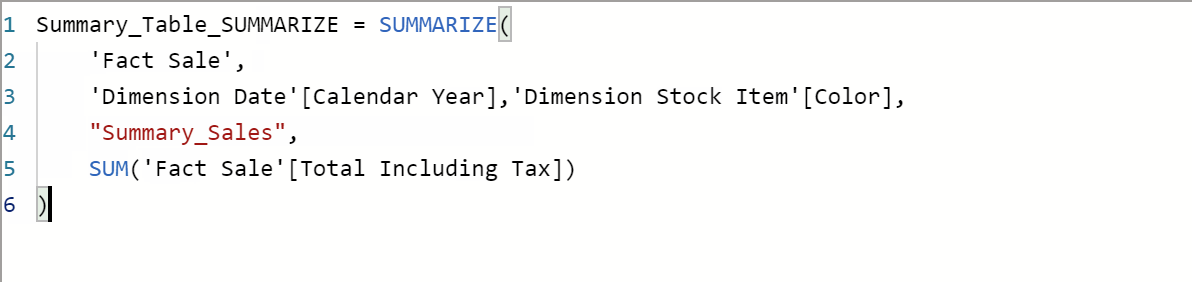
Figure 5 – Creating the new table using SUMMARIZE function
As you can see in the figure above, we have created a new table with the name “Summary_Table_SUMMARIZE” that will contain the three columns. We can create a matric visual from the data of this visual as follows.
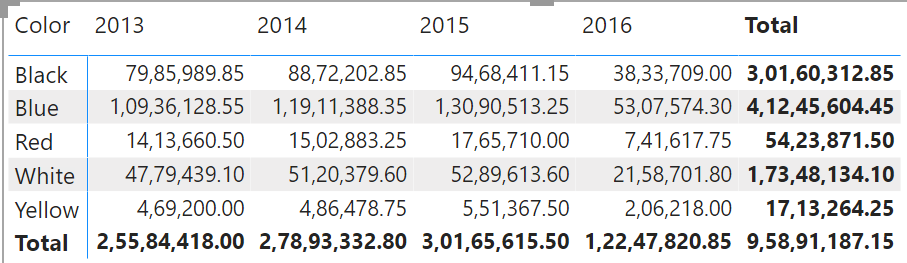
Figure 6 – Summary Table created using the SUMMARIZE Function
SUMMARIZECOLUMNS – DAX Function
The syntax for the SUMMARIZECOLUMNS function is a bit different from the SUMMARIZE function. It can be used as follows.
|
1 |
SUMMARIZECOLUMNS( <groupBy_columnName> [, < groupBy_columnName >]…, [<filterTable>]…[, <name>, <expression>]…) |
The parameters used in the SUMMARIZECOLUMNS functions are as follows:
- GroupBy_ColumnName – The list of columns from the data model on which the measures are to be aggregated
- FilterTable – This is a table-valued expression that can be used to filter the data on the summarized table
- Name – The name of the new column that will store the summarized information
- Expression – The analytical expression that is used to create the aggregated column, for example, SUM(), AVG(), etc. This has to return a scalar value that can be calculated for each row
Likewise, let us head over to Power BI Desktop again and try to build a new table, but using the SUMMARIZECOLUMNS function this time. In this function, we will also use a filter context to demonstrate how to create summarizations with filtered data in DAX. In the DAX pane, write the following formula to create the summarized table with a filter.
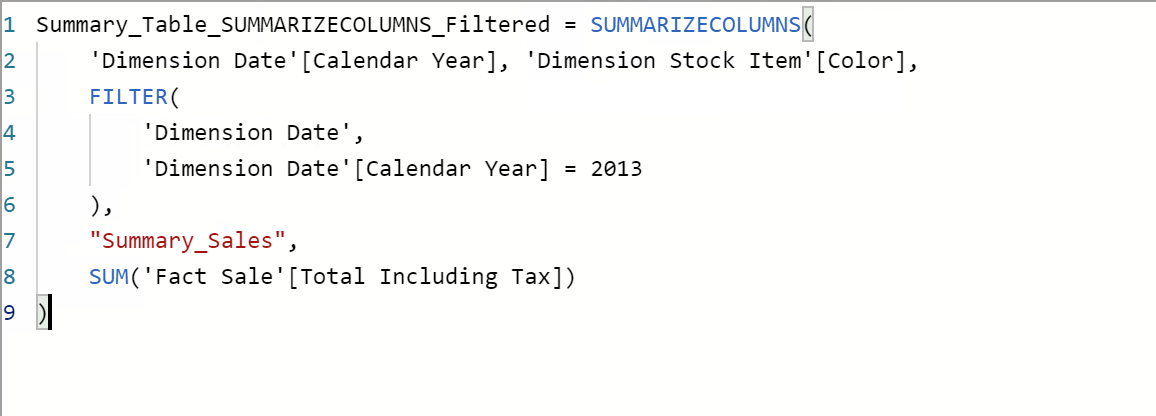
Figure 7 – Summarization in DAX with SUMMARIZECOLUMNS Function
As you can see in the figure above, we have added a filter on the Calendar Year column. This is done by using the FILTER() function. This will return the summarized table with only data from the specified year in the filter. A simple visual can be built from the columns of this table as follows.
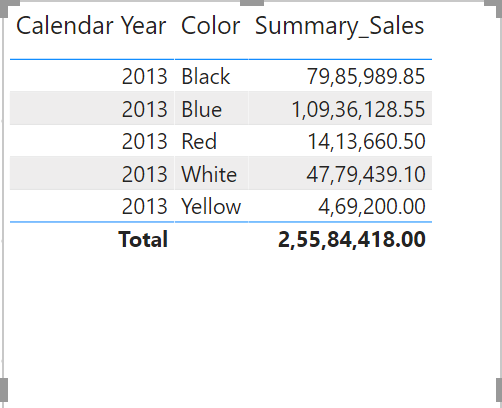
Figure 8 – Summary visuals with FILTER
Conclusion
In this article, we have learned about using the summarization and aggregation techniques using DAX Functions. DAX is a formula-based scripting language that you can use to create data models within Power BI. You can also use DAX to create calculated columns and calculated measures. These calculated columns and measures can be used in the visuals and charts. An example of a calculated column is a value based on some other column in the dataset. Calculated measures are usually aggregated measures of a numeric column from the dataset.
To learn more about DAX, you can follow the official guide from Microsoft. Alternatively, you can also follow the DAX.guide.

He is a prolific author, with over 100 articles published on various technical blogs, including his own blog, and a frequent contributor to different technical forums.
In his leisure time, he enjoys amateur photography mostly street imagery and still life. Some glimpses of his work can be found on Instagram. You can also find him on LinkedIn
View all posts by Aveek Das
- Getting started with PostgreSQL on Docker - August 12, 2022
- Getting started with Spatial Data in PostgreSQL - January 13, 2022
- An overview of Power BI Incremental Refresh - December 6, 2021