

Introduction
There is a common need in reporting to aggregate or return data that is crunched based on date attributes. Calendars themselves can vary and provide differing insight into a business, data, and finance. They also assist in taking the intrinsically messy Gregorian calendar and making it easier to work with.
All About the Gregorian Calendar
Our most commonly used calendar is the Gregorian calendar. While very familiar to us, it is something that has grown organically over the course of millennia. As it evolved, no one considered modern financial reporting or data analytics needs that would be complicated by its structure.
For common everyday use, it is a fine calendar, but if our goal is to carefully analyze any data over time, then it has a variety of implicit shortcomings:
- Months are not composed of the same number of days. They can have 28-31 days, making it difficult to compare one month to the next easily.
- Months, quarters, and years can start on different weekdays, which can result in significant variations when comparing data year-to-year.
- The number of a given weekday in a month can vary. It’s possible for some months to contain 4 Mondays, while others have 5.
- The addition of a day for leap years does not significantly increase the length of the year, but does add a shift to dates for the remainder of the year that can affect year-to-year reporting in ways that do not occur in other years.
- Common numbers used in math are 7, 28, 29, 30, 31, 365, and 366, which rarely result in clean or simple calculations.
These properties of our calendar are often tolerated and worked around, but can make our reporting efforts return data that is not as meaningful as it should be. For example, if the year starts on a Saturday, then the first week of the year contains one day, whereas it would contain seven days if it began on Sunday.
The number of weekends in each month also vary, which for any business that has significantly higher or lower activity on weekends can also lead to inconsistent reporting. A business that sees 5% growth in March, but a 5% contraction in April would want those numbers to not be the result of calendar quirks, but instead actual events that require further examination.
In addition to these various inconveniences, not all countries use identical calendars. For example, much of the world has their weeks start on Monday, rather than Sunday. This may seem like a minor change, but it causes all calculations involving weeks to be adjusted. As a result, an event that occurs on a Sunday will belong to a different week in France than it would in the United States, and therefore would result in different metrics when broken down into weeks.
Lastly, businesses choose their own fiscal calendar, which may begin and end on a different set of months than our typical January-December calendar year. This can result in years beginning in July or October, and fiscal quarters beginning and ending similarly at any time of the year. There are many reasons why a company may want to start their calendar in a month besides January, such as the date of their founding, busy times of year, or to maintain consistency with the rest of their industry.
The Merchant Calendar
The most common alternate calendar that is used when working with retail businesses is the Merchant Calendar. This calendar was first devised in the 1930s and breaks the year into more consistent time periods for months and quarters. Under the merchant (also known as the 4-5-4 calendar), each month contains 4 or 5 complete weeks. Each quarter contains three months, two with 4 weeks and one with 5 weeks.
Each year begins on a Sunday and ends on a Saturday, allowing any time period we analyze to have consistent data across weekdays. An upshot of this is that most holidays now occur in the same exact time period each year. This removes the complexity of an important business day occurring within different weeks.
It is important to note that the merchant calendar is implemented differently by different businesses based on their activity over the course of the year. Many companies will commonly begin it in February, in an effort to completely encapsulate the end-of-year holidays in a single calendar year. Others choose to begin in July, October, or in January, depending on their business needs. For our work here, we will follow the recommendation of the National Retail Federation and begin it in February. Shifting the calendar to begin during other times of the year is relatively simple, and could benefit a business that is not retail-oriented, or has differing priorities and reporting needs.
The following shows the first two months of the merchant calendar for 2017 – 2019. Note that the first day can consist of a day near the end of January or the beginning of February. This is based solely on the day of week the year begins on and is consistent from year-to-year.
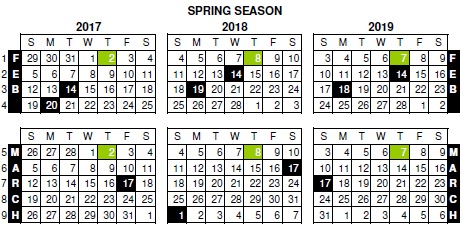
Note that each month of the year will always have the same number of weeks (4 or 5). For reference, it’s possible to calculate the first day of the merchant year as follows:
|
1 2 3 |
DATEADD(DAY, 28 + CASE DATEPART(WEEKDAY, @First_Date_of_Year) WHEN 1 THEN 0 ELSE 8 - DATEPART(WEEKDAY, @First_Date_of_Year) END, @First_Date_of_Year); |
This results in the start of the merchant year being on the Sunday closest to the start of February. The end of the year follows similarly:
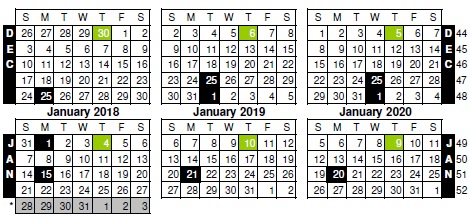
The first eye-catching callout is the extra week in 2017-2018. As with any calendar that is constructed based on non-scientific methods, the year length does not fully account for the time it takes for Earth to revolve around the sun. As a result, we need to implement leap years every 6-7 years in order to ensure that the calendar does not continue to drift over time.
Implementing a leap year is relatively simple: Add a week to the end of a year in which the first day would no longer be the closest Sunday to the start of February. This pushes the first day of the calendar to the correct day, but introduces a major complexity into the calendar in that about 15% of all years will have an entire extra week.
Different businesses manage this extra week differently. Some simply include it as-is and will have occasional years/months/quarters with higher numbers. Others restate their calendar by removing the first week of the year (typically a slow business week) completely, and renumber all other weeks accordingly. It’s also acceptable to simply leave off the extra week from reporting as that final week is also a relatively slow business week in many industries.
All of these methods of implementing and restating the merchant calendar are accepted for GAAP use, and most other common accounting and business reporting practices.
We can create a number of columns within a calendar table that manage various merchant calendar metrics, similarly to how we create metrics based on the standard Gregorian calendar. Any variables here are either ones derived from the Gregorian calendar, or those we have already calculated below and are reusing. Here are the merchant calendar aspects we will work with in this example:
Merchant calendar: First day of year:
|
1 2 3 |
DATEADD(DAY, 28 + CASE DATEPART(WEEKDAY, @First_Date_of_Year) WHEN 1 THEN 0 ELSE 8 - DATEPART(WEEKDAY, @First_Date_of_Year) END, @First_Date_of_Year); |
Merchant calendar: First day of next year:
|
1 2 3 |
DATEADD(DAY, 28 + CASE DATEPART(WEEKDAY, @First_Date_of_Next_Year) WHEN 1 THEN 0 ELSE 8 - DATEPART(WEEKDAY, @First_Date_of_Next_Year) END, @First_Date_of_Next_Year); |
Merchant calendar: First day of last year:
|
1 2 3 |
DATEADD(DAY, 28 + CASE DATEPART(WEEKDAY, @First_Date_of_Last_Year) WHEN 1 THEN 0 ELSE 8 - DATEPART(WEEKDAY, @First_Date_of_Last_Year) END, @First_Date_of_Last_Year); |
It is worth noting that some of these values may not be needed explicitly in reporting, but do make our ability to populate additional metrics easier. Feel free to omit anything that you don’t find directly useful in your implementation. These calculations also reply on values we determined in previous articles (such as the first date of the year) and can be acquired fairly easily.
If the date being processed happens to be before the beginning of the merchant calendar year, which will tend to happen when making calculations at the start of the year, we can adjust accordingly:
|
1 2 3 4 5 6 7 8 |
IF @Date_Counter < @Merchant_First_Date_of_Year BEGIN SELECT @Merchant_First_Date_of_Next_Year = @Merchant_First_Date_of_Year; SELECT @Merchant_First_Date_of_Year = @Merchant_First_Date_of_Last_Year; SELECT @Merchant_First_Date_of_Last_Year = DATEADD(DAY, 28 + CASE DATEPART(WEEKDAY, @First_Date_of_Two_Years_Ago) WHEN 1 THEN 0 ELSE 8 - DATEPART(WEEKDAY, @First_Date_of_Two_Years_Ago) END, @First_Date_of_Two_Years_Ago); END |
Merchant calendar last date of the year:
|
1 2 3 |
DATEADD(DAY, -1, @Merchant_First_Date_of_Next_Year); |
Merchant day of the year:
|
1 2 3 |
DATEADD(DAY, -1, @Merchant_First_Date_of_Next_Year); |
Merchant week of the year:
|
1 2 3 |
((@Merchant_Day_of_Year - 1) / 7) + 1; |
Merchant calendar month:
|
1 2 3 4 5 6 7 8 9 10 11 12 13 14 15 16 |
CASE -- 4-5-4 monthly schedule WHEN @Merchant_Week_of_Year BETWEEN 1 AND 4 THEN 1 -- 4 weeks WHEN @Merchant_Week_of_Year BETWEEN 5 AND 9 THEN 2 -- 5 weeks WHEN @Merchant_Week_of_Year BETWEEN 10 AND 13 THEN 3 -- 4 weeks WHEN @Merchant_Week_of_Year BETWEEN 14 AND 17 THEN 4 -- 4 weeks WHEN @Merchant_Week_of_Year BETWEEN 18 AND 22 THEN 5 -- 5 weeks WHEN @Merchant_Week_of_Year BETWEEN 23 AND 26 THEN 6 -- 4 weeks WHEN @Merchant_Week_of_Year BETWEEN 27 AND 30 THEN 7 -- 4 weeks WHEN @Merchant_Week_of_Year BETWEEN 31 AND 35 THEN 8 -- 5 weeks WHEN @Merchant_Week_of_Year BETWEEN 36 AND 39 THEN 9 -- 4 weeks WHEN @Merchant_Week_of_Year BETWEEN 40 AND 43 THEN 10 -- 4 weeks WHEN @Merchant_Week_of_Year BETWEEN 44 AND 48 THEN 11 -- 5 weeks WHEN @Merchant_Week_of_Year BETWEEN 49 AND 53 THEN 12 -- 4 weeks (5 weeks during 4-5-4 leap years, in which case we add the final week, 53, into a 4-5-5 month) END; |
Merchant calendar quarter:
|
1 2 3 4 5 6 7 8 |
CASE WHEN @Merchant_Calendar_Month BETWEEN 1 AND 3 THEN 1 WHEN @Merchant_Calendar_Month BETWEEN 4 AND 6 THEN 2 WHEN @Merchant_Calendar_Month BETWEEN 7 AND 9 THEN 3 WHEN @Merchant_Calendar_Month BETWEEN 10 AND 12 THEN 4 END; |
Is merchant leap year:
|
1 2 3 4 5 6 |
CASE DATEDIFF(DAY, @Merchant_First_Date_of_Year, @Merchant_Last_Date_of_Year) WHEN 363 THEN 0 ELSE 1 END; |
The merchant leap year is a unique concept when compared to our standard leap years, but can be calculated very easily at this point by finding the number of days in the year, which will either be 363 or 370, and adjust accordingly.
Merchant first date of the month:
|
1 2 3 4 5 6 7 8 9 10 11 12 13 14 15 16 |
CASE WHEN @Merchant_Day_of_Year <= 28 THEN DATEADD(DAY, -1 * @Merchant_Day_of_Year + 1, @Date_Counter) -- Month 1 (Start) WHEN @Merchant_Day_of_Year BETWEEN 29 AND 63 THEN DATEADD(DAY, -1 * (@Merchant_Day_of_Year - 28) + 1, @Date_Counter) -- Month 2 (4 weeks) WHEN @Merchant_Day_of_Year BETWEEN 64 AND 91 THEN DATEADD(DAY, -1 * (@Merchant_Day_of_Year - 63) + 1, @Date_Counter) -- Month 3 (5 weeks) WHEN @Merchant_Day_of_Year BETWEEN 92 AND 119 THEN DATEADD(DAY, -1 * (@Merchant_Day_of_Year - 91) + 1, @Date_Counter) -- Month 4 (4 weeks) WHEN @Merchant_Day_of_Year BETWEEN 120 AND 154 THEN DATEADD(DAY, -1 * (@Merchant_Day_of_Year - 119) + 1, @Date_Counter) -- Month 5 (4 weeks) WHEN @Merchant_Day_of_Year BETWEEN 155 AND 182 THEN DATEADD(DAY, -1 * (@Merchant_Day_of_Year - 154) + 1, @Date_Counter) -- Month 6 (5 weeks) WHEN @Merchant_Day_of_Year BETWEEN 183 AND 210 THEN DATEADD(DAY, -1 * (@Merchant_Day_of_Year - 182) + 1, @Date_Counter) -- Month 7 (4 weeks) WHEN @Merchant_Day_of_Year BETWEEN 211 AND 245 THEN DATEADD(DAY, -1 * (@Merchant_Day_of_Year - 210) + 1, @Date_Counter) -- Month 8 (4 weeks) WHEN @Merchant_Day_of_Year BETWEEN 246 AND 273 THEN DATEADD(DAY, -1 * (@Merchant_Day_of_Year - 245) + 1, @Date_Counter) -- Month 9 (5 weeks) WHEN @Merchant_Day_of_Year BETWEEN 274 AND 301 THEN DATEADD(DAY, -1 * (@Merchant_Day_of_Year - 273) + 1, @Date_Counter) -- Month 10 (4 weeks) WHEN @Merchant_Day_of_Year BETWEEN 302 AND 336 THEN DATEADD(DAY, -1 * (@Merchant_Day_of_Year - 301) + 1, @Date_Counter) -- Month 11 (4 weeks) WHEN @Merchant_Day_of_Year >= 336 THEN DATEADD(DAY, -1 * (@Merchant_Day_of_Year - (CASE WHEN @Is_Merchant_Leap_Year = 0 THEN 336 ELSE 343 END)) + 1, @Date_Counter) -- Month 12 (5 weeks) through End of year (4 or 5 weeks, depending on 4-5-4 leap year status) END; |
Merchant last date of the month:
|
1 2 3 4 5 6 7 8 9 10 11 12 13 14 15 16 17 18 19 |
CASE WHEN @Merchant_Week_of_Year BETWEEN 1 AND 4 THEN DATEADD(DAY, 27, @Merchant_First_Date_of_Month) -- 4 weeks WHEN @Merchant_Week_of_Year BETWEEN 5 AND 9 THEN DATEADD(DAY, 34, @Merchant_First_Date_of_Month) -- 5 weeks WHEN @Merchant_Week_of_Year BETWEEN 10 AND 13 THEN DATEADD(DAY, 27, @Merchant_First_Date_of_Month) -- 4 weeks WHEN @Merchant_Week_of_Year BETWEEN 14 AND 17 THEN DATEADD(DAY, 27, @Merchant_First_Date_of_Month) -- 4 weeks WHEN @Merchant_Week_of_Year BETWEEN 18 AND 22 THEN DATEADD(DAY, 34, @Merchant_First_Date_of_Month) -- 5 weeks WHEN @Merchant_Week_of_Year BETWEEN 23 AND 26 THEN DATEADD(DAY, 27, @Merchant_First_Date_of_Month) -- 4 weeks WHEN @Merchant_Week_of_Year BETWEEN 27 AND 30 THEN DATEADD(DAY, 27, @Merchant_First_Date_of_Month) -- 4 weeks WHEN @Merchant_Week_of_Year BETWEEN 31 AND 35 THEN DATEADD(DAY, 34, @Merchant_First_Date_of_Month) -- 5 weeks WHEN @Merchant_Week_of_Year BETWEEN 36 AND 39 THEN DATEADD(DAY, 27, @Merchant_First_Date_of_Month) -- 4 weeks WHEN @Merchant_Week_of_Year BETWEEN 40 AND 43 THEN DATEADD(DAY, 27, @Merchant_First_Date_of_Month) -- 4 weeks WHEN @Merchant_Week_of_Year BETWEEN 44 AND 48 THEN DATEADD(DAY, 34, @Merchant_First_Date_of_Month) -- 5 weeks WHEN @Merchant_Week_of_Year BETWEEN 49 AND 53 THEN CASE -- 4 weeks (5 weeks during 4-5-4 leap years, in which case we add the final week, 53, into a 4-5-5 month) WHEN @Is_Merchant_Leap_Year = 0 THEN DATEADD(DAY, 27, @Merchant_First_Date_of_Month) WHEN @Is_Merchant_Leap_Year = 1 THEN DATEADD(DAY, 34, @Merchant_First_Date_of_Month) END END; |
Merchant first date of the quarter:
|
1 2 3 4 5 6 7 8 |
CASE WHEN @Merchant_Day_of_Year <= 91 THEN DATEADD(DAY, -1 * @Merchant_Day_of_Year + 1, @Date_Counter) -- Month 1 (Start) WHEN @Merchant_Day_of_Year BETWEEN 92 AND 182 THEN DATEADD(DAY, -1 * @Merchant_Day_of_Year + 92, @Date_Counter) -- Month 4 (4 weeks) WHEN @Merchant_Day_of_Year BETWEEN 183 AND 273 THEN DATEADD(DAY, -1 * @Merchant_Day_of_Year + 183, @Date_Counter) -- Month 7 (4 weeks) WHEN @Merchant_Day_of_Year >= 274 THEN DATEADD(DAY, -1 * @Merchant_Day_of_Year + 274, @Date_Counter) -- Month 10 (4 weeks) END; |
Merchant last date of the quarter:
|
1 2 3 4 5 6 7 8 9 10 11 |
CASE WHEN @Merchant_Calendar_Quarter = 1 THEN DATEADD(DAY, 90, @Merchant_First_Date_of_Quarter) WHEN @Merchant_Calendar_Quarter = 2 THEN DATEADD(DAY, 90, @Merchant_First_Date_of_Quarter) WHEN @Merchant_Calendar_Quarter = 3 THEN DATEADD(DAY, 90, @Merchant_First_Date_of_Quarter) WHEN @Merchant_Calendar_Quarter = 4 THEN CASE WHEN @Is_Merchant_Leap_Year = 0 THEN DATEADD(DAY, 90, @Merchant_First_Date_of_Quarter) ELSE DATEADD(DAY, 97, @Merchant_First_Date_of_Quarter) END END; |
Merchant first date of the week:
|
1 2 3 |
DATEADD(DAY, -1 * ((DATEDIFF(DAY, @Merchant_First_Date_of_Month, @Date_Counter) % 7) + 1) + 1, @Date_Counter); |
Merchant last date of the week:
|
1 2 3 |
DATEADD(DAY, 6, @Merchant_First_Date_of_Week); |
There are many other ways we can calculate these metrics. The queries presented are one way to do it, though in no way are superior or better than any others you might think up. In addition, you can determine any date part or date-related metric and add it to this data set with minimal effort.
The ISO Calendar
Another attempt to normalize calendars and allow for easier reporting (especially internationally) is the ISO calendar. In this calendar, all weeks and years begin on Monday. A year will have 52 weeks a majority of the time, and 53 weeks when a leap year is required in order to keep the calendar in sync with the time of year.
The first day of the ISO year always begins on the Monday of the week that contains January 4th, regardless of whether that date is part of the current Gregorian year or the previous one. This automatically controls leap years based on when this first week falls. The following is an illustration of the ISO calendar structure for 2016-2017:
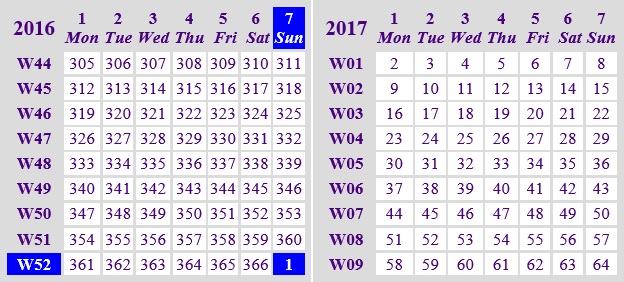
The horizontal axis shows the weekdays of the ISO calendar and the vertical axis shows the weeks. Since the calendar is uniform across days, weeks, and months, it can be structured as a grid. Note that the ISO calendar does not contain months—a date is comprised solely of a year, week, and day, without any further groupings. As a result, one way to write an ISO date is using the following notation: “2017-W5-3”. This indicates that it is ISO year 2017, week 5, day 3. Because of the uniformity, it is very easy to compare year-on-year metrics without the need for any significant adjustments.
The leap year may be accounted for in similar ways to the merchant calendar in that we may include it for completeness or remove a week to normalize to 52 weeks. There are no official standards for this adjustment, and this calendar is often presented as a method of achieving completeness and uniformity rather than directly conforming to specific business needs.
We can calculate a handful of example metrics using the ISO calendar, as follows:
ISO Week of Year:
|
1 2 3 |
SELECT @ISO_Week_of_Year = DATEPART(ISO_WEEK, @Date_Counter); |
We get the easy way out on this one and can use a SQL Server built-in function to determine the ISO week of year, which will save us some time and TSQL complexity later on!
ISO First Date of the Week:
|
1 2 3 4 5 6 7 |
CASE DATEPART(WEEKDAY, @Date_Counter) = 2 THEN @Date_Counter WHEN DATEPART(WEEKDAY, @Date_Counter) = 1 THEN DATEADD(DAY, -6, @Date_Counter) ELSE DATEADD(DAY, -1 * (DATEPART(WEEKDAY, @Date_Counter) - 2), @Date_Counter) END; |
ISO Last Date of the Week:
|
1 2 3 |
DATEADD(DAY, 6, @ISO_First_Date_of_Week); |
ISO Day of Week:
|
1 2 3 4 5 6 |
CASE WHEN DATEPART(WEEKDAY, @Date_Counter) = 1 THEN 7 ELSE DATEPART(WEEKDAY, @Date_Counter) -1 END |
ISO Day of Year:
|
1 2 3 |
(@ISO_Week_of_Year - 1) * 7 + @ISO_Day_of_Week; |
ISO Year:
|
1 2 3 4 5 6 7 |
CASE WHEN @Week_of_Year > 49 AND @ISO_Week_of_Year < 3 THEN @Calendar_Year + 1 WHEN @Week_of_Year < 3 AND @ISO_Week_of_Year > 49 THEN @Calendar_Year - 1 ELSE @Calendar_Year END; |
Note that the ISO year and Gregorian year may not match up. If the ISO year begins on December 28th, the year will be notated as the following year on the Gregorian calendar. For example, if the standard year ends on Tuesday, December 31, 2019, and the ISO year begins on Monday, December 30th, then the ISO year would be 2020, and not 2019.
ISO String:
|
1 2 3 |
CAST(@ISO_Year AS VARCHAR(6)) + '-W' + CAST(@ISO_Week_of_Year AS VARCHAR(2)) + '-' + CAST(@ISO_Day_of_Week AS VARCHAR(1)); |
The ISO string is the standard way to display an ISO week, accounting for the ISO year, week, and day. There are many ways to refer to an ISO date, but this captures the three components necessary to allow us to quickly and easily understand the time of year and its meaning. While the day of year could also be used to determine both week and day of week, doing so would be challenging for a human that is not lightning fast (and accurate) with mental arithmetic.
In summary, the ISO calendar is a another way to normalize dates so that calendar structures are greatly simplified. By eliminating the need for months, and by ensuring that weeks and years start on the same day (Monday) and have consistent numbers of days (364 or 371), many calculations that are normally complex become trivial within this framework.
Fiscal Calendars
Fiscal calendars can begin on January 1st and end on December 31st, but many businesses and agencies choose to shift the year-end to another time of year. For example, colleges often end their fiscal calendars over the summer, in conjunction with a quieter and more consistent time of year for their bookkeeping. The US government ends their fiscal year on September 30th. Retail organizations may choose to start their fiscal year in February in order to be sufficiently done with all of the previous end-of-year’s business.
For the purpose of this demo, we’ll use a fiscal year that begins on October 1st and ends on September 30th. Many of our metrics do not change with a shift such as this. The only metrics that will need to be adjusted are those related to the quarter and year, while weeks and months will not change. Here are a few examples of what we’d expect to see when shifting a calendar to account for a different fiscal year:
Fiscal First Date of the Year:
|
1 2 3 4 5 6 |
CASE WHEN @Calendar_Month IN (10, 11, 12) THEN DATEADD(DAY, -1 * @Day_of_Quarter + 1, @Date_Counter) ELSE DATEADD(DAY, -1 * @Day_of_Year - 91, @Date_Counter) END |
Fiscal Last Date of the Year:
|
1 2 3 |
DATEADD(DAY, -1, DATEADD(YEAR, 1, @Fiscal_First_Date_of_Year)); |
Fiscal Day of the Year:
|
1 2 3 |
DATEDIFF(DAY, @Fiscal_First_Date_of_Year, @Date_Counter) + 1; |
Fiscal Week of the Year:
|
1 2 3 |
(@Fiscal_Day_of_Year + DATEPART(WEEKDAY, @Fiscal_First_Date_of_Year) - DATEPART(WEEKDAY, @Date_Counter)) / 7 + 1; |
Fiscal Quarter:
|
1 2 3 4 5 6 |
CASE WHEN @Calendar_Quarter = 4 THEN 1 ELSE @Calendar_Quarter + 1 END; |
Fiscal Month:
|
1 2 3 4 5 6 |
CASE WHEN @Calendar_Month BETWEEN 10 AND 12 THEN @Calendar_Month - 9 ELSE @Calendar_Month + 3 END; |
The calculations here base our results on the difference between the start and end of the fiscal year, or on the difference between the standard calendar and the fiscal calendar. Any of these formulas could be shifted to account for fiscal calendars that begin or end on any other time of the year.
Fiscal calendars have immense use within accounting and business analytics. Being able to adjust a calendar to fit perfectly around an organization’s needs allows us to improve all reporting on their data. Calculating fiscal metrics is generally simple and many date attributes can be shared across calendars as a shifting of quarters does not change days of the week or any specific date subcomponents.
Implementation
In practice, we will create a calendar table and then add on columns for any additional calendars we would like to use. As a result, we’ll be able to compare metrics between each directly. In our demo below, we will build a calendar table and add merchant, ISO, and fiscal metrics to the same table. I did not include every common calculation as it’d be overkill, but using what is here, determining additional data elements should be pretty easy!
Please download Calendar table script that will build a calendar table, create a stored procedure that populates it, and execute it for a 6 year range, and then select the results out of that table.
After executing the script above, we can view the results:
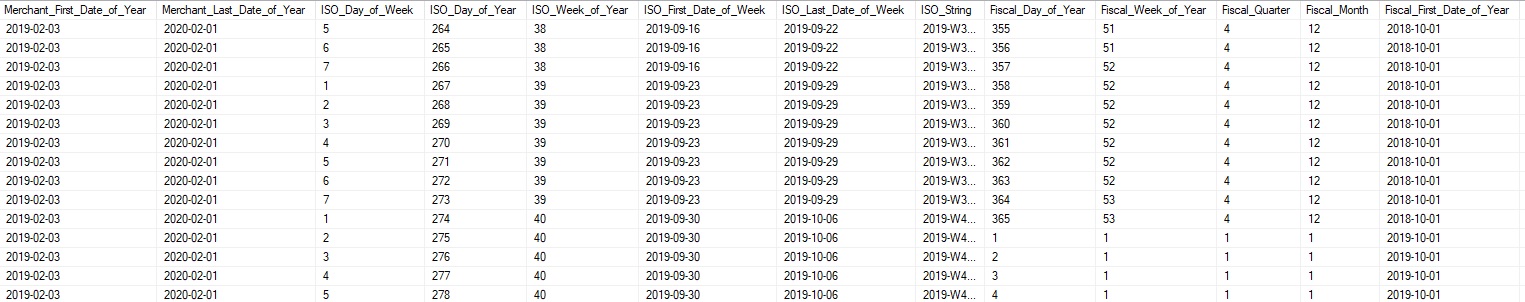
There are far too many columns to easily display here, but we now have a calendar table that contains a variety of standard date components, as well as additional ones that pertain to the merchant, ISO, and fiscal calendars.
Having this data side-by-side allows us to report off of multiple calendars using the same dimension table. We can then compare and not only see how data changes across calendars, but this analysis can let us understand which would be the best calendar to use for a given business, and from there fine-tune our metrics to return the most useful data.
Benefits & Drawbacks
No calendar is perfect. Those that are more uniform tend to be far more at odds with our day-to-day processes. For example, the ISO calendar is very easy to understand, but does not correlate well with how we manage calendars outside of the reporting world. Less uniform calendars, such as those based solely on lunar or solar cycles, will offer inconsistent and potentially difficult data challenges, as we try to report month-on-month, quarter-on-quarter, or year-on-year.
A specific business should choose the correct calendars for use in different applications. If one size fits all, then that greatly simplifies communication and reporting across an entire organization. If not, then it will need to be decided for which applications a given calendar is used, and ensure that no confusion arises as a result.
Customization
Building a calendar table and adding new calendars is a process that is highly customizable. In addition to choosing the calendars to use, we have complete control over which data elements to include. Some businesses create their own unique calendar that accommodates their specific needs when no other adequate one exists. For example, some businesses will avoid the leap year problem by cutting out or adding days year-on-year, thus removing data points, but keeping the calendar uniform regardless of the year.
The examples presented here are only a fraction of the possible metrics that can be calculated. A year can be defined and subdivided in many different ways, each of which could spawn a wide variety of attributes that we could track.
In previous articles, we have delved into a variety of date parts, as well as holidays and seasons. These can be integrated into any calendar and used in order to track data change over specific time periods, days, or groups of days.
Calendar tables are made for this variability. Add anything that is missing and remove anything that seems unnecessary. Dimension tables such as this can be modified easily as the data volume is low and the cost to repopulate it is small. Even if you compute 50 years of data, the row count for all of that would fall around 18,262. As a result, your table could afford to be wide if all of the columns were needed. Keeping data types compact by using DATE, TINYINT, BIT, or SMALLINT greatly improves performance and reduces storage size.
Conclusion
Our ability to customize and use calendar data does not stop with our standard Gregorian calendar. When our calendar fails us, we can look towards others in order to fill our business, reporting, and analysis needs.
Merchant, ISO, and fiscal calendars are all options that can be utilized in order to increase the flexibility of your data and make it more relevant to your business needs. Once utilized, any number of metrics can be calculated within each calendar, referencing date parts, time of year, or relative time of year. Feel free to customize and make the solution fit your needs, removing unneeded columns and adding any that could be useful. As with any flexible solution, your imagination is the limit and if you can conceive of a metric that could be of value, then it can be architected, implemented, and applied to any analysis that benefits from a calendar table!
Previous articles in this series:
Downloads
See more
Consider these free tools for SQL Server that improve database developer productivity.
References and Further Reading
- Merchant/4-5-4 calendar details, from the National Retail Federation
- List of DATEPART options, including ISO_WEEK
- A relatively in-depth Wikipedia entry on fiscal calendars
- A very colorful PDF of the official 2017 ISO calendar


In his free time, Ed enjoys video games, sci-fi & fantasy, traveling, and being as big of a geek as his friends will tolerate.
View all posts by Ed Pollack
- SQL Server Database Metrics - October 2, 2019
- Using SQL Server Database Metrics to Predict Application Problems - September 27, 2019
- SQL Injection: Detection and prevention - August 30, 2019