
In this article, we will run through the new options added in the Query Store with SSMS v18.4.
SQL Server Management Studio aka SSMS, is one of the popular SQL Server client tools for managing SQL Server and its databases. This enables database developers and administrators to configure, administer and manage SQL Server, Azure SQL Database and SQL Data Warehouse. The best part is, it is cost-free.
Download SSMS v18.4
Continuing its tradition to make SSMS more productive and flexible, Microsoft has released the new version of SSMS – v18.4 which is generally available. You can download it from here. The installation process is pretty straightforward. Also, I am sure most of you may already know, but it is still worth to mention for beginners that, in June 2015, Microsoft announced that future versions of SSMS would be independent of SQL Server database engine releases.
Query Store
As a database developer, I have often run into issues where my system would slow down and I had no clear idea of what queries are waiting for the most. Starting SQL Server 2016, Microsoft introduced Query Store, which is one of the significant additions to the performance tuning tools and it helps immensely in monitoring and troubleshooting database performance.
With this tool, you can capture execution plans, force a better plan and also track a range of information about query usage, CPU, memory consumption, etc. Unlike Plan Cache that stores execution plans in-memory, Query Store captures data on disk and retains all the captured information even after SQL Start restarts.
If you are new to Query Store, I would recommend understanding this feature before reading this article, it is described in great detail here, SQL Server Query Store – Overview.
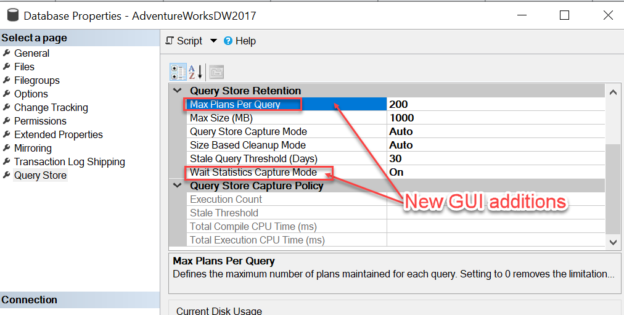
SSMS v18.4 added a couple of GUI options in the Query Store page, making it easier and faster for Database Administrators (DBAs) to set capture policies and make changes without any piece of code. These options can be configured using T-SQL for SSMS v18.3 and lower, with this enhancement, we can configure it with a few clicks on the Query Store tab.
This enables you to modify and customize the below features in the Query Store Database Properties page itself using SSMS 18.4.
- Added Max Plans per query value (MAX_PLANS_PER_QUERY)
- Added Wait Statistics Capture Mode value (WAIT_STATS_CAPTURE_MODE)
- Added Custom policies (STALE_CAPTURE_POLICY_THRESHOLD, EXECUTION_COUNT, TOTAL_COMPILE_CPU_TIME_MS, TOTAL_EXECUTION_CPU_TIME_MS) to the Capture mode
Before we go ahead and see these new GUI options with SSMS 18.4 release, let’s quickly get our environment ready.
Pre-requisites and preparing the environment
For this article, we need SQL Server Management Studio, (version 18.4), and access to a SQL Server instance, I am using SQL Server 2019 here. You can make use of any database in it. I have restored AdventureWorksDW2017 sample DB, so I will use it.
Enable Query Store for our database
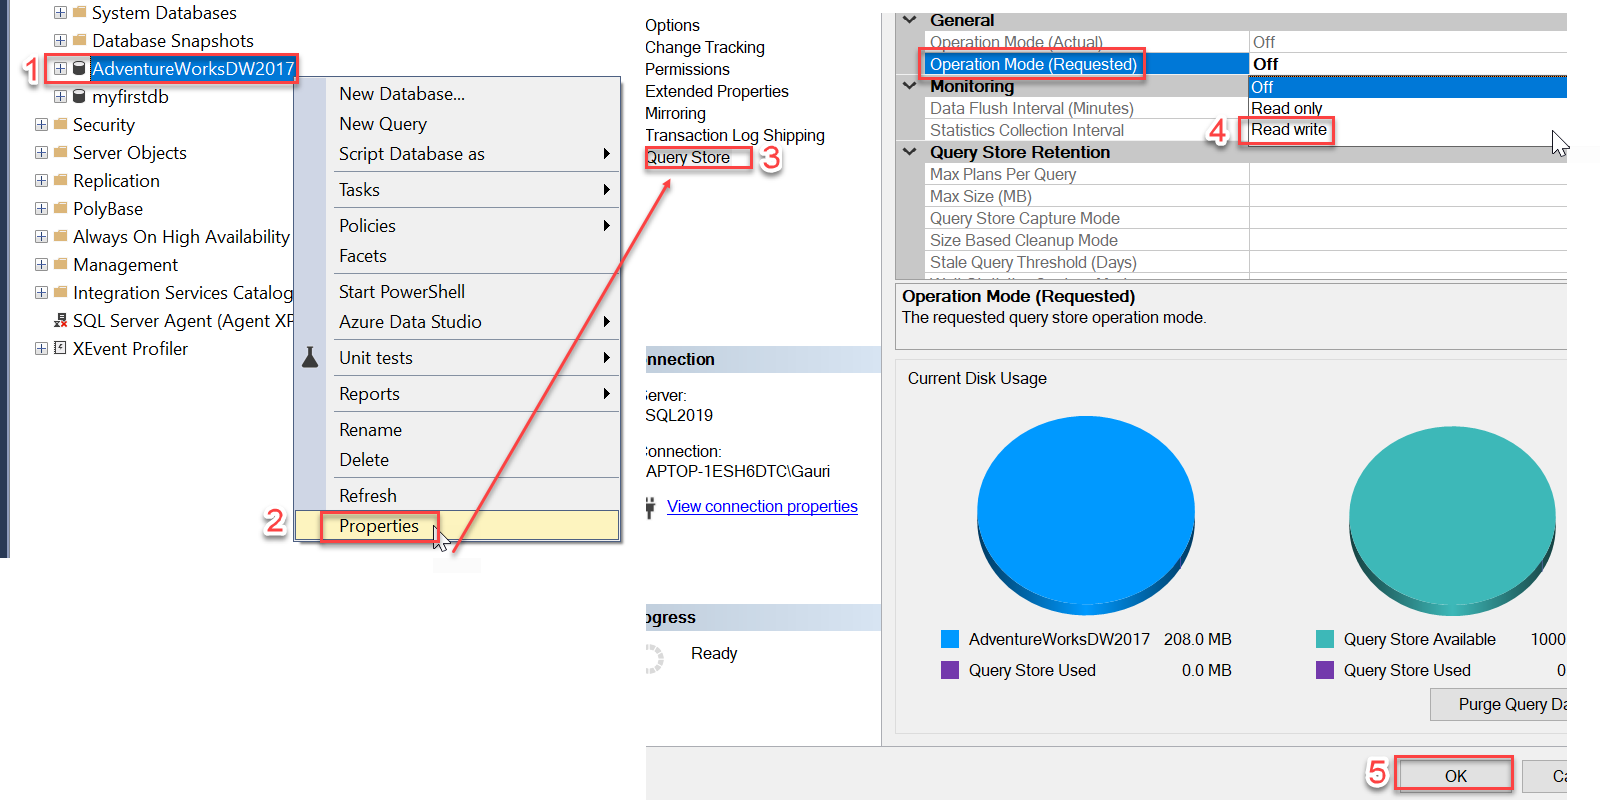
Query Store can be configured on an individual database and is not generally enabled for new databases by default. Let’s quickly enable it, right-click the database >> click on Properties >> select Query Store on Database Properties page >> choose Read write in the Operation Mode (Requested) drop-down >> Hit OK.
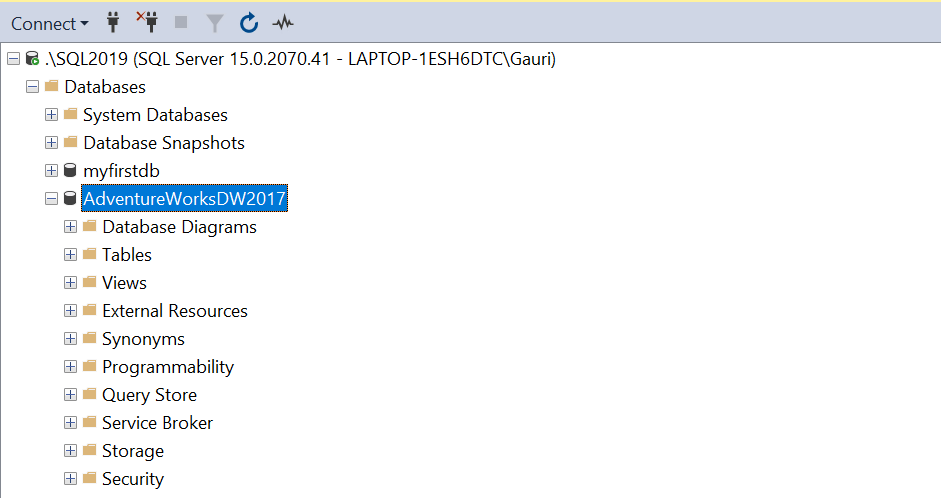
The Query Store feature is enabled for the database, AdventureWorksDW2017 as shown below.
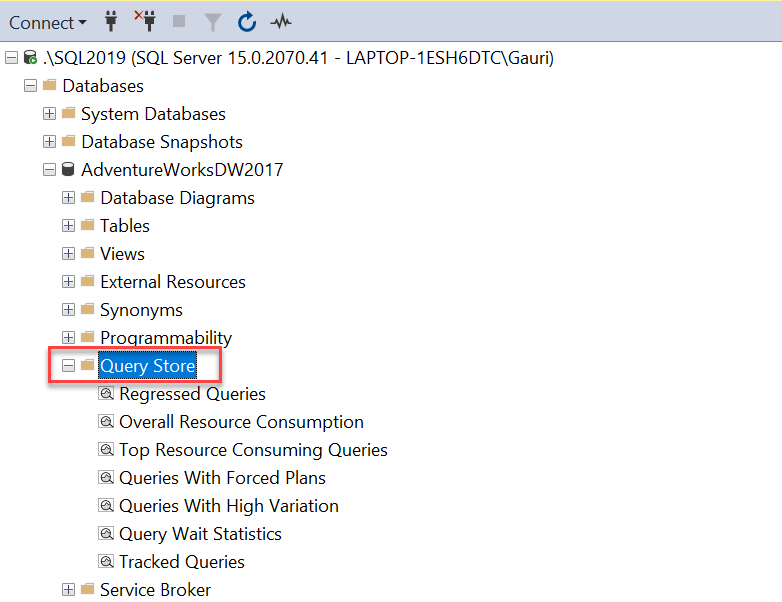
Now that the Query Store feature is enabled. Let’s move forward and look at the new GUI options added.
Setting Max Plans Per Query and Wait Statistics Capture Mode
Max Plans Per Query property represents the maximum number of execution plans that will be stored per query by the Query Store. The default value of max plans per query is set as 200 execution plans per query. Of course, you can increase or decrease this number based on the complexity and stability of your queries. In case of a large number of different plans being generated, keep a check on the count as it takes up disk space.
Wait Statistics Capture Mode option helps you control if the Query Store will capture wait statistics information. By default, this property is set as ON. With this option being enabled, you can collect wait stats data to troubleshoot performance and figure out which query is taking long and waiting.
Set or modify values in the “Max Plans Per Query” and “Wait Statistics Capture Mode” options in the Query Store tab as shown in the below snapshot.

Apart from configuring these options through GUI, you can enable/modify these options using T-SQL in SSMS 18.3 and below as shown below.
|
1 2 3 4 5 |
ALTER DATABASE AdventureWorksDW2017 SET QUERY_STORE ( OPERATION_MODE = READ_WRITE, MAX_PLANS_PER_QUERY = 300, WAIT_STATS_CAPTURE_MODE = OFF) |
Query Store Capture Mode
Query Store Capture Mode lets you specify several query capture policy settings for the database you are running your queries against. We can control whether we want to capture all queries, or track only current queries or specific queries depending upon execution count and CPU consumption.
These options come in different flavors as All, Auto, None and Custom.
- ALL – The default value is ALL in SQL Server 2016 and SQL Server 2017, which means all queries executed against the database will be captured in the Query Store
- Auto – Starting SQL Server 2019, this is the default option that rules out infrequent queries with insignificant compile and execution duration
- None – Query Store stops capturing new queries, no execution plans and statistics are recorded
- Custom – This is a substantial option in providing additional control for user-defined capture policies
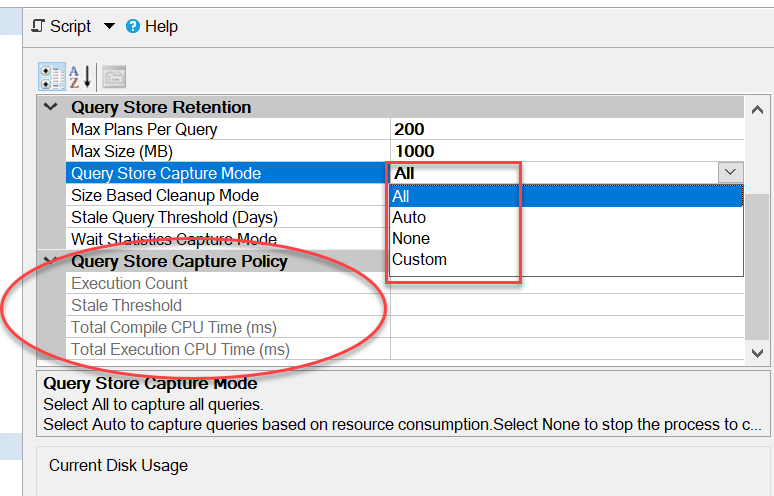
On selecting Custom in the UI drop-down above, the section Query Store Capture Policy gets editable and you can customize these values.
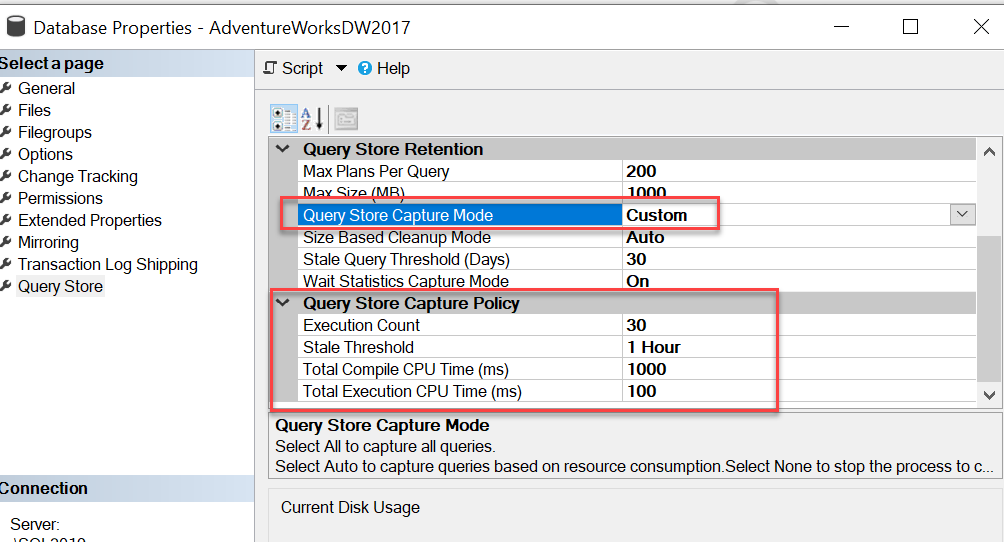
Query Store Capture Policy
You will notice a few things in the screenshot above.
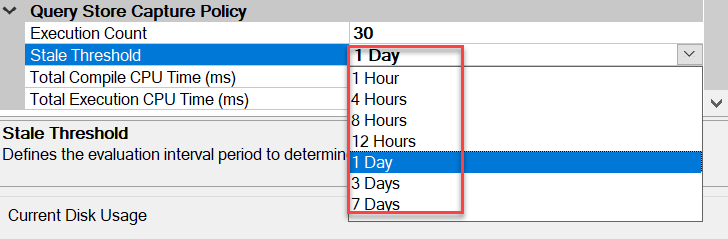
Execution Count (it defines the number of times, a query will be executed and its default value is 30), Stale Threshold (it accepts a range of values from 1 hour to 7 days), Total Compile CPU Time (ms) (the default value is 1000ms) and Total Execution CPU Time (ms) (it has a default value of 100ms). CPU compilation and CPU execution times help to measure processor performance and must be set carefully.
Talking about Stale Threshold, you can select its value from the drop-down list, with the default value as 1 day (24 Hours).
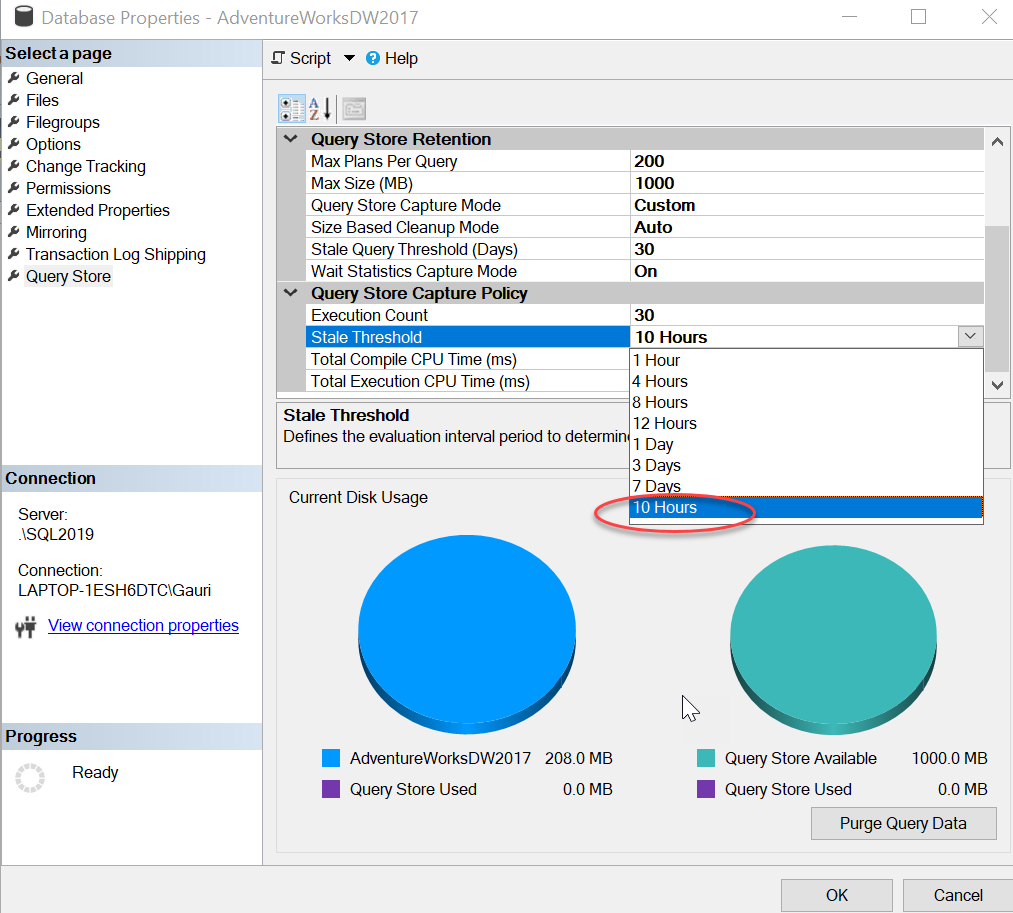
You can also set a Stale Threshold value that is not available in the drop-down list using T-SQL. The following example sets a Stale Threshold as 10 Hours.
|
1 2 3 4 5 6 7 8 9 10 11 12 |
ALTER DATABASE AdventureWorksDW2017 SET QUERY_STORE ( OPERATION_MODE = READ_WRITE, MAX_PLANS_PER_QUERY = 200, WAIT_STATS_CAPTURE_MODE = ON, QUERY_CAPTURE_MODE = CUSTOM, QUERY_CAPTURE_POLICY = ( EXECUTION_COUNT = 30, STALE_CAPTURE_POLICY_THRESHOLD = 10 HOURS, TOTAL_COMPILE_CPU_TIME_MS = 1000, TOTAL_EXECUTION_CPU_TIME_MS = 100 )) |
And the great part is, once the above code is executed, the value “10 Hours” is added in the drop-down list.
Conclusion
SQL Server Query Store using SSMS 18.4 together with SQL Server 2019 is a great tool to troubleshoot query performance and we covered several options added in the GUI in this article.

She has a deep experience in designing data and analytics solutions and ensuring its stability, reliability, and performance. She is also certified in SQL Server and have passed certifications like 70-463: Implementing Data Warehouses with Microsoft SQL Server.
View all posts by Gauri Mahajan
- Oracle Substring function overview with examples - June 19, 2024
- Introduction to the SQL Standard Deviation function - April 21, 2023
- A quick overview of MySQL foreign key with examples - February 7, 2023