
There is a range of other memory metrics that are not as indicative, and therefore are not commonly used. In this article, we’ll present some of them
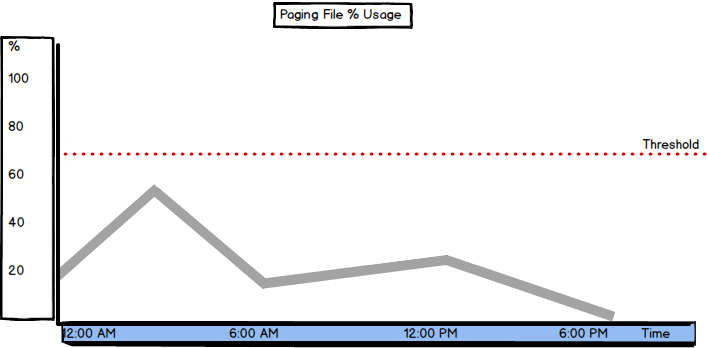
Paging File % Usage
Paging File % Usage indicates the amount of the paging file used by the operating system
Paging is a process that occurs on systems with insufficient. To provide enough memory for the running processes, it temporarily stores some of the memory pages into the paging file on disk. Next time a process needs this page, it will not be read from RAM, but from the page file on disk
When there’s no memory pressure on the system, every process has enough memory, pages are written into memory and flushed after the process is completed, freeing up the page for the forthcoming process
A hard page fault is when the page is not in memory, but has to be loaded from a paging file on disk. This affects performance, as writing and reading a page from disk is several times slower than writing and reading from memory
A soft page fault is when a page is still in memory, but on another address, or is being used by another program. Soft page faults don’t affect performance
A useful information related to the paging file usage is the size of the operating system paging file and how much paging file space is available. You can obtain this information from the dm_os_sys_memory view
|
1 2 3 4 5 |
SELECT total_page_file_kb, available_page_file_kb, system_memory_state_desc FROM sys.dm_os_sys_memory |
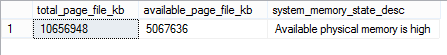
Frequent paging and using a large percentage of the paging file requires reducing system workload or adding more memory
The threshold you should not reach depends on the size of the paging file, but shouldn’t be more than 70%. As a rule of thumb, you can set the paging file to be 50% of total RAM
“100 percent usage of a page file does not indicate a performance problem as long as the system commit limit is not reached by the system commit charge, and if a significant amount of memory is not waiting to be written to a page file.”[1]
Connection Memory (KB)
The Connection Memory (KB) metric “specifies the total amount of dynamic memory the server is using for maintaining connections” [2]
This is the amount of memory used for storing connection context as well as network send and receive buffers
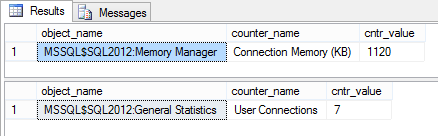
As this is one of the Memory Manager counters, you can obtain its value using a query such as
|
1 2 3 4 5 |
SELECT object_name, counter_name, cntr_value FROM sys.dm_os_performance_counters WHERE [counter_name] = 'Connection Memory (KB)' |
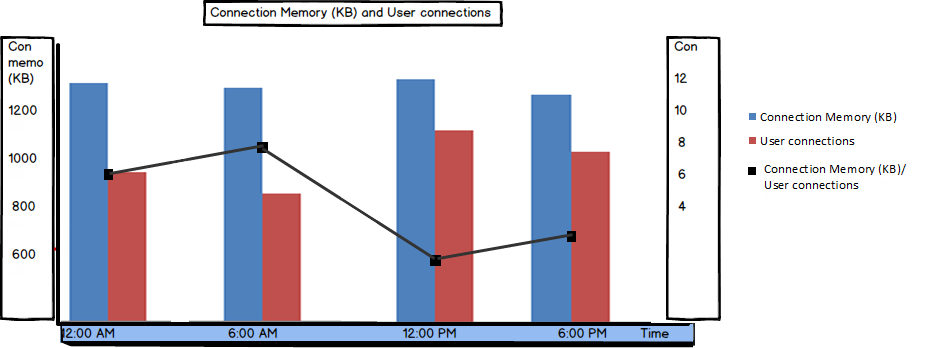
This is where another metric comes in useful – User connections which shows the number of users currently connected to SQL Server
|
1 2 3 4 5 |
SELECT object_name, counter_name, cntr_value FROM sys.dm_os_performance_counters WHERE [counter_name] = 'User Connections' |
If the number of user connections is much higher than expected, the memory used per connection varies significantly, or these values are constantly increasing, the situation should be investigated and excessive connections killed. Besides being a performance issue, this can be an indication of a security problem
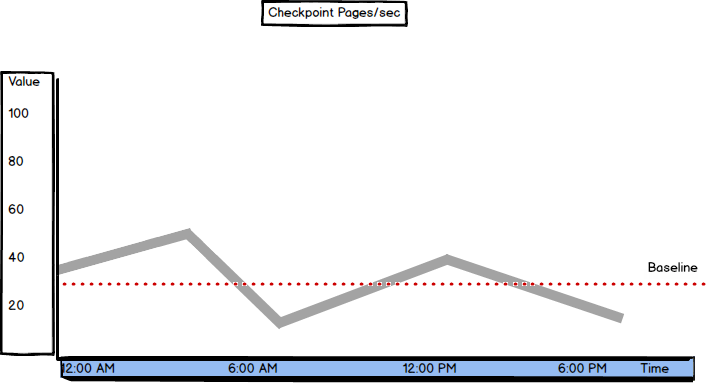
Checkpoint Pages/sec
Checkpoint Pages/sec shows the number of pages that are moved from buffer to disk per second during a checkpoint process
SQL Server tries to provide enough available space in the buffer in order to provide good performance. To free up the space in the buffer, the modified (dirty) pages are periodically moved (flushed) from the buffer to disk, and the page in the buffer is set for overwriting. This process occurs at checkpoints
This number of pages moved at a checkpoint is relative and depends on the hardware configuration and server usage. It’s recommended to create a baseline for this metric and compare the current values to it
If more pages are flushed at each checkpoint, it might indicate an I/O problem. This is where besides automatic checkpoints, indirect checkpoints should be used, as they can be issued automatically to reduce the time between 2 automatic checkpoints and reduce the number of flushed dirty pages per second
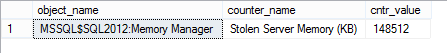
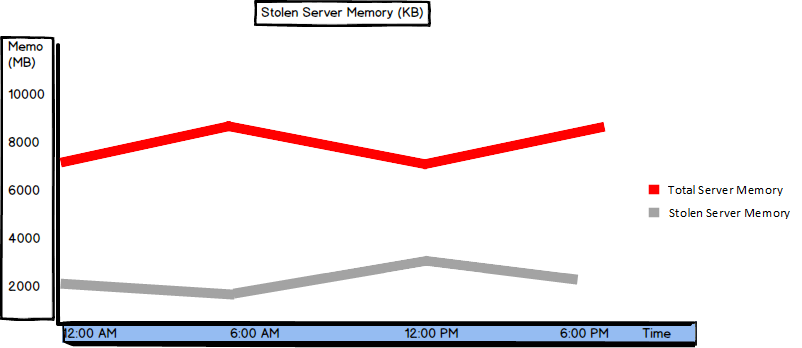
Stolen Server Memory (KB)
Stolen Server Memory (KB) shows the amount of memory used by SQL Server, but not for database pages. It is used for sorting or hashing operations, or “as a generic memory store for allocations to store internal data structures such as locks, transaction context, and connection information” [3]
The Stolen Server Memory (KB) counter was introduced in SQL Server 2012. In earlier versions, there was the Stolen pages counter
|
1 2 3 4 5 |
SELECT object_name, counter_name, cntr_value FROM sys.dm_os_performance_counters WHERE [counter_name] = 'Stolen Server Memory (KB)' |
There’s no specific threshold value, so it’s recommended to monitor this counter for a while and set a baseline. Note that the value should be close to the Batch Requests/sec value and low compared to the Total Server Memory counter. A high amount of stolen memory indicates memory pressure
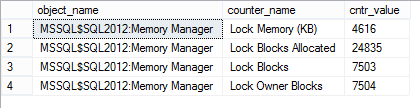
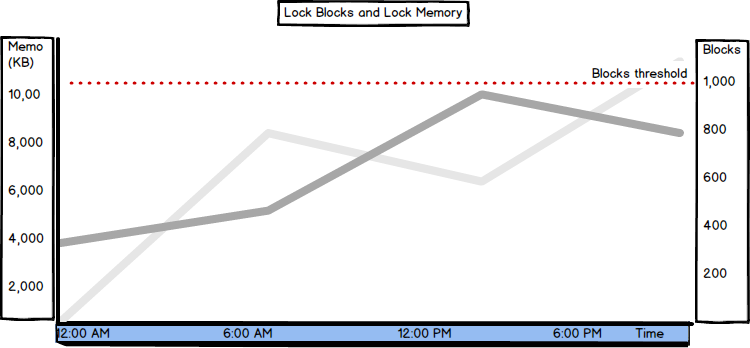
Lock Blocks, Lock Blocks Allocated, Lock Memory (KB), and Lock Owner Blocks
A lock block is a locked source, such as a table, page, or row
Locking is a normal process on SQL Server. When a process uses a resource (e.g. page), the resource is locked. If another process tries to use the same resource, it will have to wait until the resource is released, which affects performance
Locks occur when a process holds a resource longer than it should before releasing it, e.g. due to inefficient queries, or an error occurs so that the resource is not released automatically
Lock Blocks shows the number of lock blocks in use on the server (refreshed periodically). A lock block represents an individual locked resource, such as a table, page, or row
Lock Blocks Allocated shows the number of lock blocks allocated to support locks. The more locks occur, the more will be allocated
Lock Memory (KB) shows the total amount of memory the server is using for locks
Lock Owner Blocks shows the number of lock owner blocks currently in use on the server. A lock owner block is a thread that is the owner of a lock
|
1 2 3 4 5 |
SELECT object_name, counter_name, cntr_value FROM sys.dm_os_performance_counters WHERE [counter_name] in ('Lock Blocks', 'Lock Blocks Allocated', 'Lock Memory (KB)', 'Lock Owner Blocks') |
When SQL Server is set to use dynamic lock allocation, 2500 lock blocks and 5000 lock owner blocks will be initially allocated per node
The number of Lock Blocks should be lower than less than 1,000. If the value is higher, query tuning and optimization are the first steps to solve this issue
The Lock Memory (KB) value should be lower than 24% of the available memory
Besides these, the following metrics can help with SQL Server memory performance indication, but are of no great significance: Free Memory (KB), Optimizer Memory (KB), Reserved Server Memory (KB), SQL Cache Memory (KB), Page lookups/sec, and Readahead pages/sec [1]

She has been working with SQL Server since 2005 and has experience with SQL 2000 through SQL 2014.
Her favorite SQL Server topics are SQL Server disaster recovery, auditing, and performance monitoring.
View all posts by Milena "Millie" Petrovic
- Using custom reports to improve performance reporting in SQL Server 2014 – running and modifying the reports - September 12, 2014
- Using custom reports to improve performance reporting in SQL Server 2014 – the basics - September 8, 2014
- Performance Dashboard Reports in SQL Server 2014 - July 29, 2014