
In this article, I am going to introduce a few concepts of how to set up and get started with R and RStudio to perform machine learning workloads. It has always been the heat of the discussion on whether to choose Python or R for performing Machine Learning analysis. In my opinion, both the languages excel in their own space and there is no point-to-point comparison between the two directly. Mathematicians and statisticians like to work within the R environment, while programmers choose to work with Python.
A brief history of the R Language
R was initially introduced by two professors Robert Gentleman and Ross Ihaka in the early 1990s as a statistical language. It was introduced as an improvised version of the then existing language “S”. R is open source and can be freely used and distributed. R language is mostly used by mathematicians and statisticians across the globe to develop scientific models for data analysis and machine learning.
Download R on your machine
You can download R on your machine. It is available for Windows, Linux and MacOS. You can navigate to the official website and get R downloaded as per your system requirements.
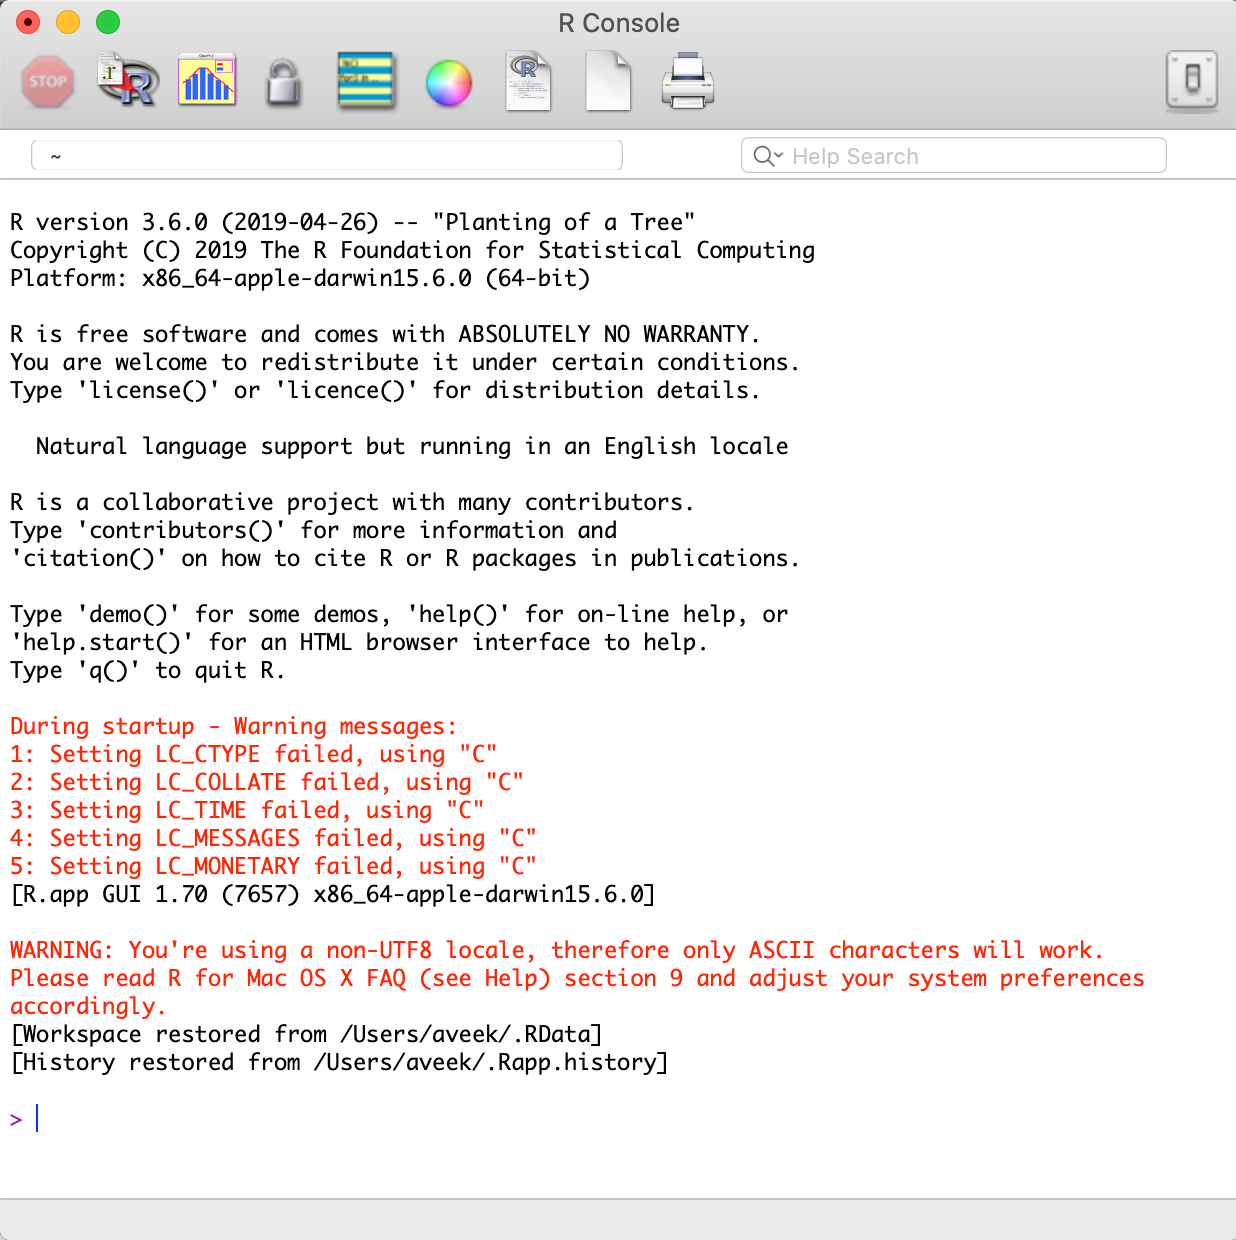
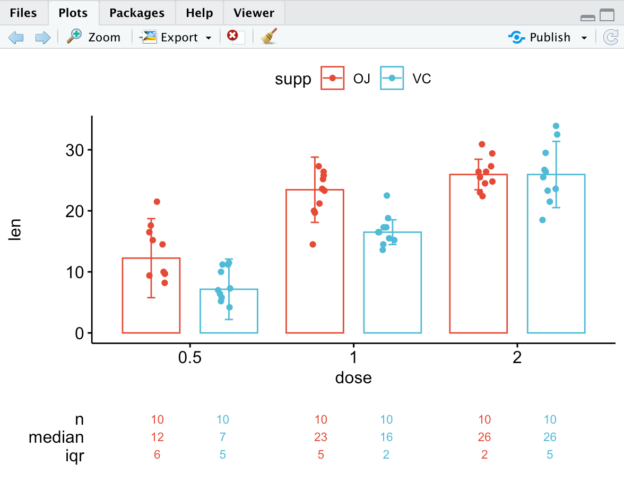
Figure 1 – R Console Window on MacOS
Once you download R into your machine, you can open up the R console as shown in the figure above and start writing your programs. An easy way to determine if R was successfully installed is by checking the version that is installed. You can simply run the command R.Version() on the console and see the output.
Although you can write your R programs directly on the console, it is always advised to use an Integrated Development Environment that will provide more functionalities while dealing with the language. RStudio is an IDE specially designed for R language users. In the next section, let us see how to install RStudio and the various components of it.
Installing RStudio
As already mentioned in the previous section, RStudio is an IDE that is used by most R programmers in order to enhance the base features of the R console. RStudio is available to be downloaded for Windows, Linux, and macOS. Most commonly, is it advised to download the R Studio Desktop version which is available for free to download from the official website. Once downloaded, it will open up as the figure below.
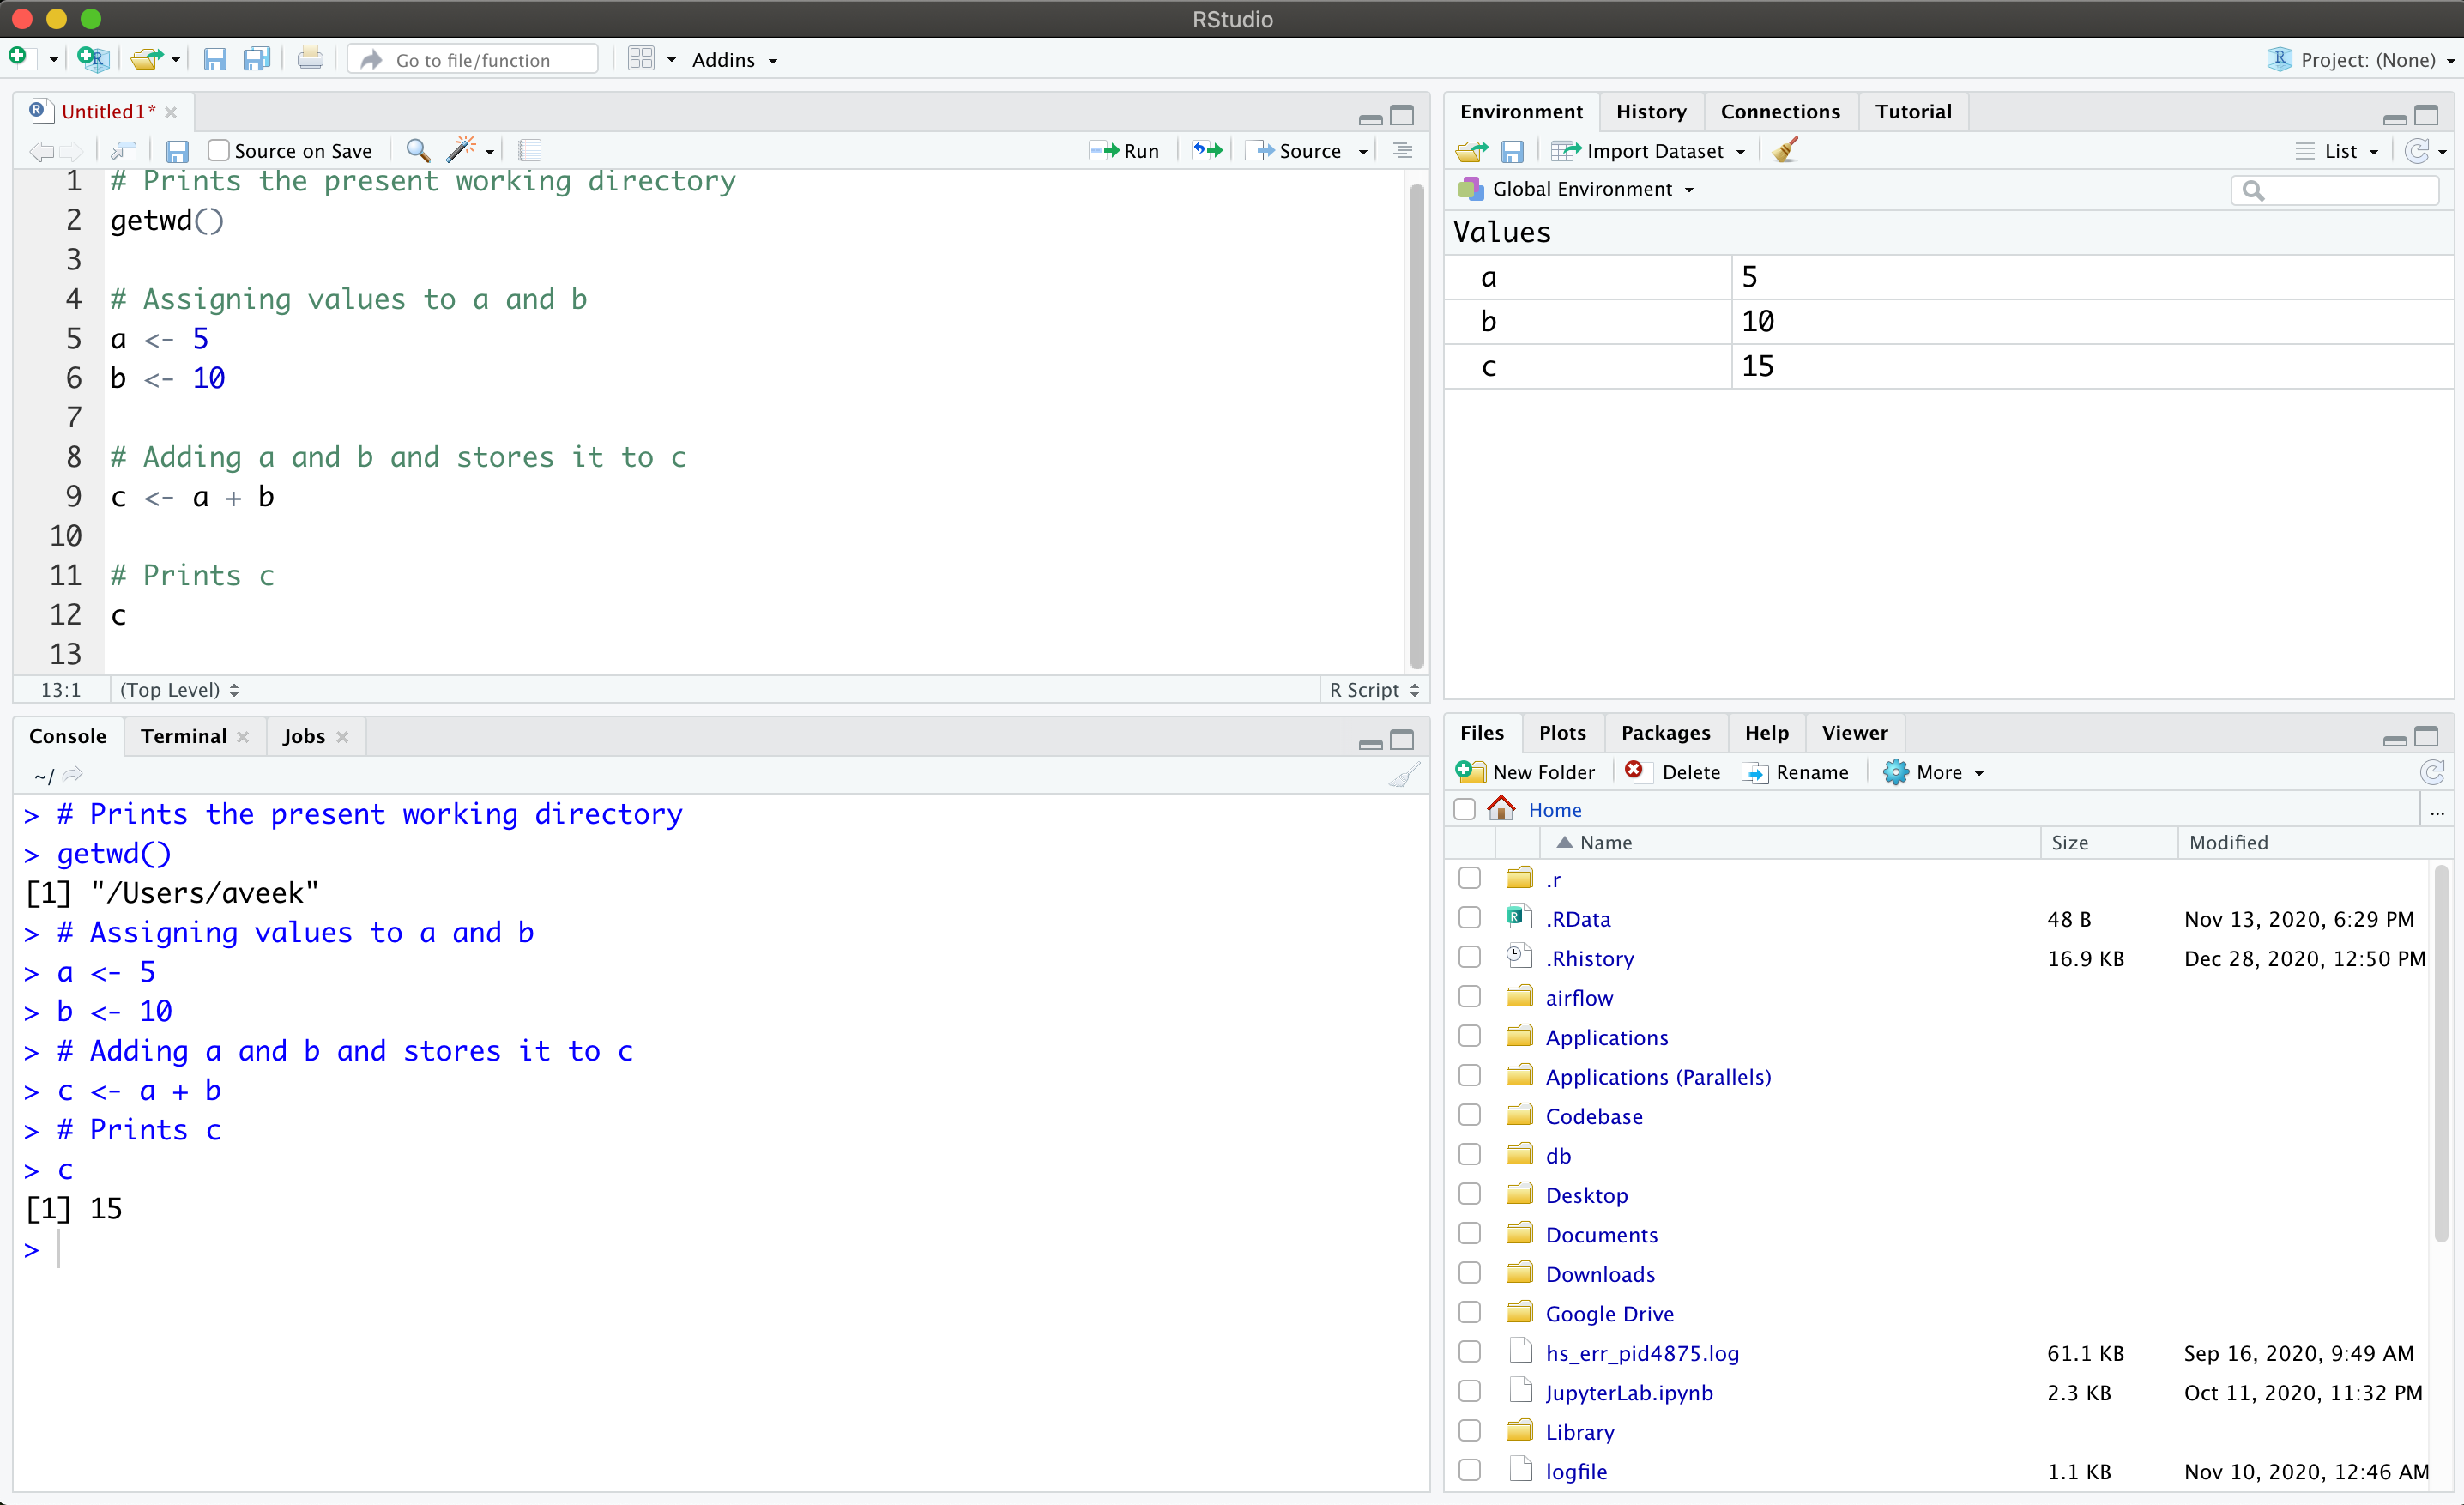
Figure 2 – R Studio Integrated Development Environment for R
As you can see in the figure above, there are four panes in which the entire IDE can be organized. Let us understand in detail the significance of each of these panes.
- Script Pane – Starting from the top left, it the script pane where you can write all your R code and save it as a .R file. From this script, you can execute each line of your code line by line by pressing Command + Enter on a Mac or Control + Enter on Windows
- Console / Terminal Pane – This appears just below the Script pane in the IDE. In this pane, you can keep a track of all the code that is being executed by the console. You can also view the outputs of the commands in the console itself. From my personal experience, I find the console pane to be one of the most important panes as it helps me understand the execution of my code in a sequential manner
- Environment / History Pane – This pane is available on the top right hand of the IDE. In this pane, you can get a glance at all the variables that are being declared and used in the current session of R. Each variable or data frame that you create either in the Scripts Pane or by using the Console will appear here. This is useful to understand the different values of the variables during the run time and allows you to code efficiently
- Files / Plots / Packages Pane – This is the pane that appears on the bottom right-hand side of the IDE. In this pane, under the Files section, you can get a glimpse of the current working directory in which you are working and all the files and folders present in it. You can use it to navigate your working directory and import files into your program accordingly. You can also plot various graphs using the R language and all those graphs or plots appear under the Plots section. This is also another useful feature when you graphically want to show the results of your analysis. There is also another section for Packages, in which you can get a list of the packages installed on your machine. There are tonnes of packages available in R using which you can achieve great results. We will discuss more R packages in the next section
Additionally, you can also customize the theme and appearance of the IDE and set it according to your preferences. You can also control the font color and size of the scripts and also the layout of the different panes by altering the preferences. You can also change the theme to a dark one if you like.
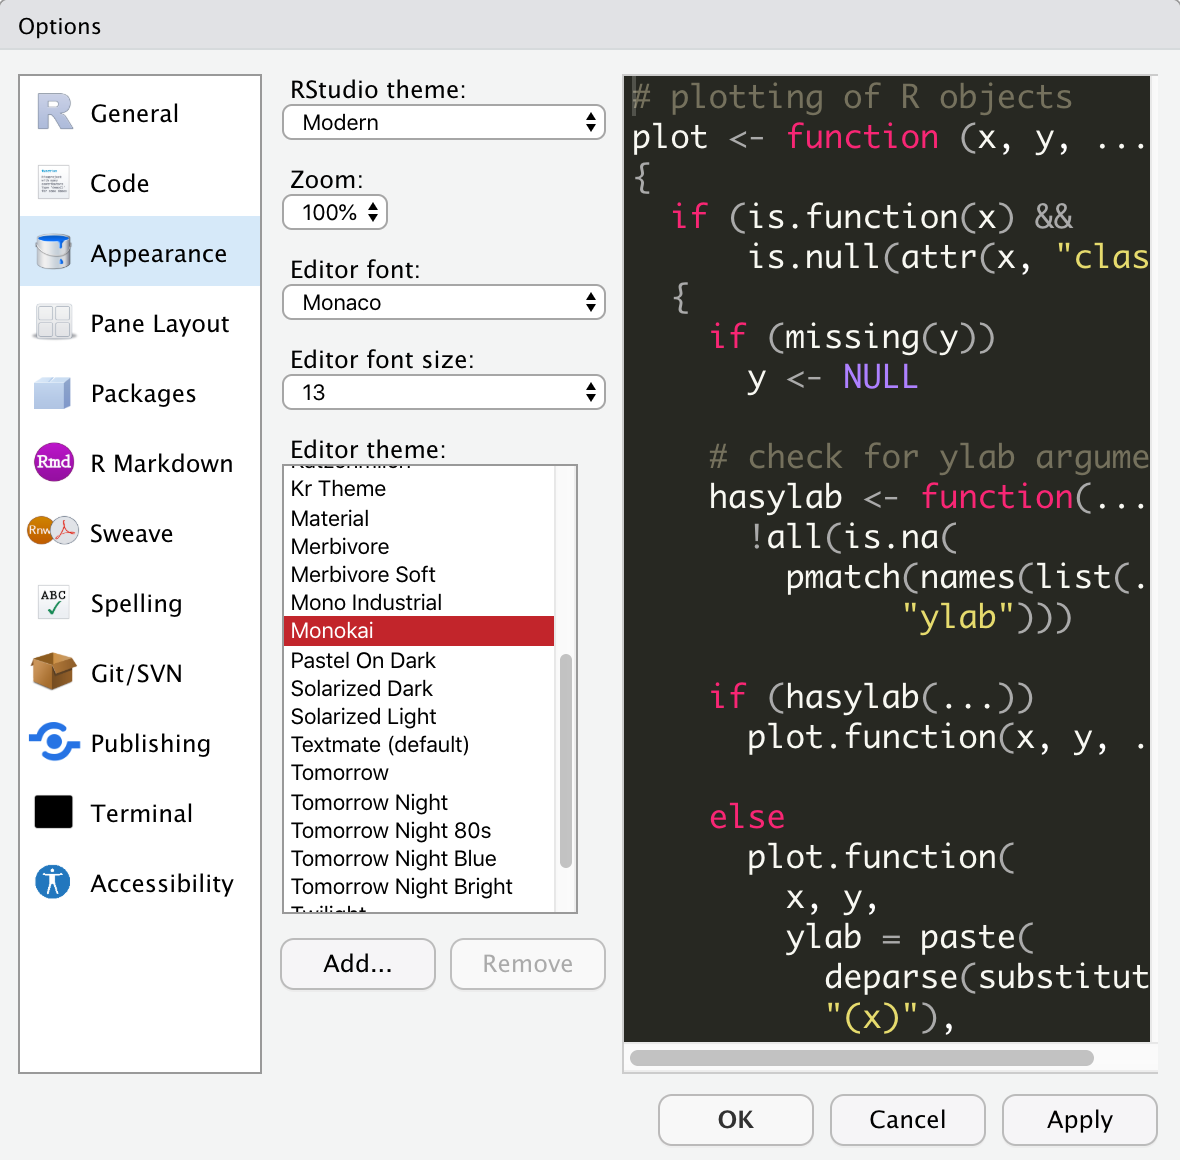
Figure 3 – Preferences for the RStudio IDE
Installing packages in R
When you install R for the first time, there are a lot of packages that come pre-installed. These packages extend the functionality of the base R functions to a larger extent. Often at times, these pre-installed packages do not suffice the need of all the various machine learning or data analysis workloads. In such cases, you might need to install these packages, also known as libraries, from the CRAN directory available online. Once installed you can import these libraries into your script and do the necessary coding. You can install packages by using the command – install.packages(“PACKAGE_NAME”).
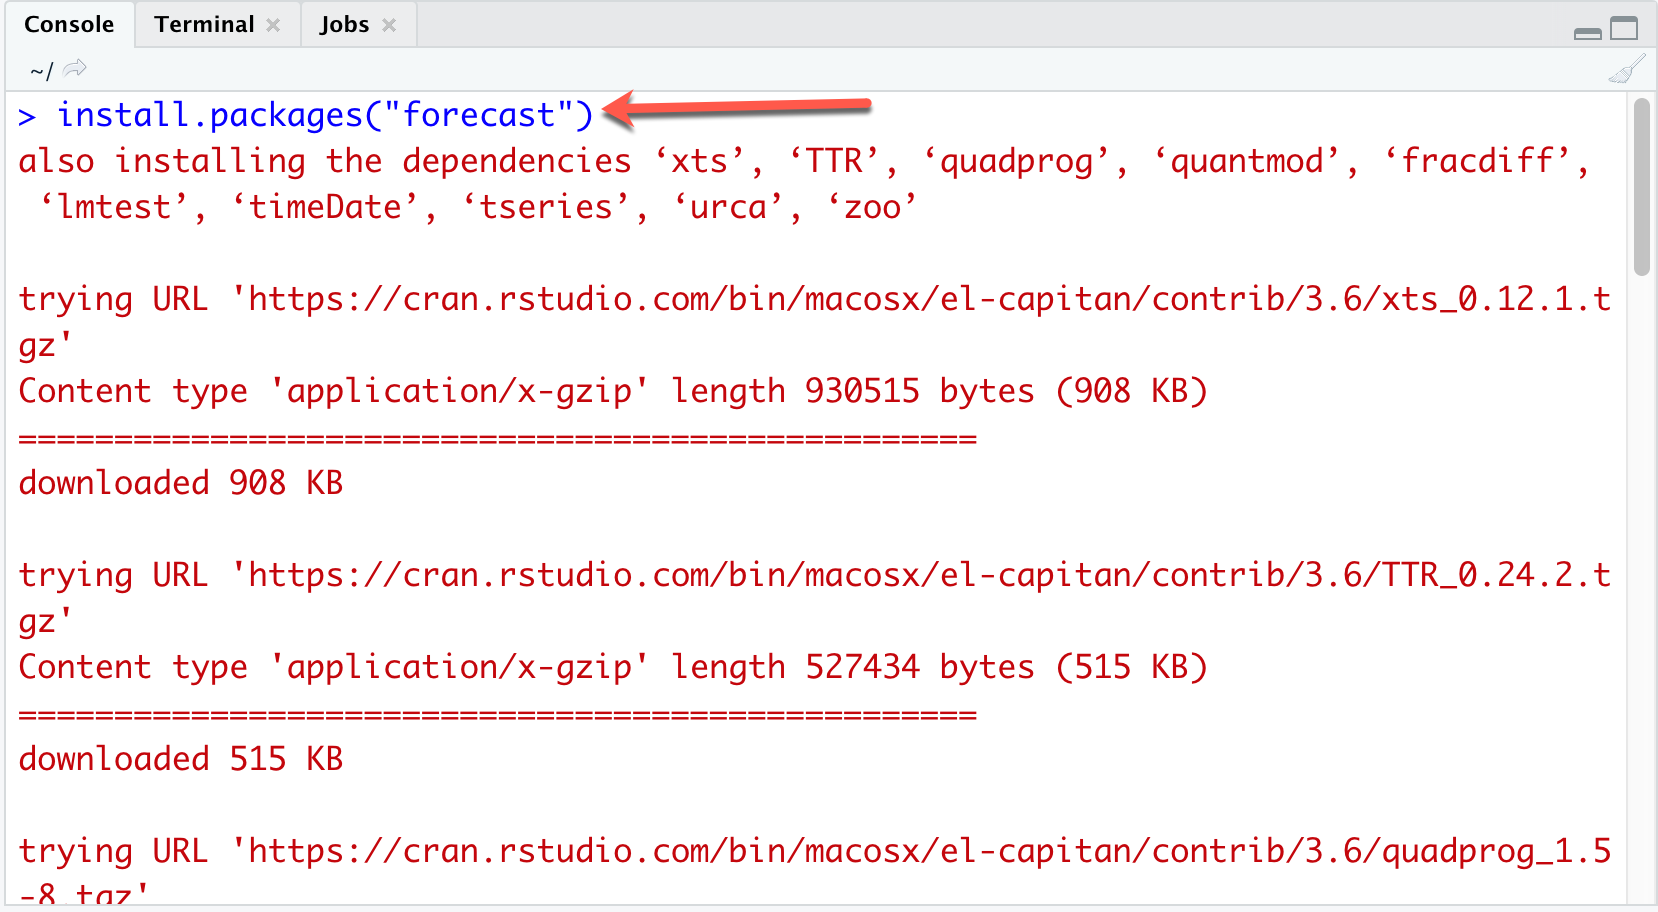
Figure 4 – Installing packages in R
An important and popular package used in the R world is the ggplot2 library. It is extensively used to create beautiful plots based on the data that has been analyzed. An example of generating plots in R is shown in the figure below.
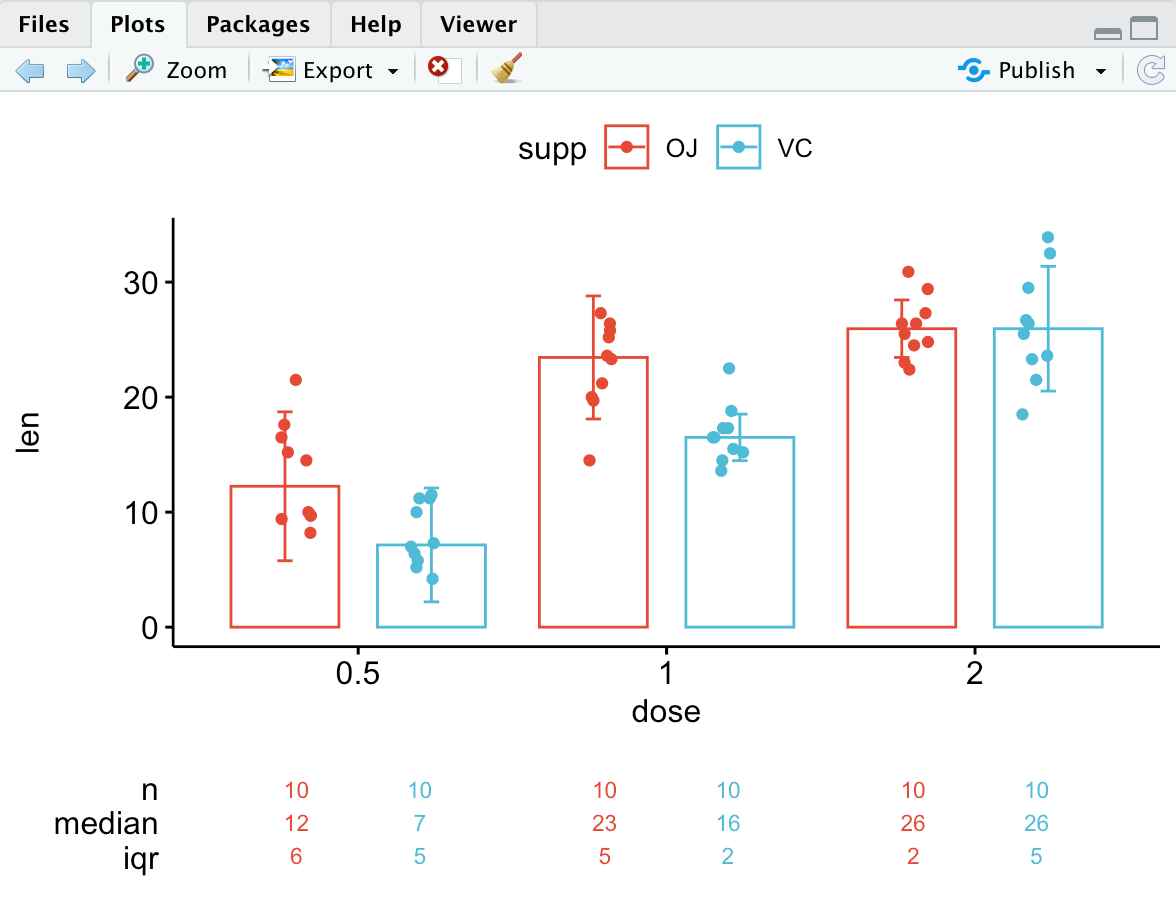
Figure 5 – Generating plots in R
Sharing Data Analysis across teams
An important feature that is used by most of the statisticians and developers is the use of markdown notebooks to share analysis across the teams. You might be aware of the popular Jupyter Notebooks, which is considered to be an essential part of a Data Scientist. R Markdown is somewhat similar to Jupyter Notebooks, except you can do it entirely within the RStudio environment. All you need to do is to create a new R Notebook and save it as a markdown.
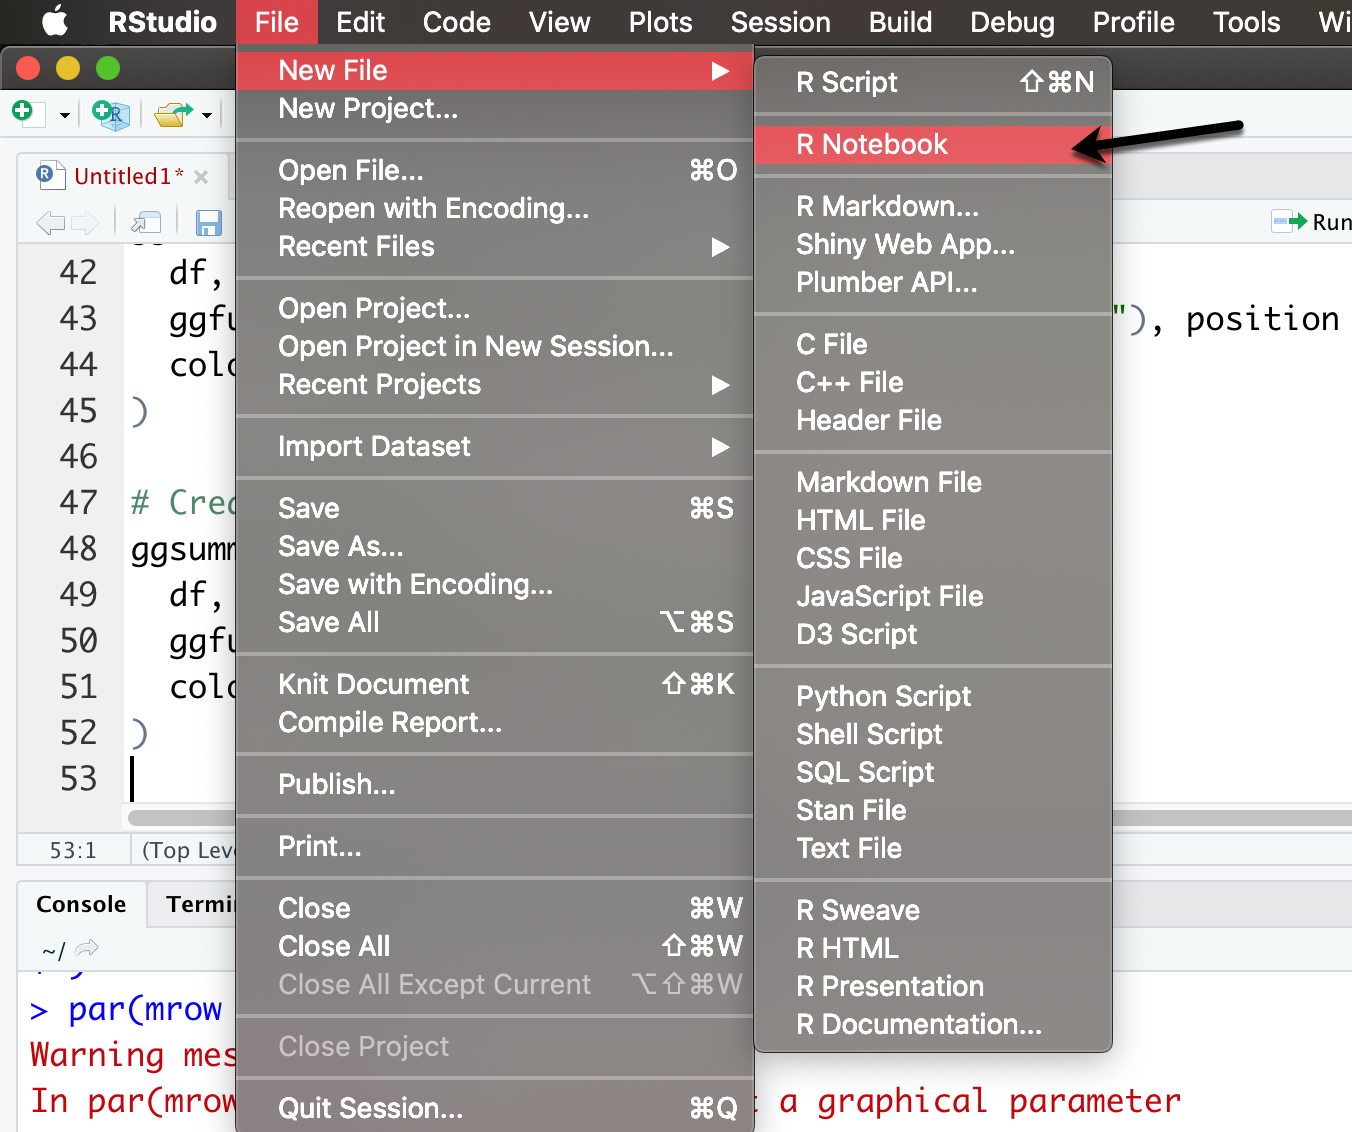
Figure 6 – Creating an R Notebook using RStudio
There is a gallery of different markdown documents that are available for public use. You can view those by navigating to https://rmarkdown.rstudio.com/gallery.html.
Conclusion
In this article, we have explored a brief history of the R language and RStudio, the IDE that can be used to perform various activities within the R environment. R has a lot of built-in methods in order to perform statistical calculations and is also heavily used by academicians. Both R and Python have their own specialties and challenges and it depends from person to person which language they choose to do their work with. Microsoft supports a version of R, known as Microsoft R, which can be installed within the SQL Server environment.
There are a few other articles that focus on using R as a language for performing Machine Learning workloads. You can give these a read.
- Web Scraping for SQL Machine learning using R scripts
- Working with images in SQL Machine Learning using R scripts
- An overview of SQL Machine Learning with R scripts

He is a prolific author, with over 100 articles published on various technical blogs, including his own blog, and a frequent contributor to different technical forums.
In his leisure time, he enjoys amateur photography mostly street imagery and still life. Some glimpses of his work can be found on Instagram. You can also find him on LinkedIn
View all posts by Aveek Das
- Getting started with PostgreSQL on Docker - August 12, 2022
- Getting started with Spatial Data in PostgreSQL - January 13, 2022
- An overview of Power BI Incremental Refresh - December 6, 2021