
Introduction
Far too often we encounter clients that are really too keen to establish all inclusive reports for decision making purposes. While this is super (in principle) oft times these folks will inform you that all the data that is within the tables should be present within the report, and this is not always feasible nor practical.
After much thought I came up with an alternative to permit these folks to have their ‘cake and eat it’ and yet not render a cluttered report.
It all boils down to what is visible and when it is visible.
Getting started
For this exercise (as we have done in past) we shall be utilizing SQL Server Data Tools, hence forward referred to as SSDT.
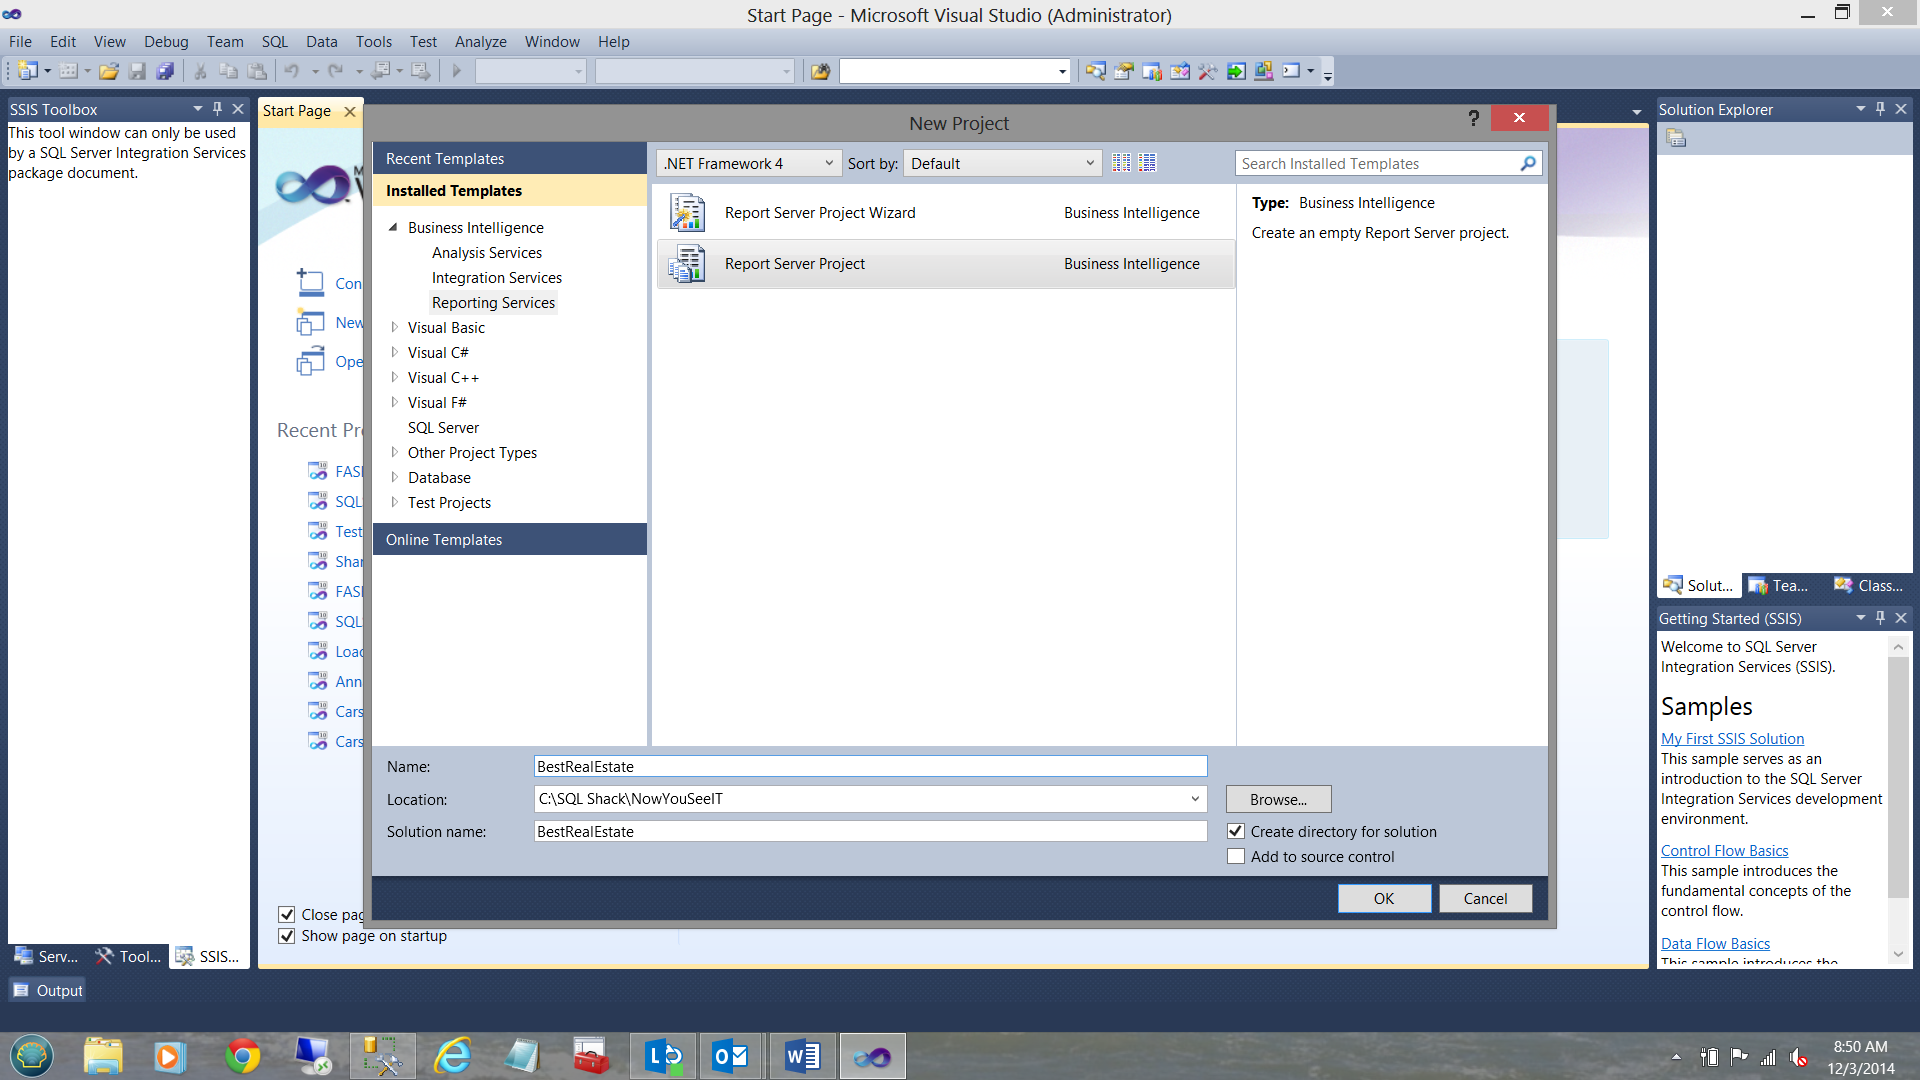
We begin by creating a new “Report Services Project” (see below).
We define where the new project will reside and click OK to arrive at my work area.
Our first task will be to create a new report.
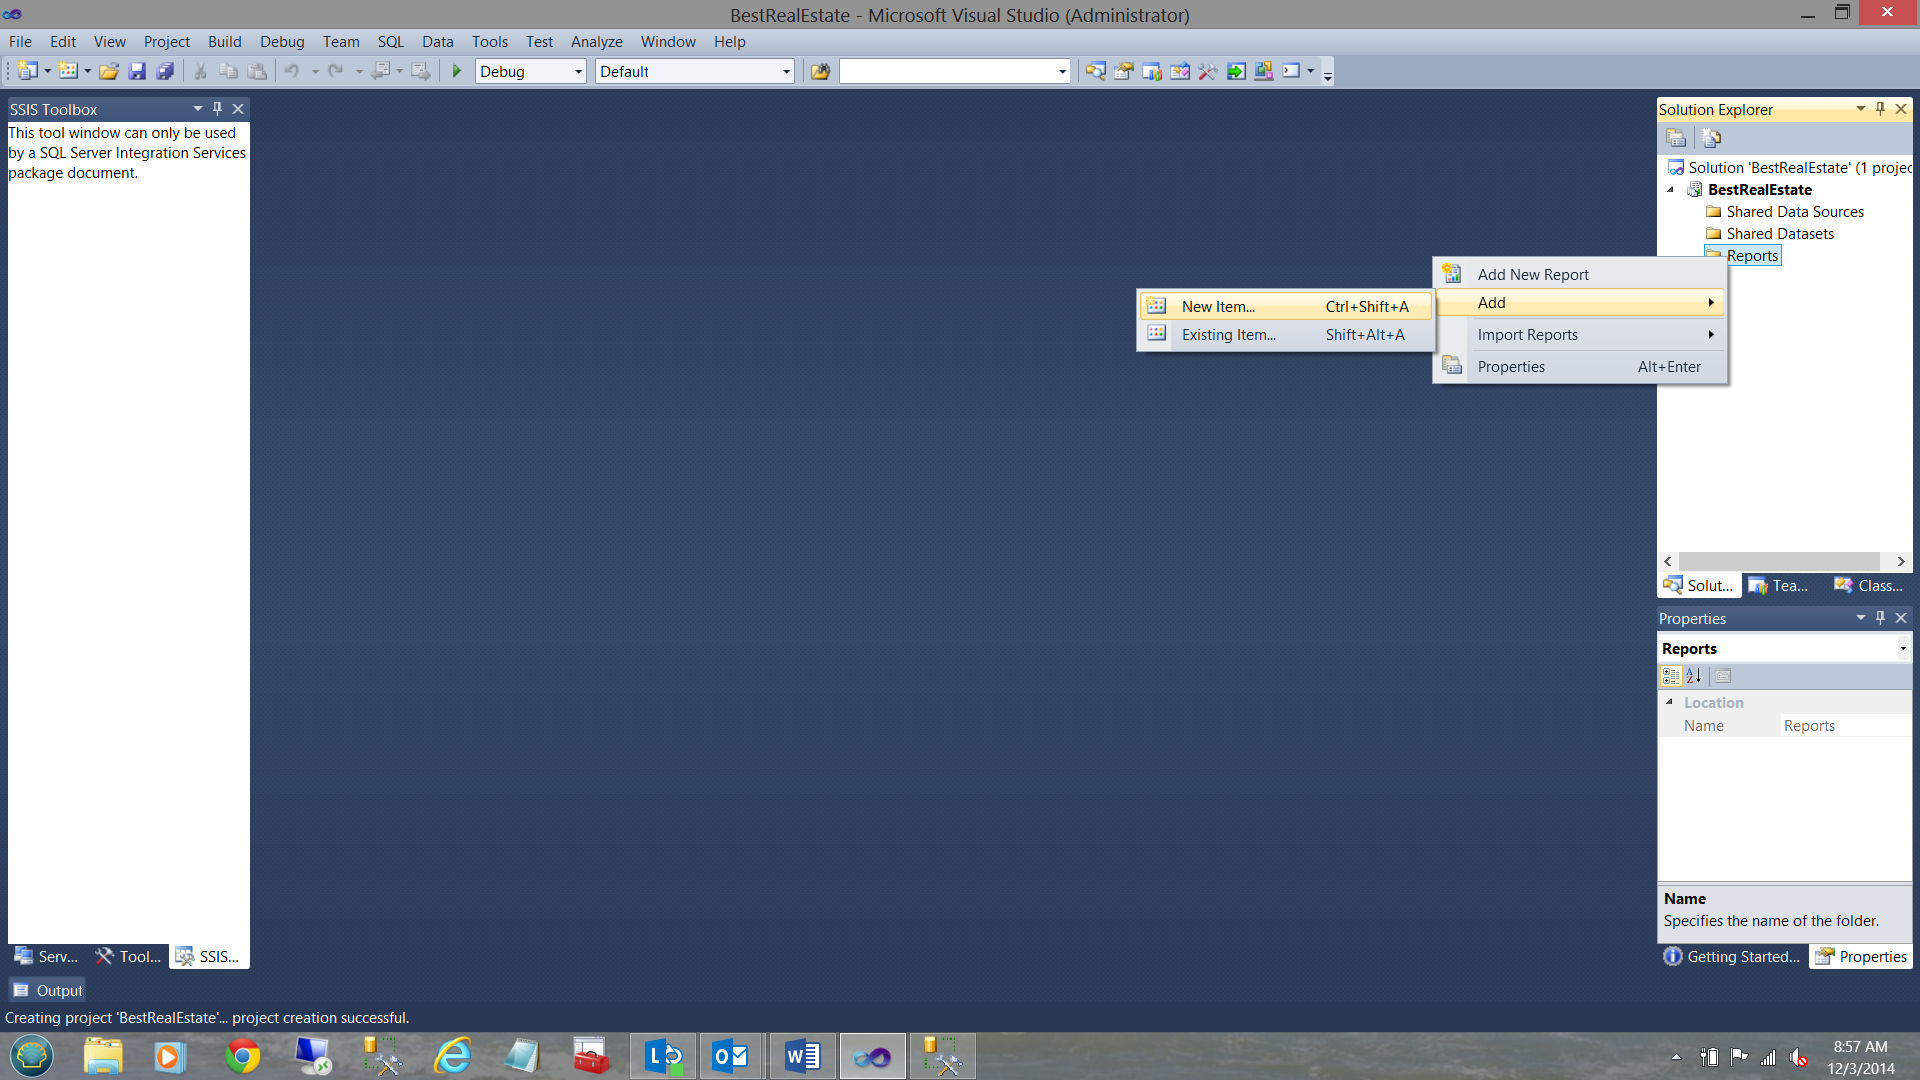
We right click on the “Reports” folder (in the Solution Explorer) select “Add” and then “New Item” see above.
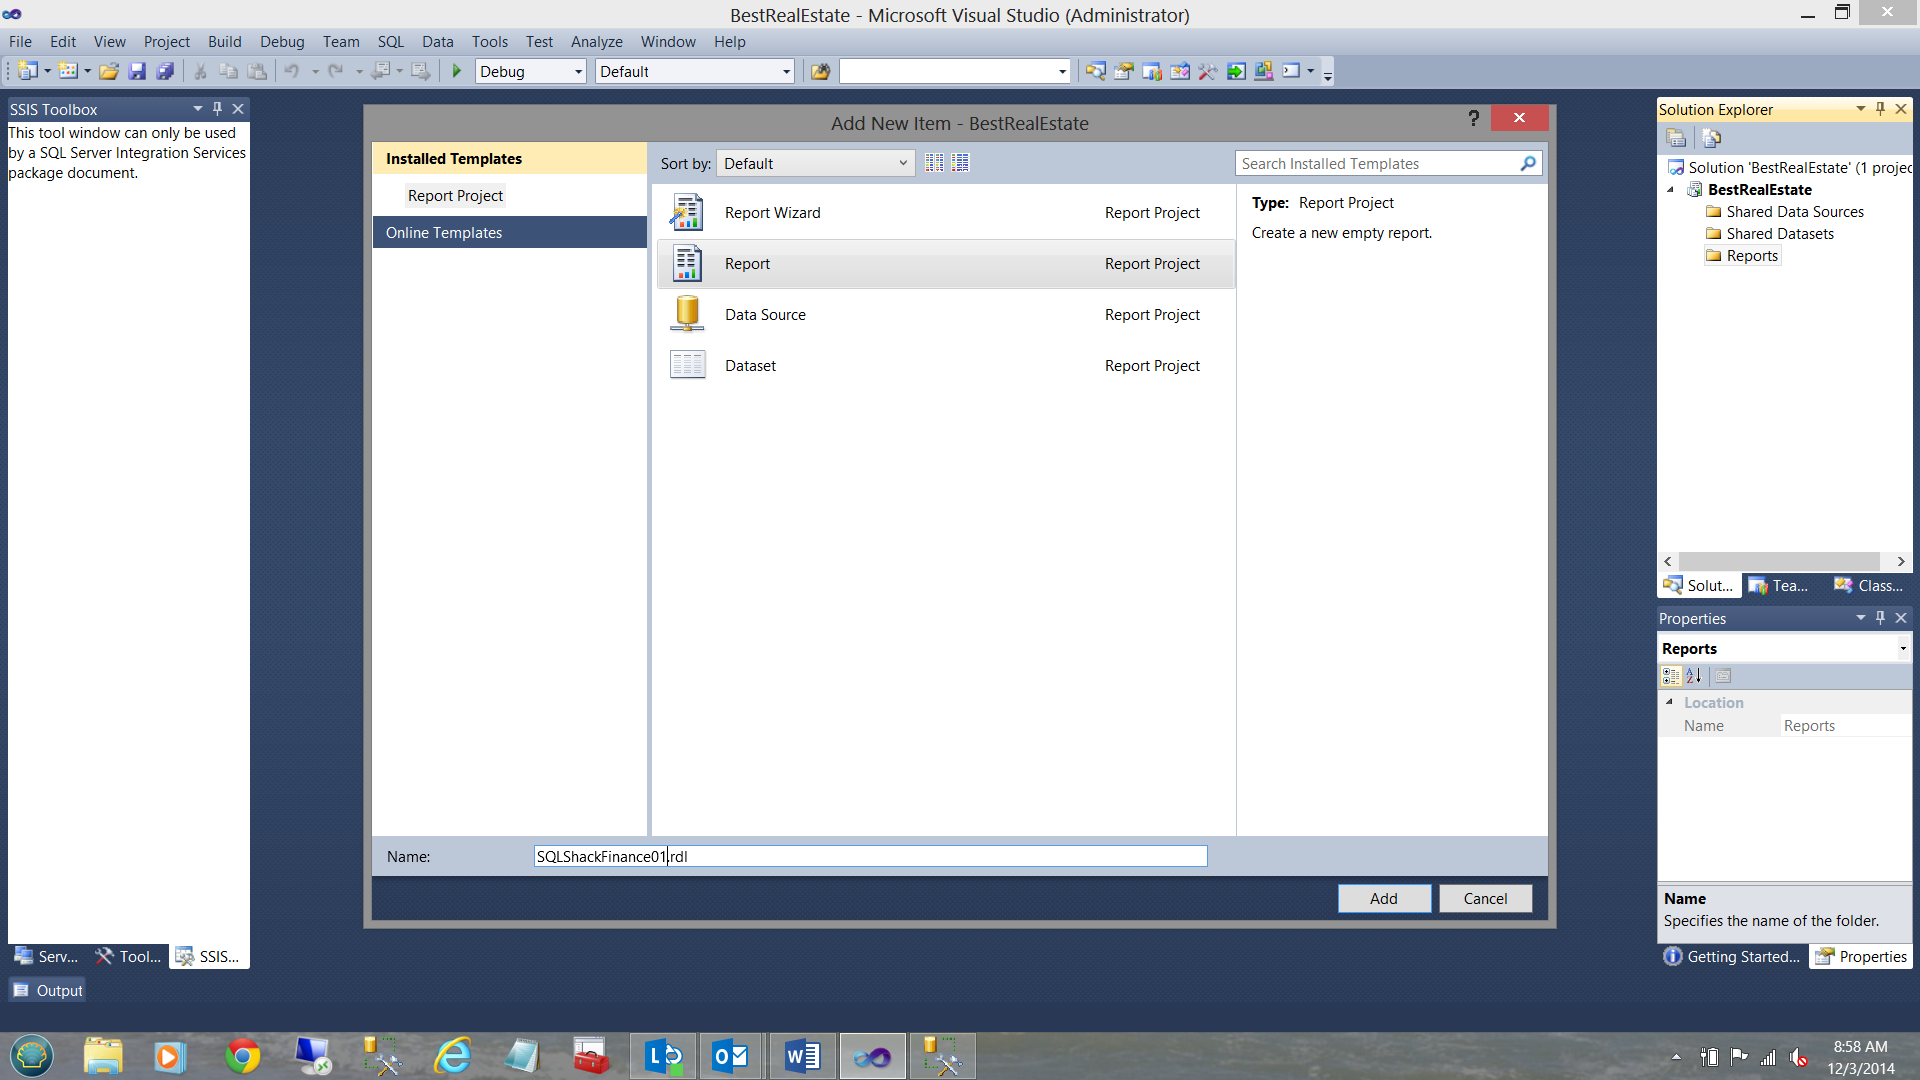
We select “Report” from the “Add New Item” menu (see above). We give our report a name and click OK to exit the “Add New Item” menu. We are returned to our “Drawing Surface”, however we now find ourselves within the Report (that we have just created).
Adding a new data source
Having created a new report, we now wish to be able to pull the required data from the database tables.
To do so, we must connect to the database(s) concerned. We are going to cover this part at a high level as I have discussed the process in detail in other postings on this website.
We right click on the “Shared Data Sources” tab in the solution explorer and select “Add New Data Source” (see above).
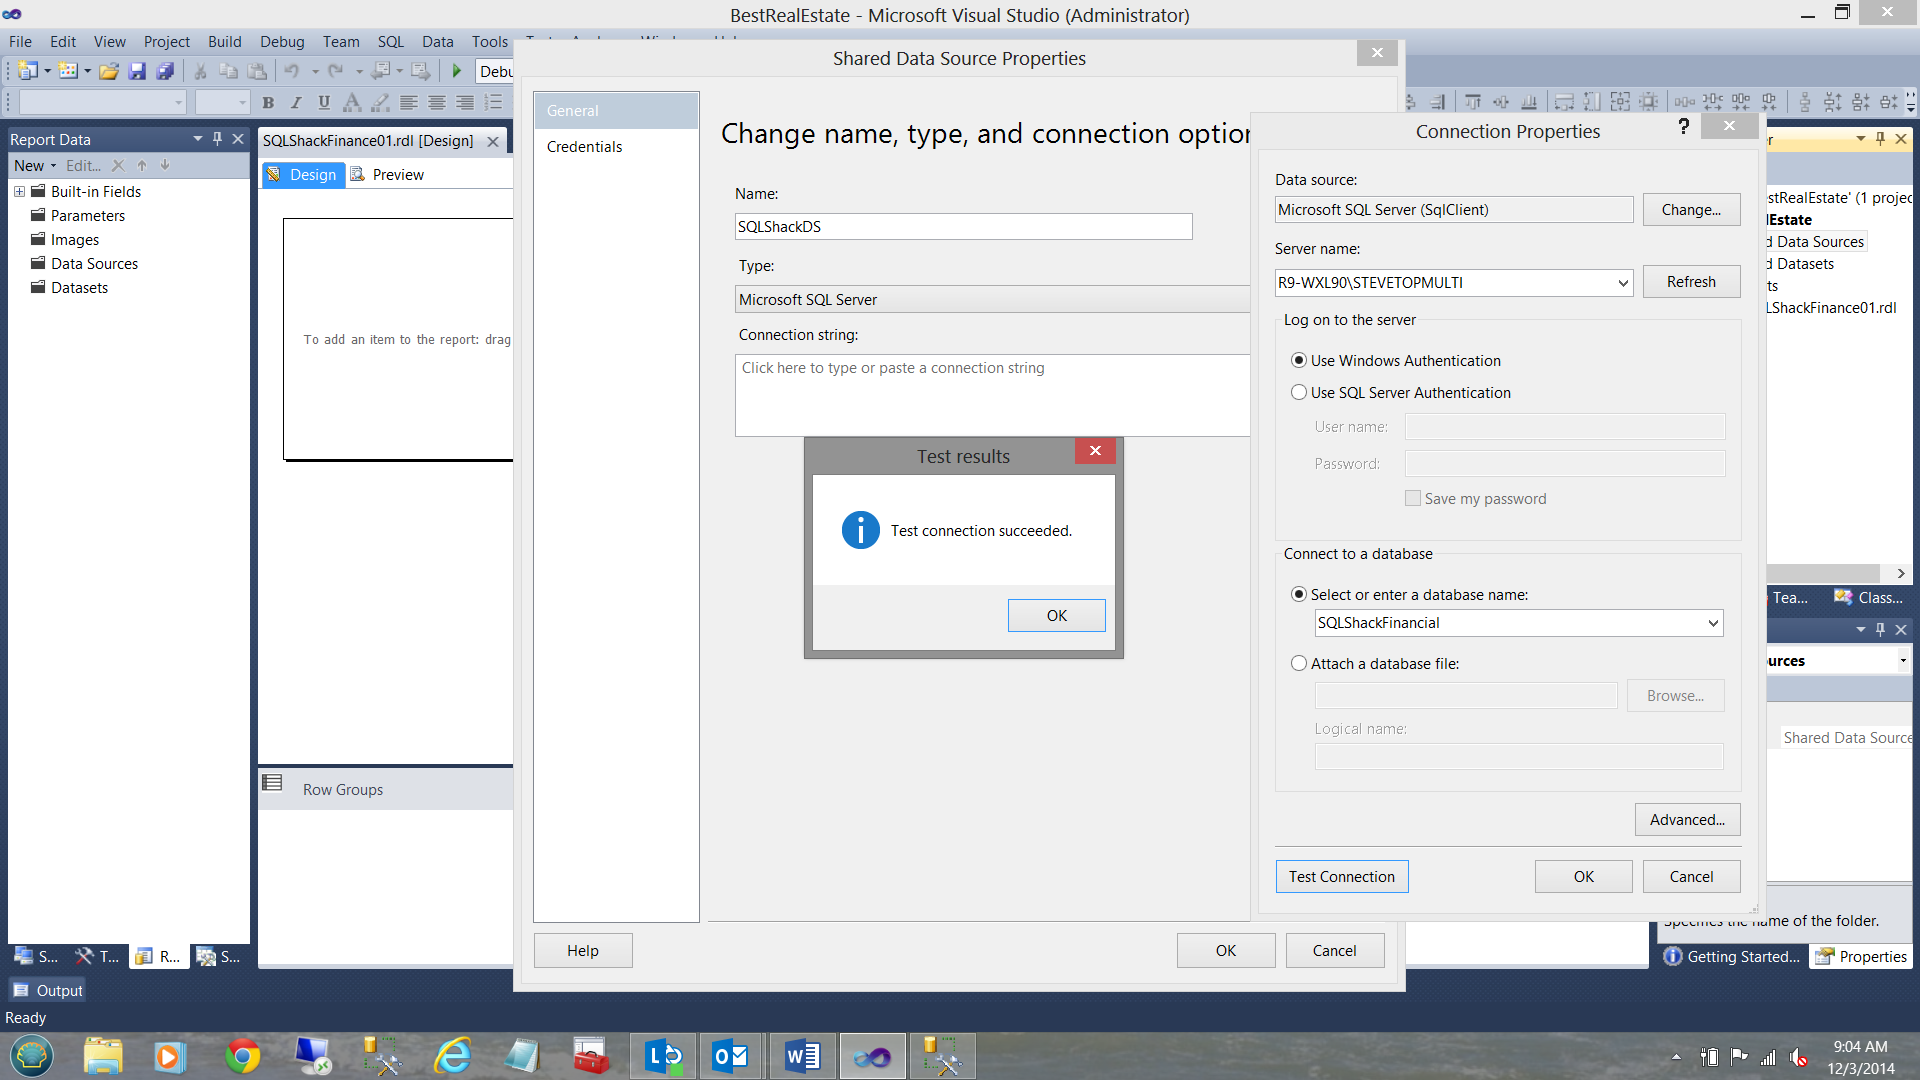
We complete the “Shared Data Source Properties” to point to my database (see above). This requires the server name, the database name, how users will authenticate and the name that we wish to utilize for this “Shared Data Source”.
Once completed, we click OK, OK, and OK to exit out from the Data Source editor.
Creating the first of our datasets
As I have discussed in earlier articles, datasets may be likened to a bucket. The data source may be likened to a water hose connected to the faucet outside the house (the database). The controls that we place upon our reports, source their data from this dataset (bucket).
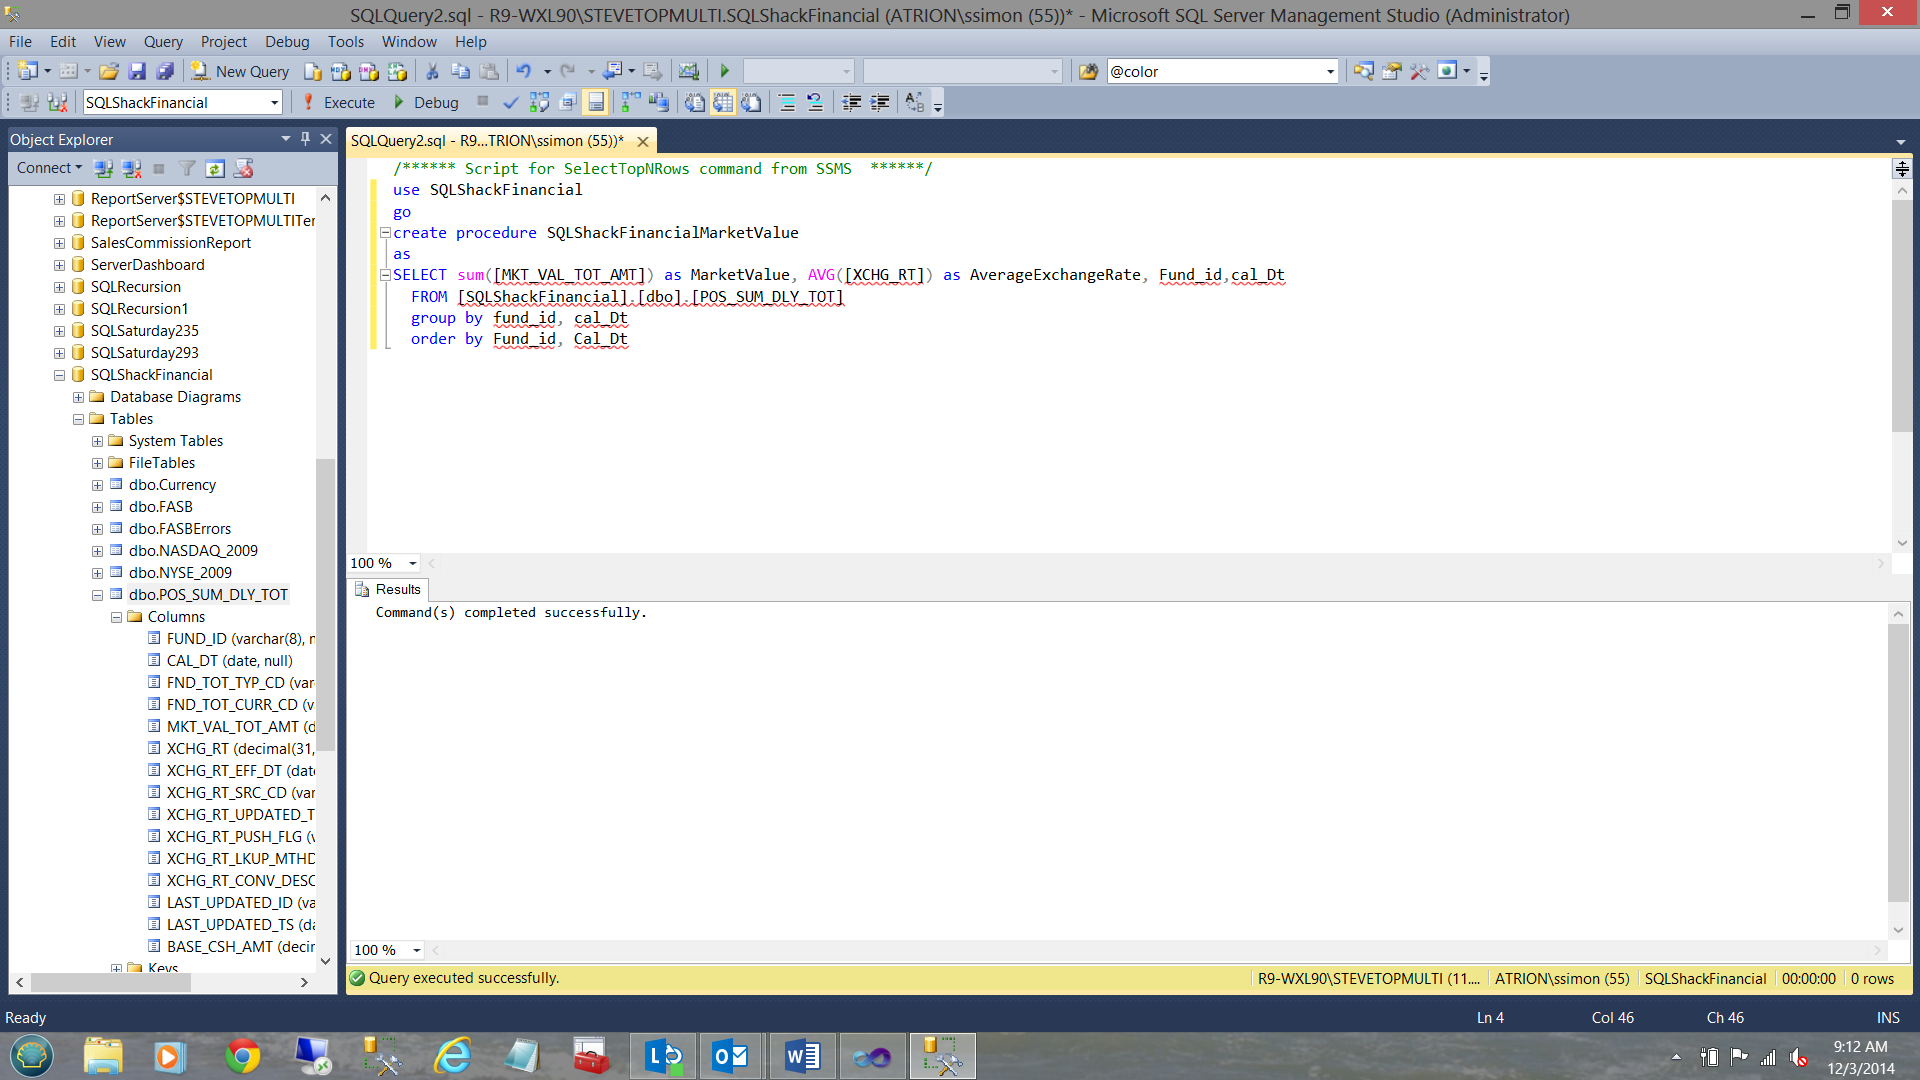
The first of the datasets that we shall be creating will contain the market values of several financial funds that SQL Shack Financial possesses. This data will be pulled from the necessary tables via a SQL Server Stored procedure. This stored procedure will be “called” by the data set at runtime. The dataset will be the source of data for the matrix and line graphs that make up our report. Our stored procedure may be seen below:
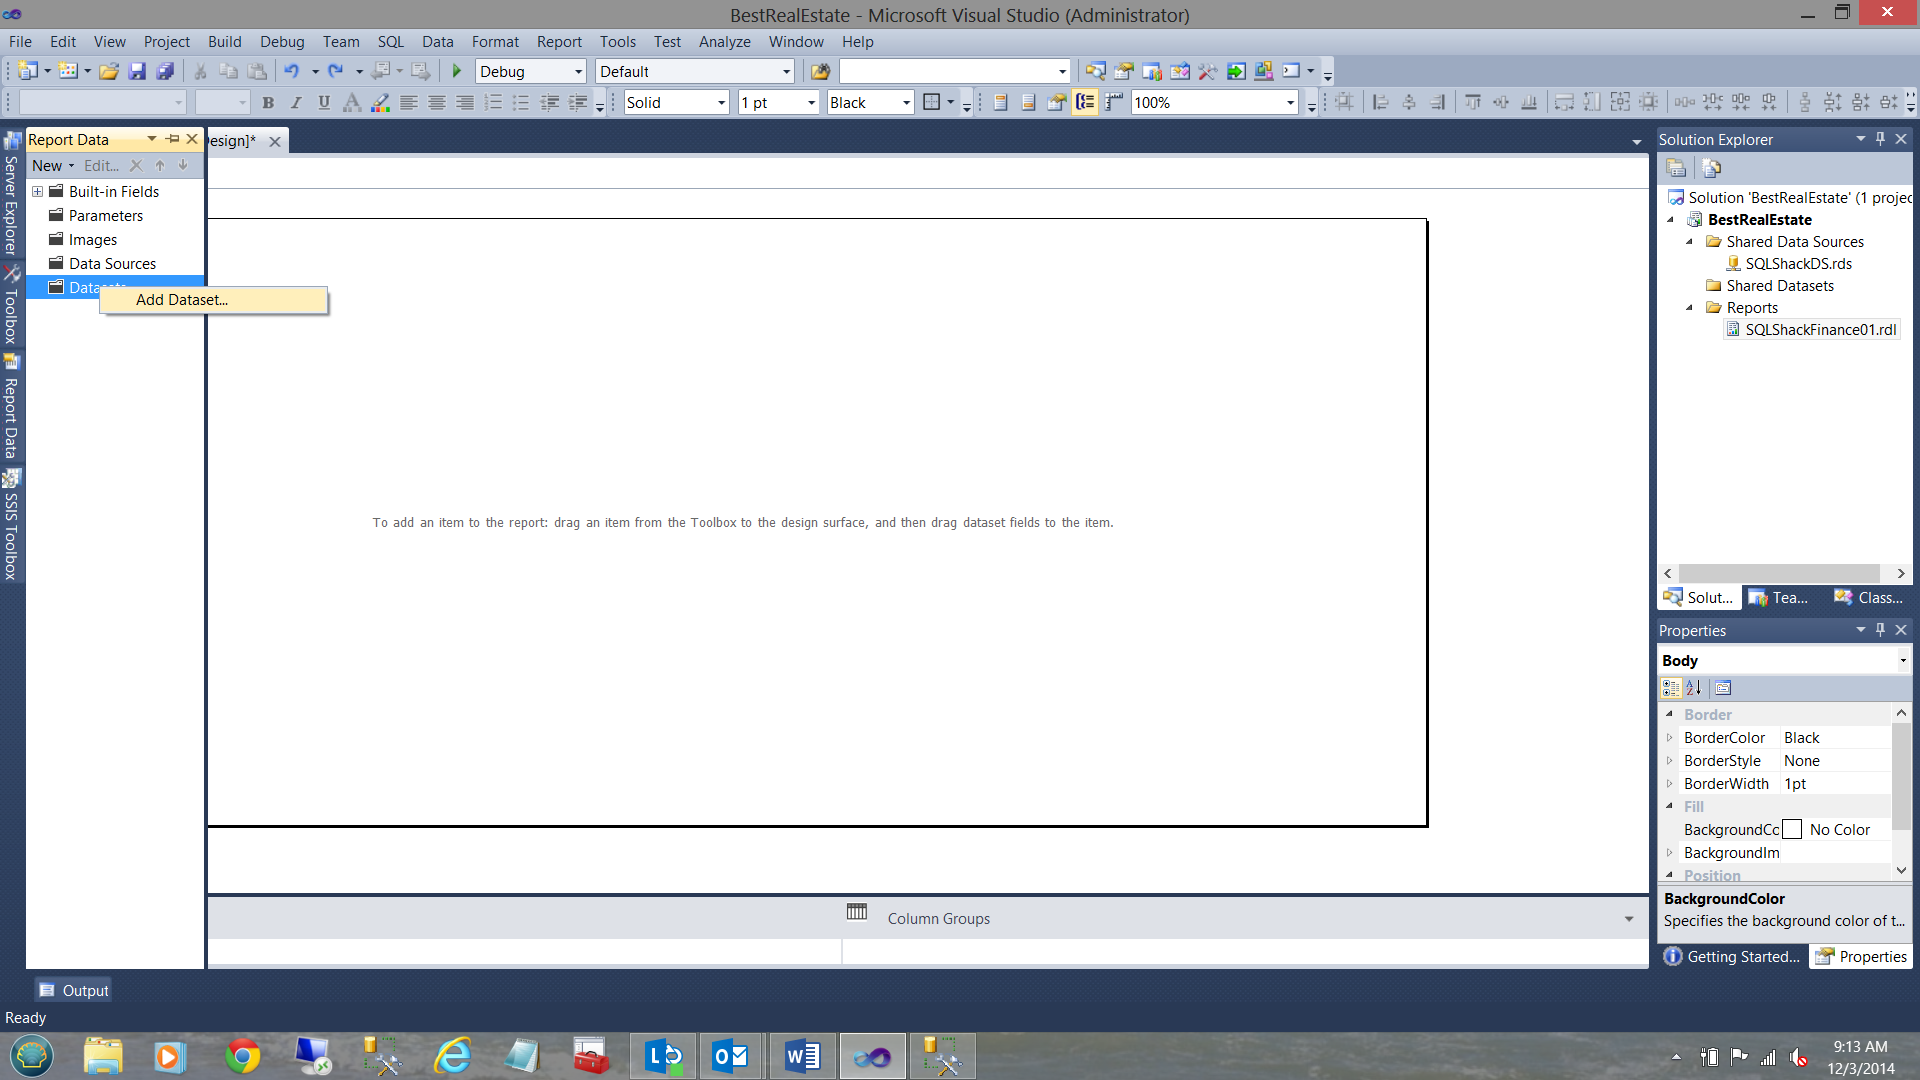
Now that our stored procedure has been created, we move back to report project. We must now create our “bucket” to hold the data coming from the database. We right click on the “Dataset” folder and select “Add Dataset” (see below).
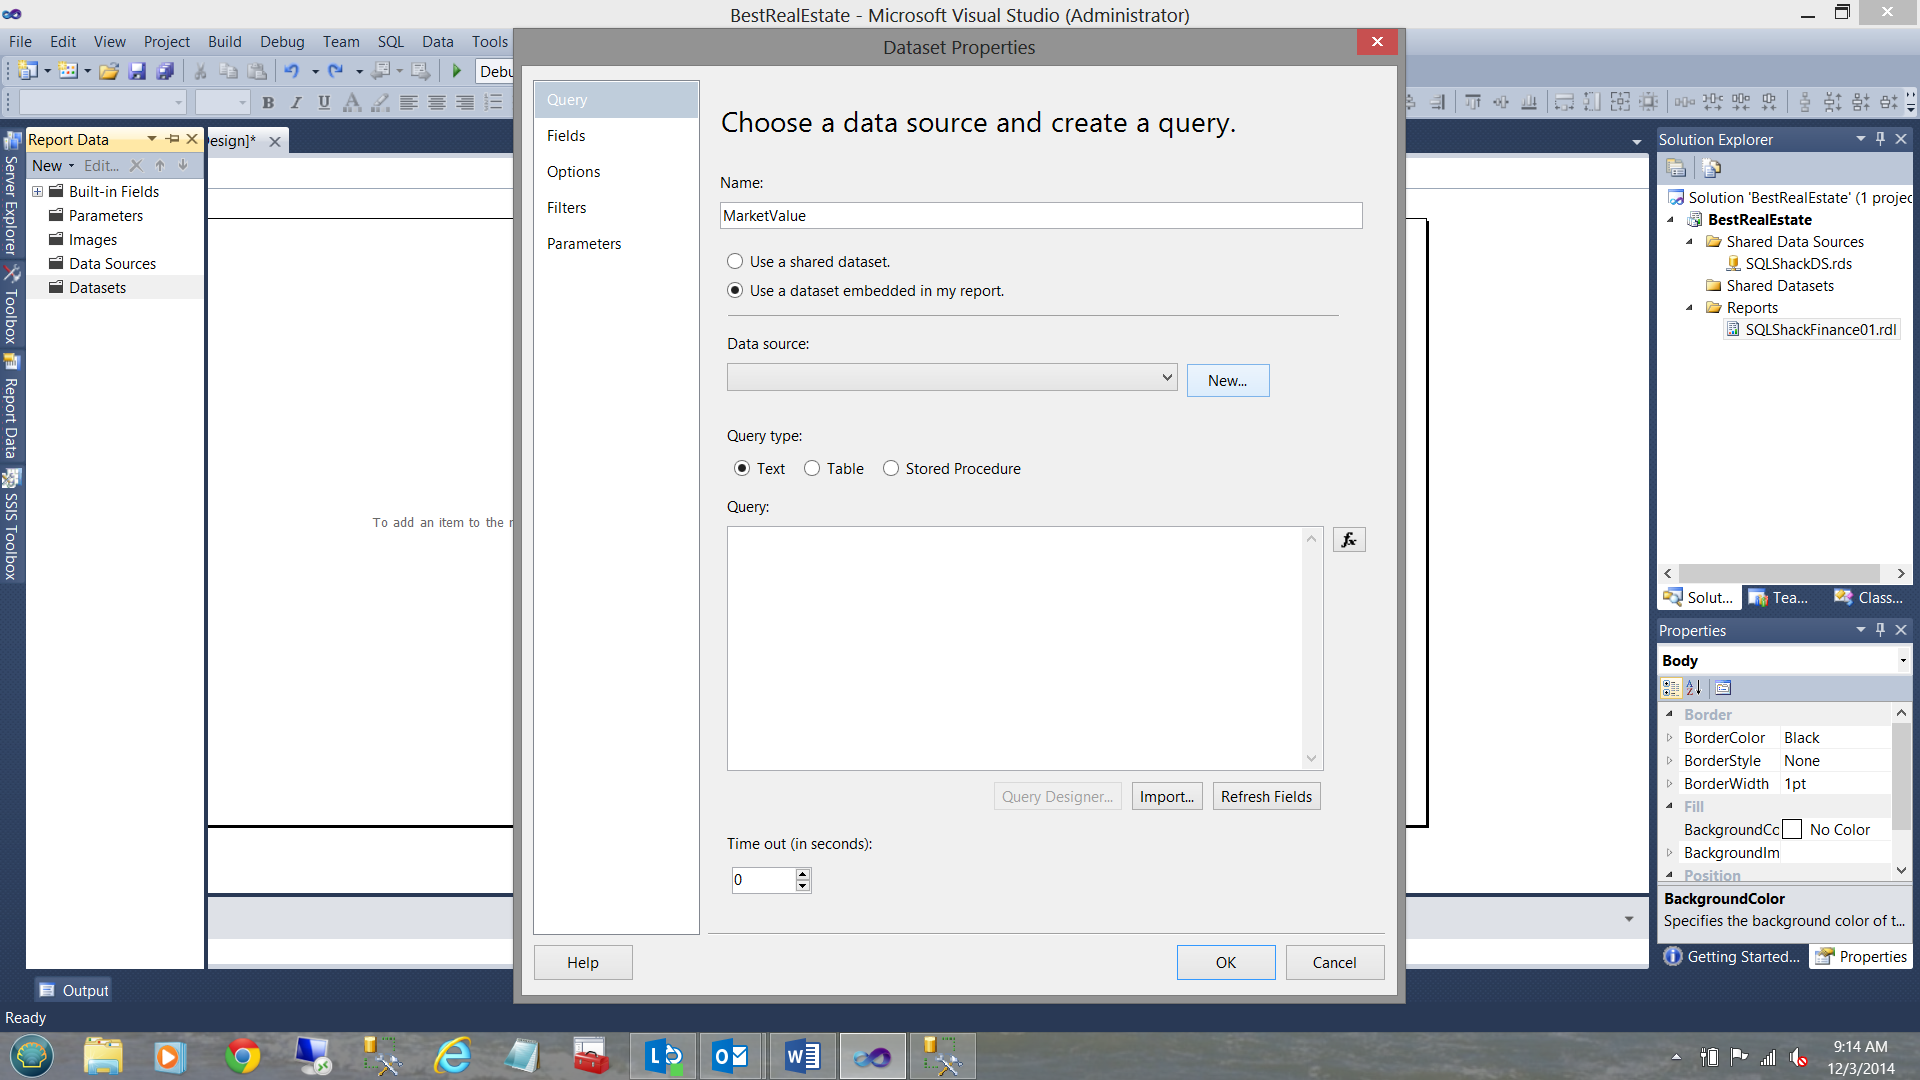
We give the dataset a name. In our case we select the name “MarketValue” (see above).
The “Create Dataset Wizard” now needs to understand where the data (that it must pull) resides. We shall select “New” (see the “New” button in the middle of the screen dump above). It should be mentioned at this point that a so called “best practice” is to create local data sources which are applicable at the report level. These local data sources will inherit the connection attributes from the shared data source that we created above. We give our local data source the name “SQLShackFinancialDataSource” (see the top of the screen shot below). This connection string will utilize the SQLShackDS shared data source (see below).

Our connection string has been created (see below). We click OK to continue. We find ourselves back at the “Choose a data source and create a query” data entry screen.
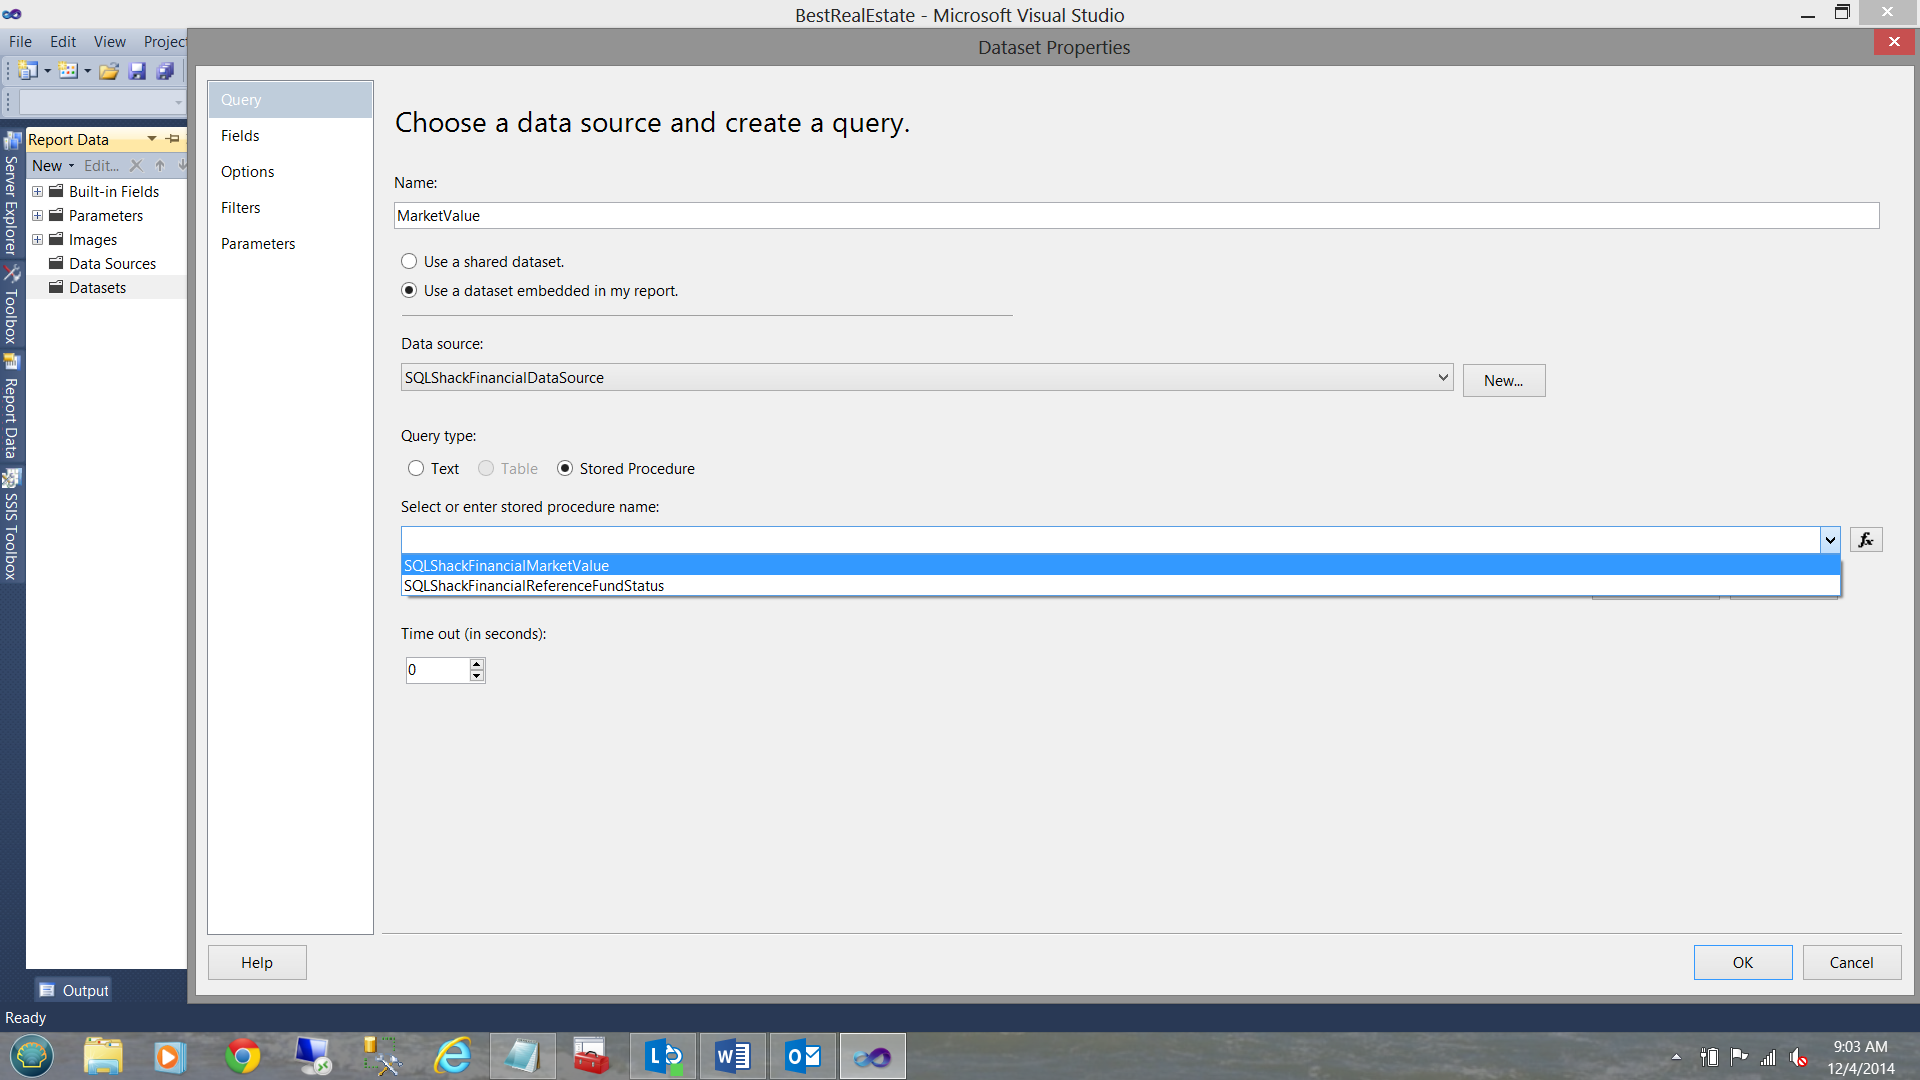
At this point we click the “Stored Procedure” radio button (see above) to let the data source know that the query required to pull the necessary data, resides within a stored procedure. We click OK to exit the “Create Dataset” wizard.
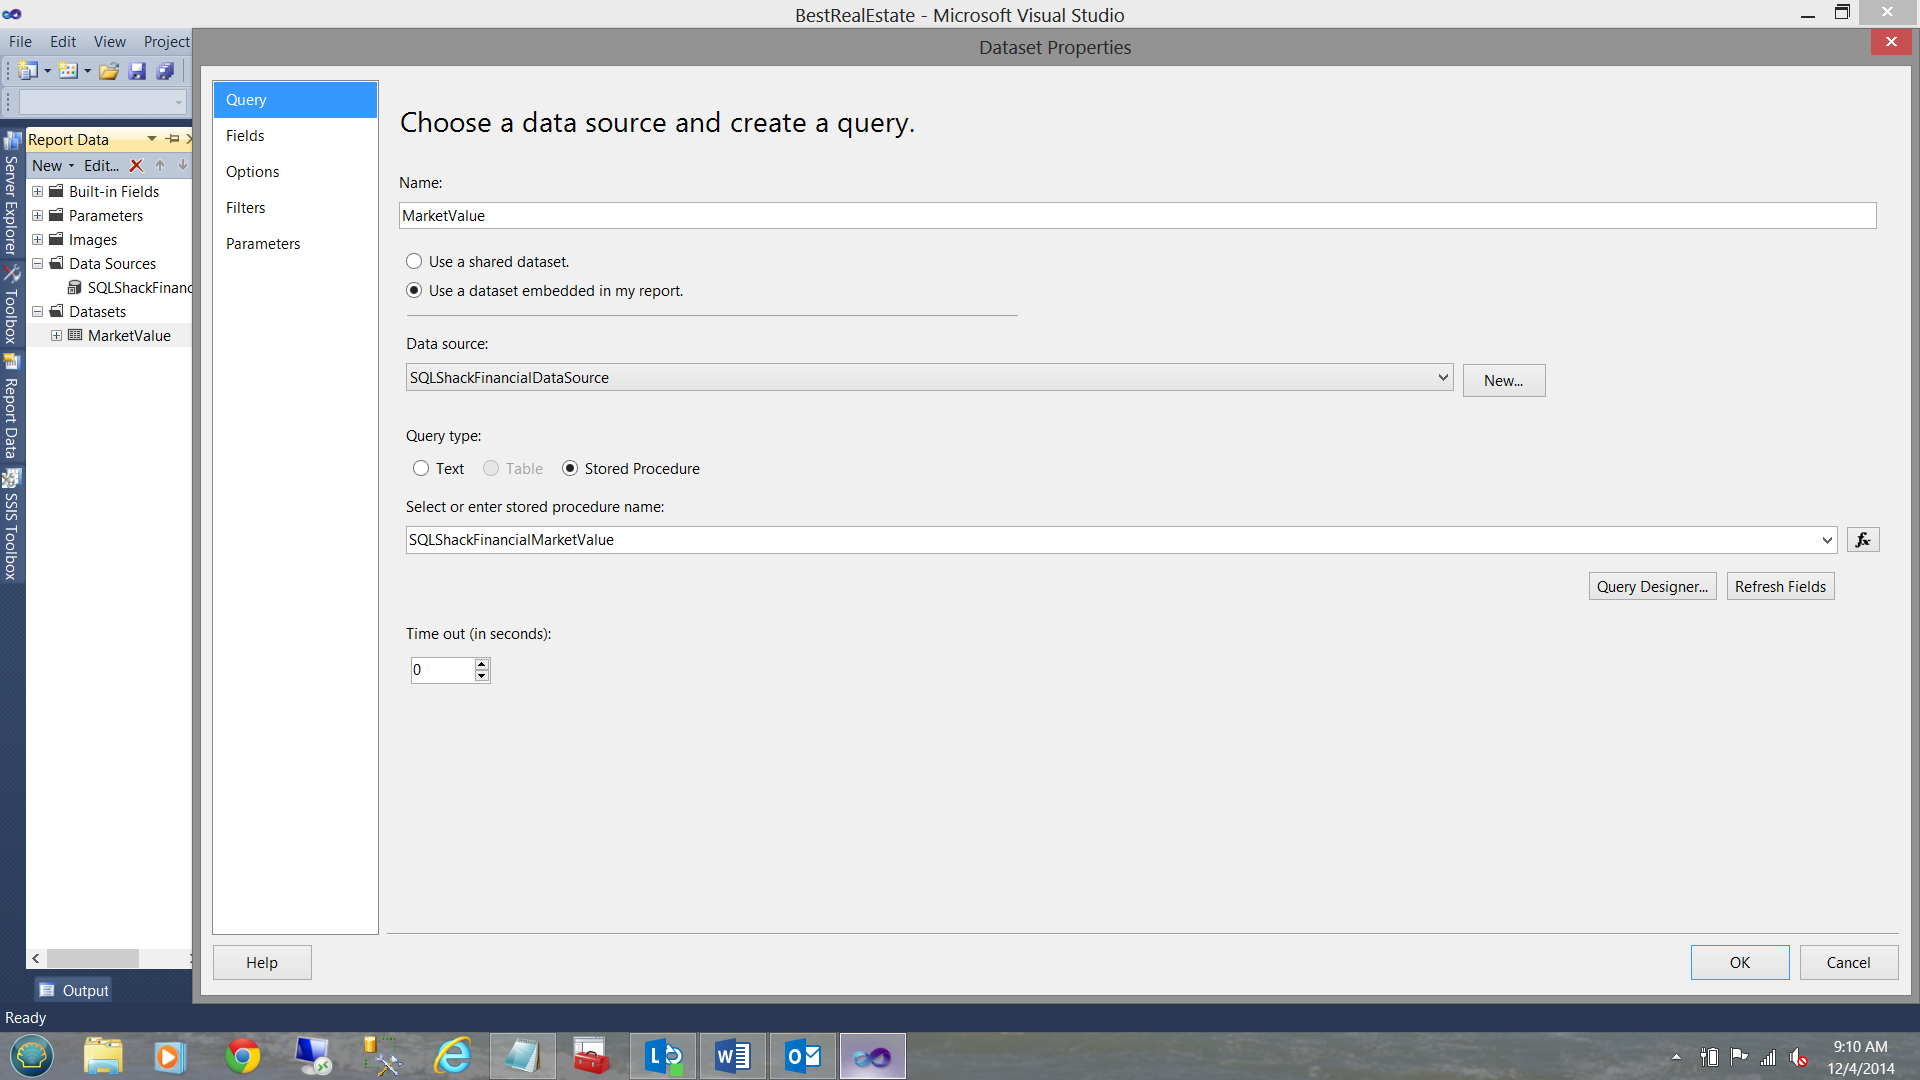
Opening the newly created dataset, we see the setup that we just created shown to us on the “Query” tab.
We now click the “Fields” tab to ascertain just which fields are being pulled by our query (see below).
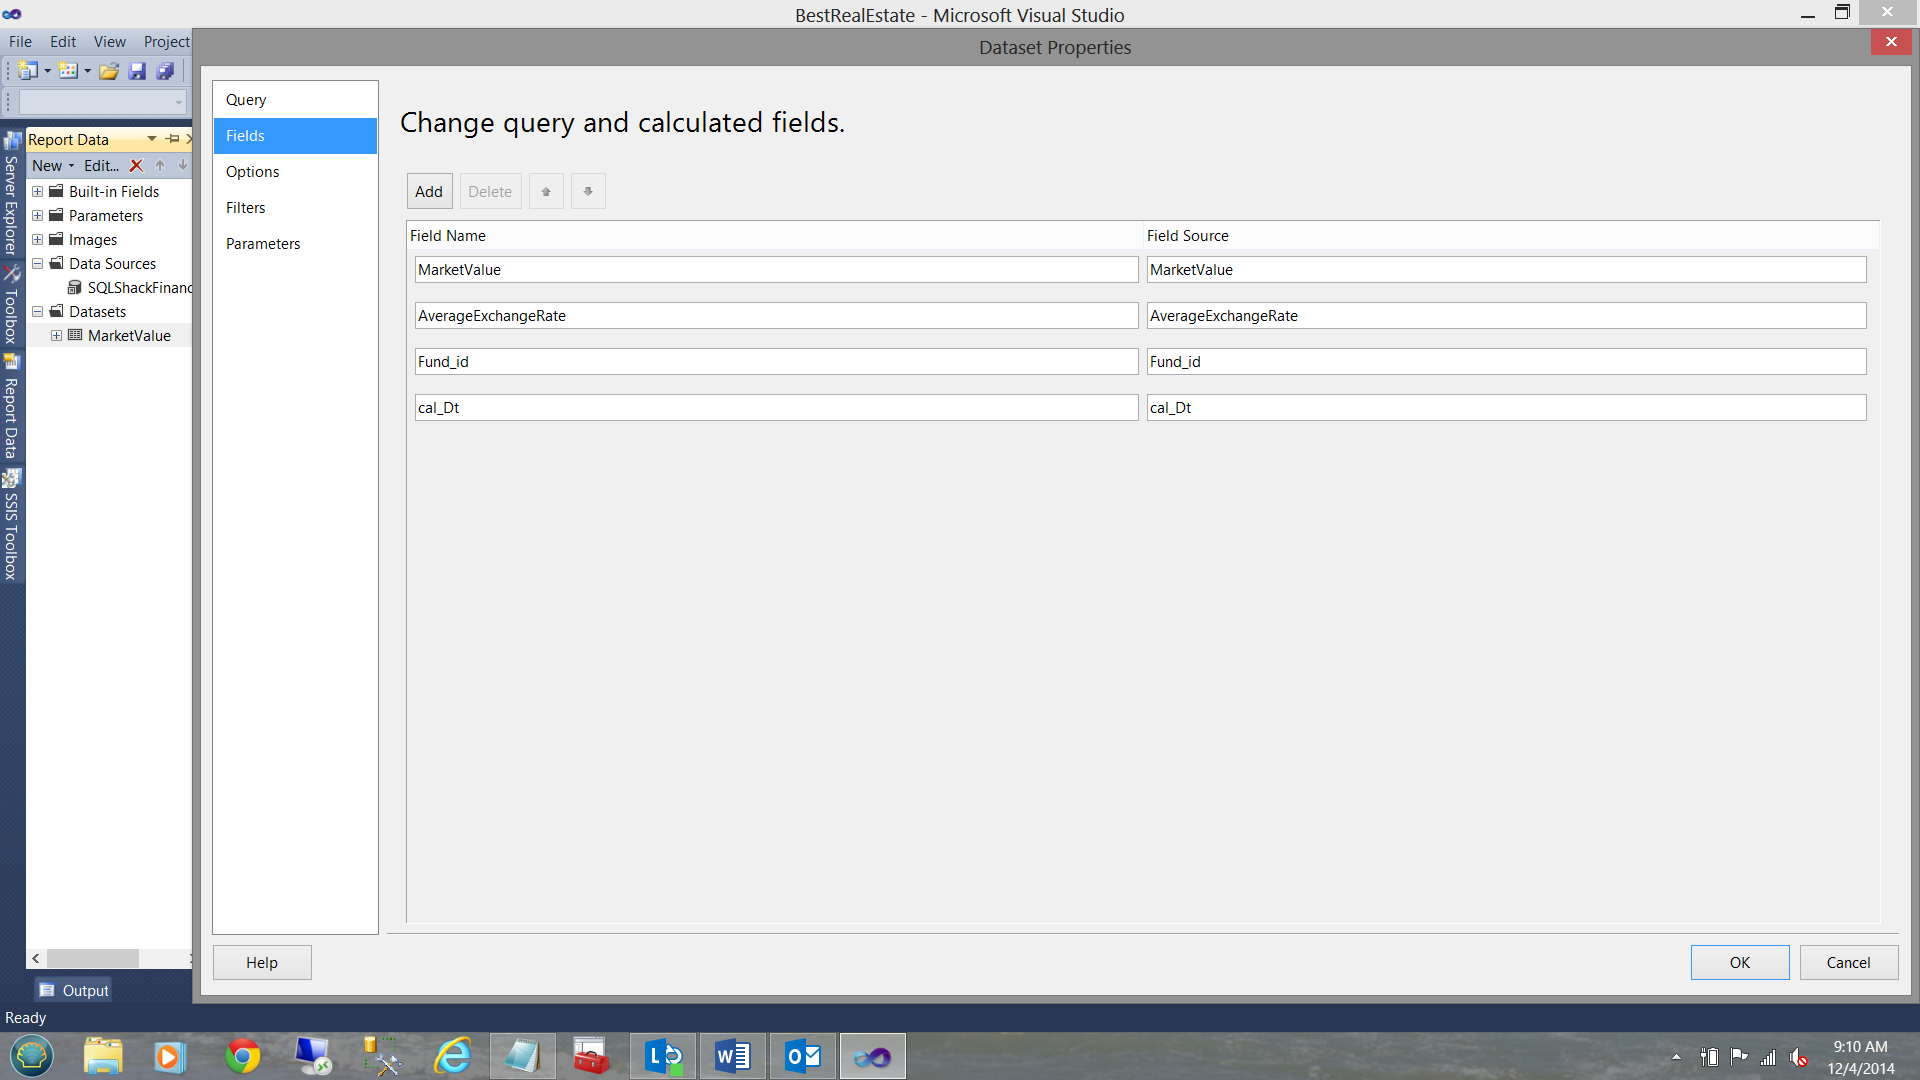
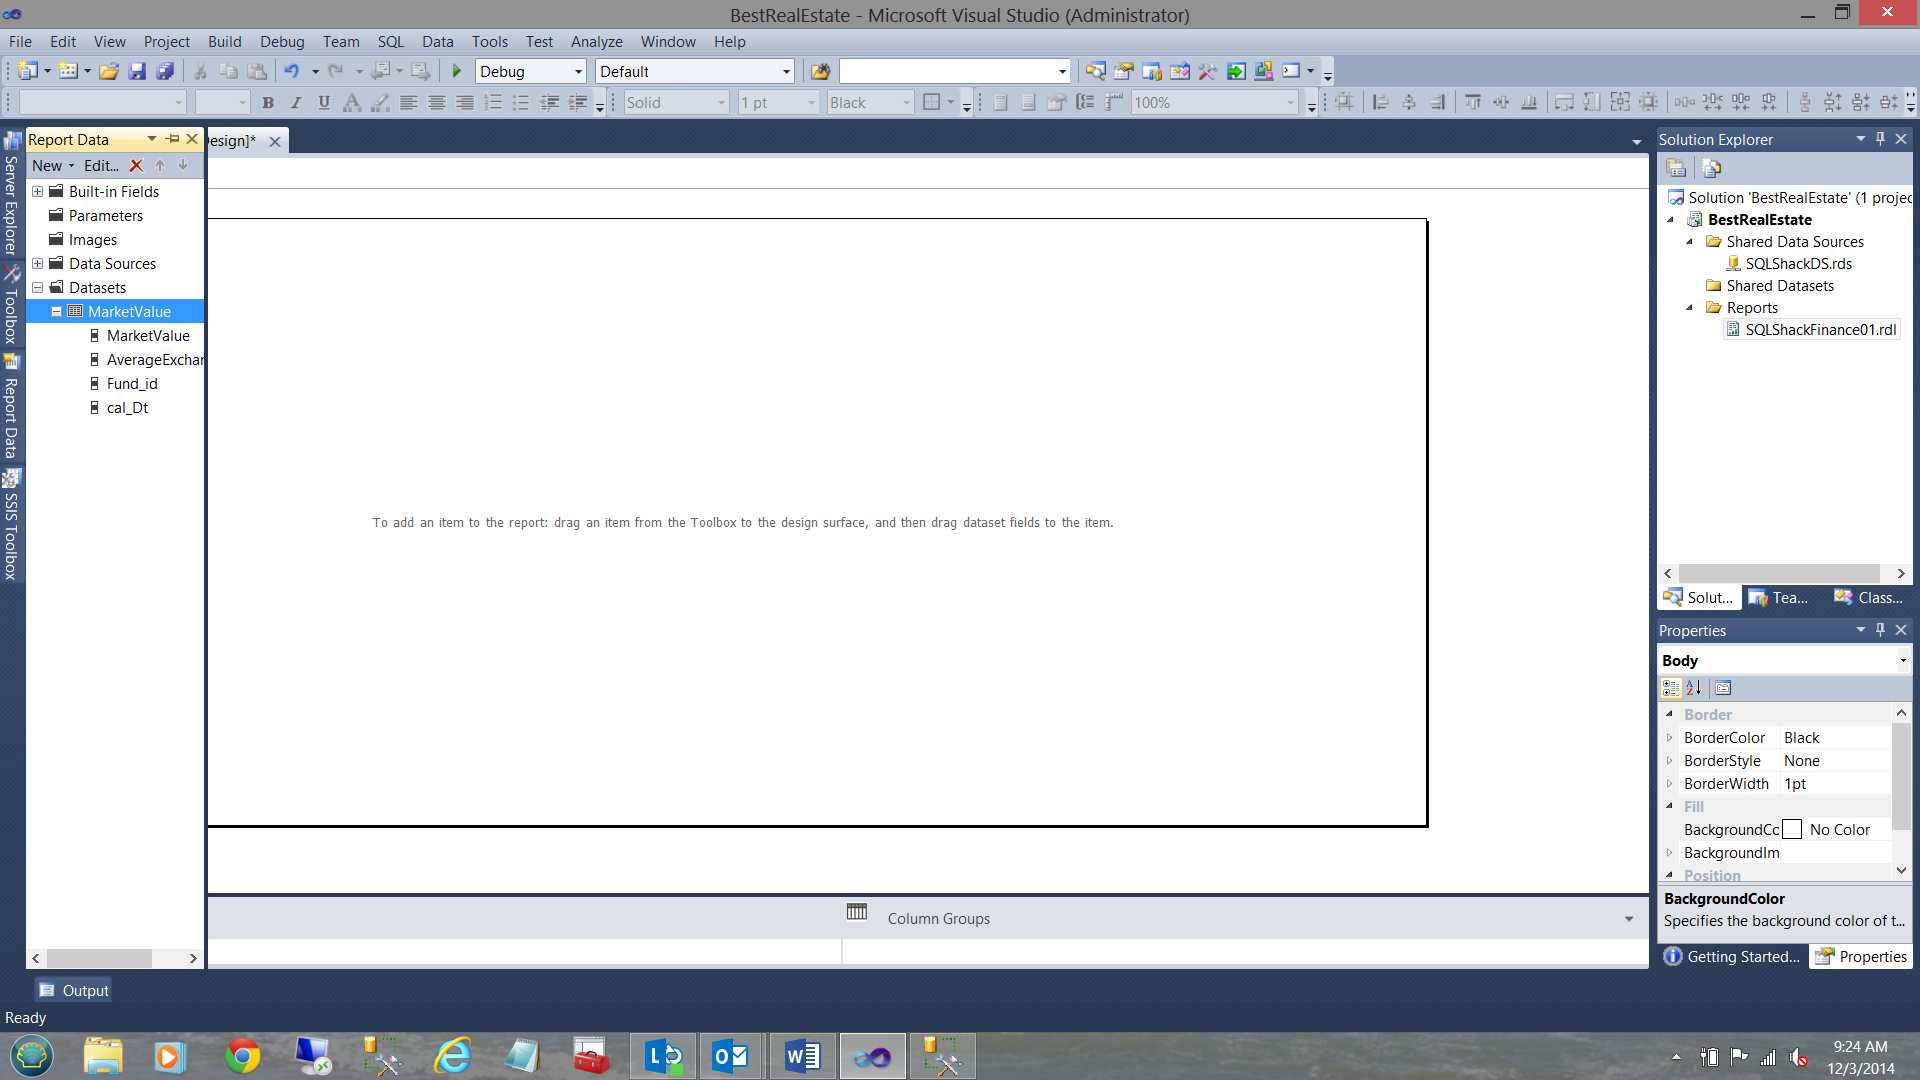
We see that everything is in order. We therefore close out by clicking “OK” and we are returned to my drawing surface (see below).
Viewing our data within a matrix
We now drag a matrix control (report item) onto our work surface (see below).
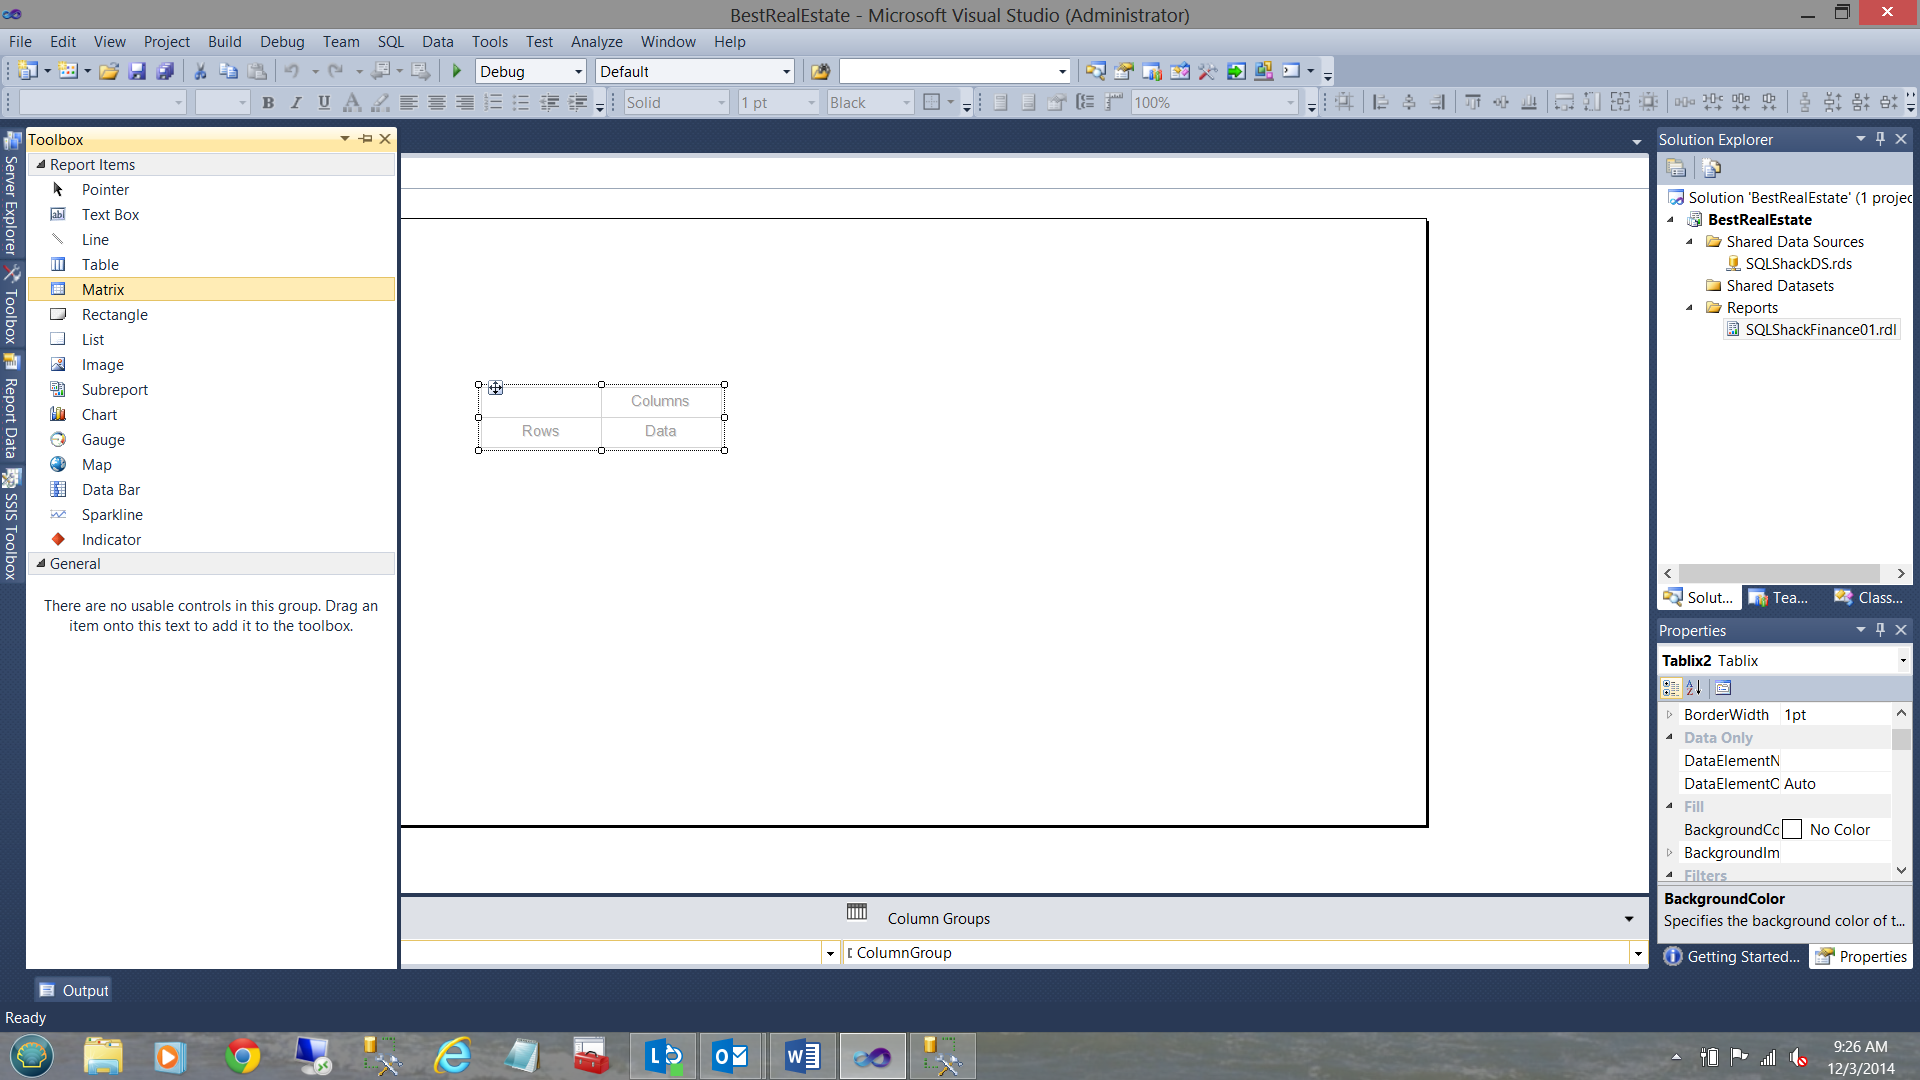
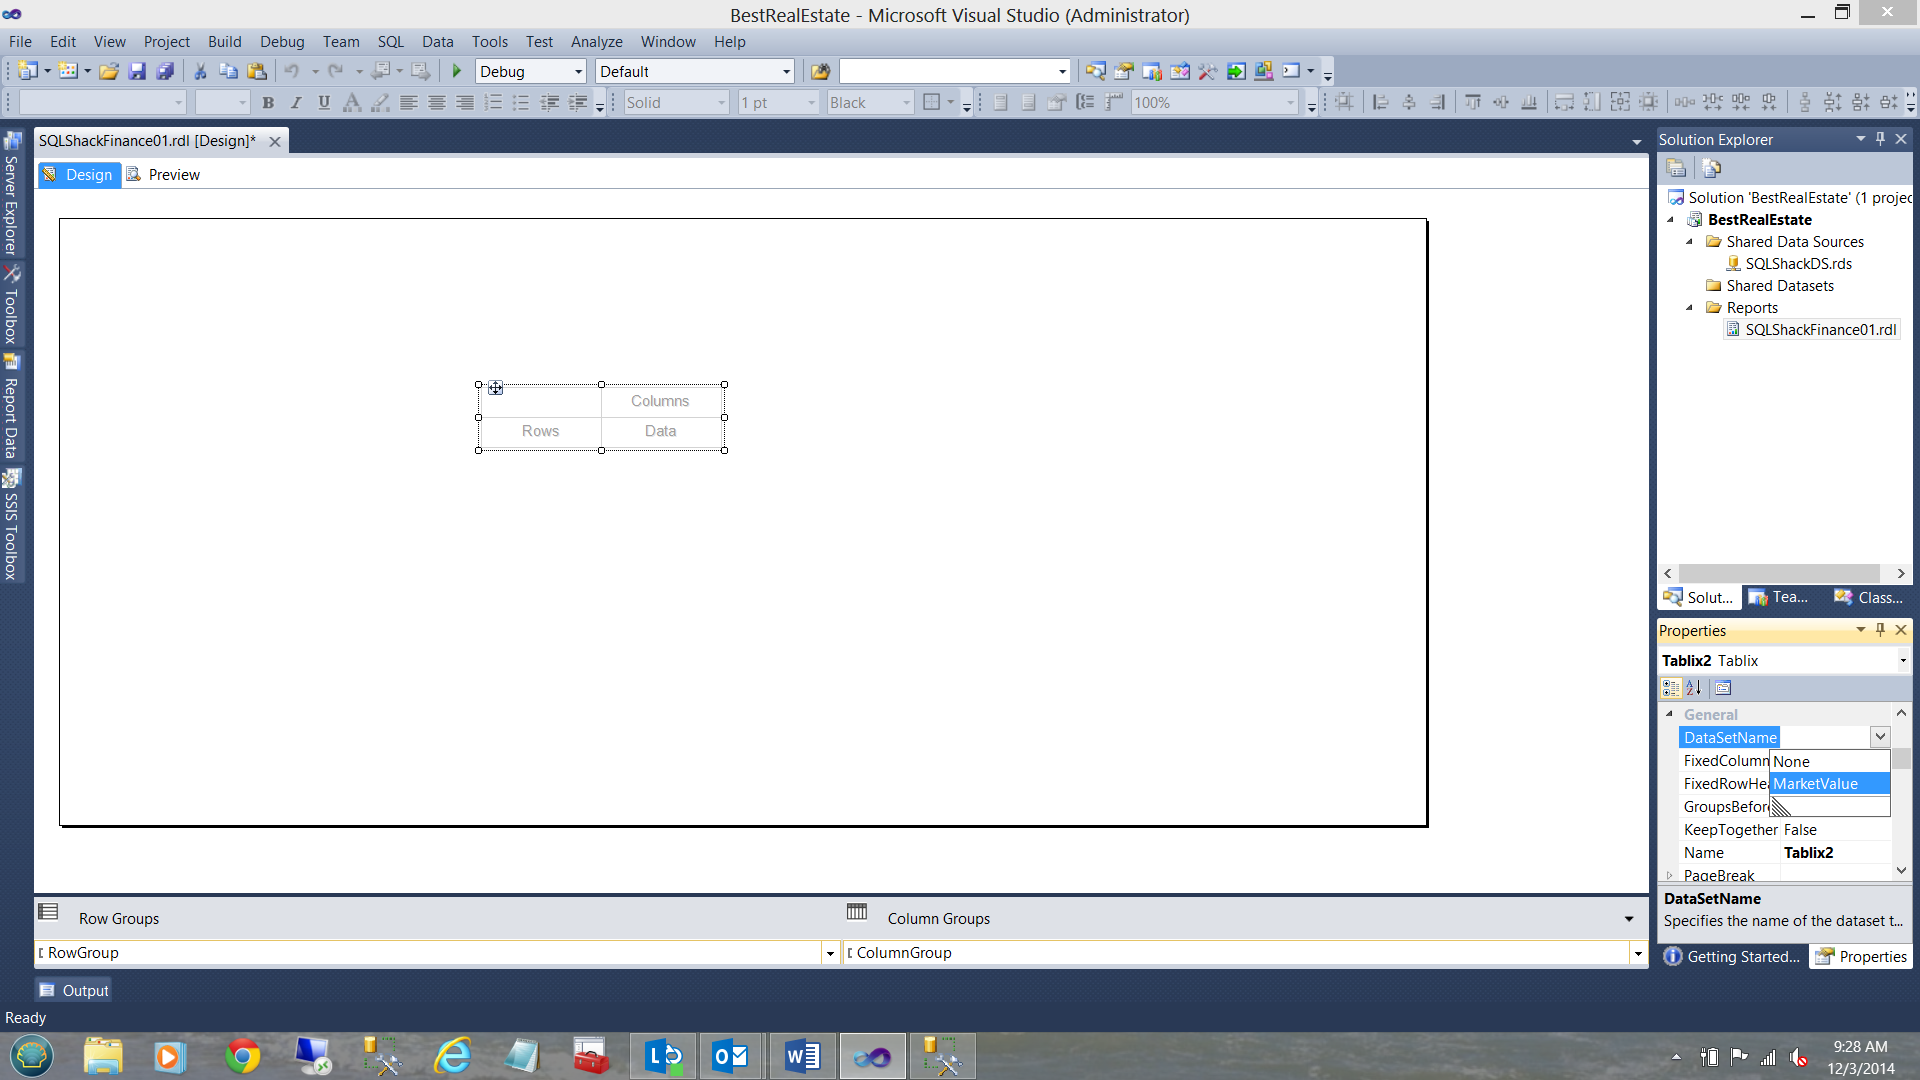
We must now set the dataset property of the matrix, to capture its source data from our dataset that we just created (see below in the lower right).
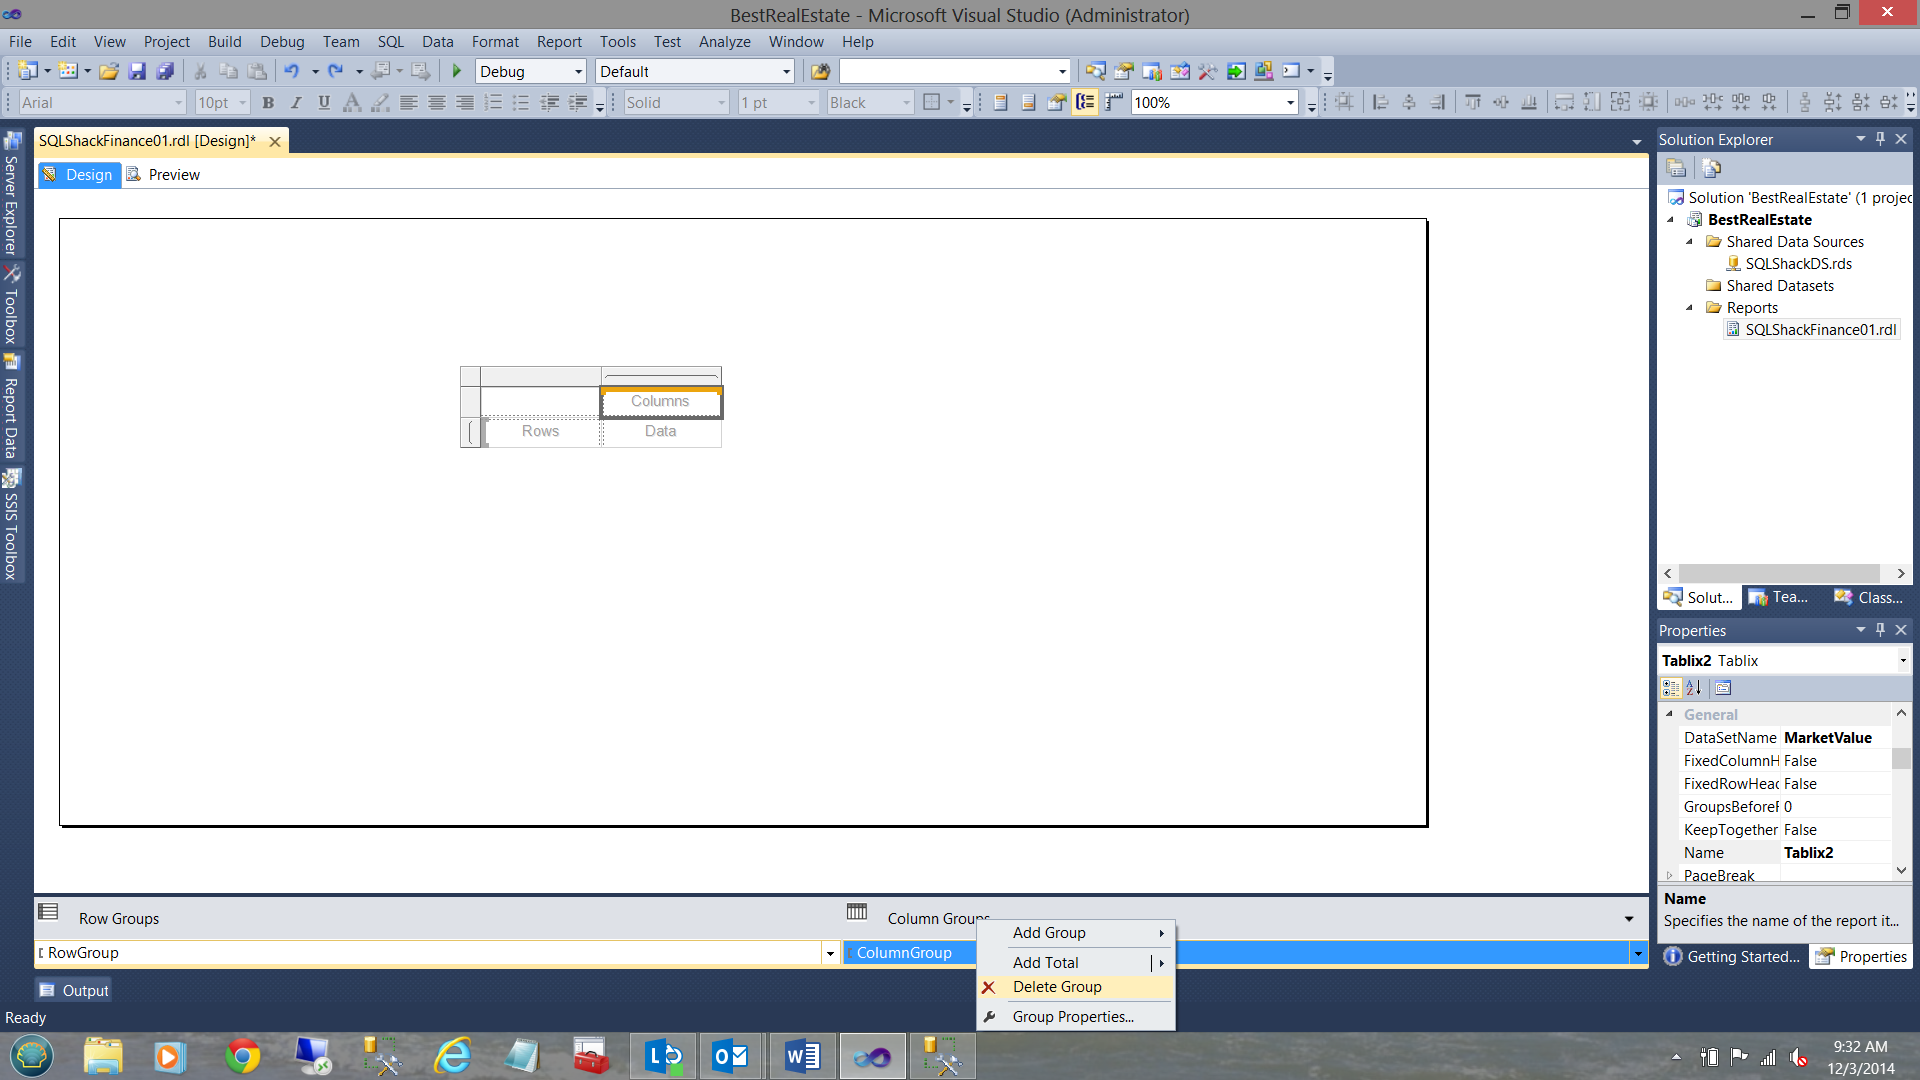
Having set the dataset property, our next task is to remove the column grouping on the matrix, as this is not required for our exercise. We right click on “Column Group” and select “Delete Group” (see below).
We are now asked whether we wish to delete the grouping including the data or merely just the grouping. We select JUST THE GROUPING i.e. “Delete group only” (see below).
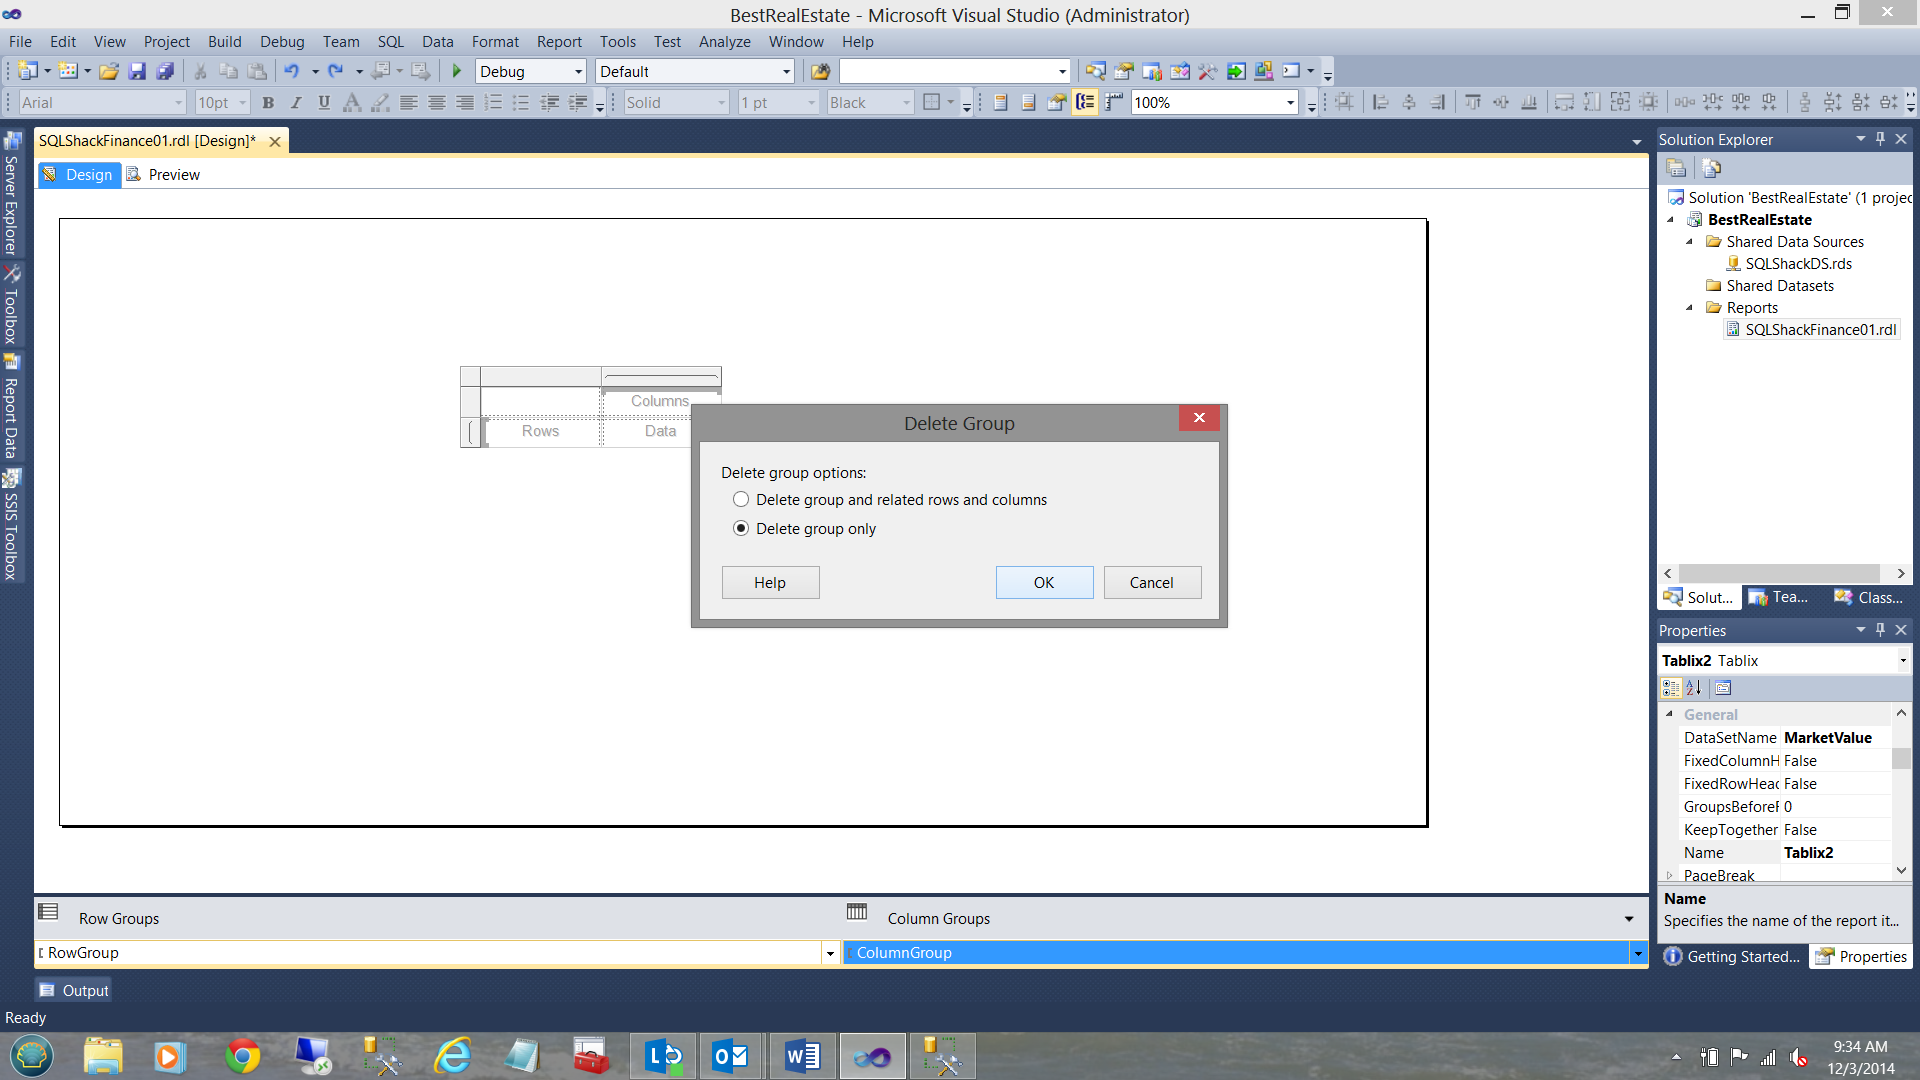
We click OK to close out of the “Delete Group” dialogue box.
The astute reader will note that our matrix has but two columns. We actually require four columns. We right click on the light grey “Columns” label within the header of the matrix (see above) and add two columns to the right of THAT column (see below).
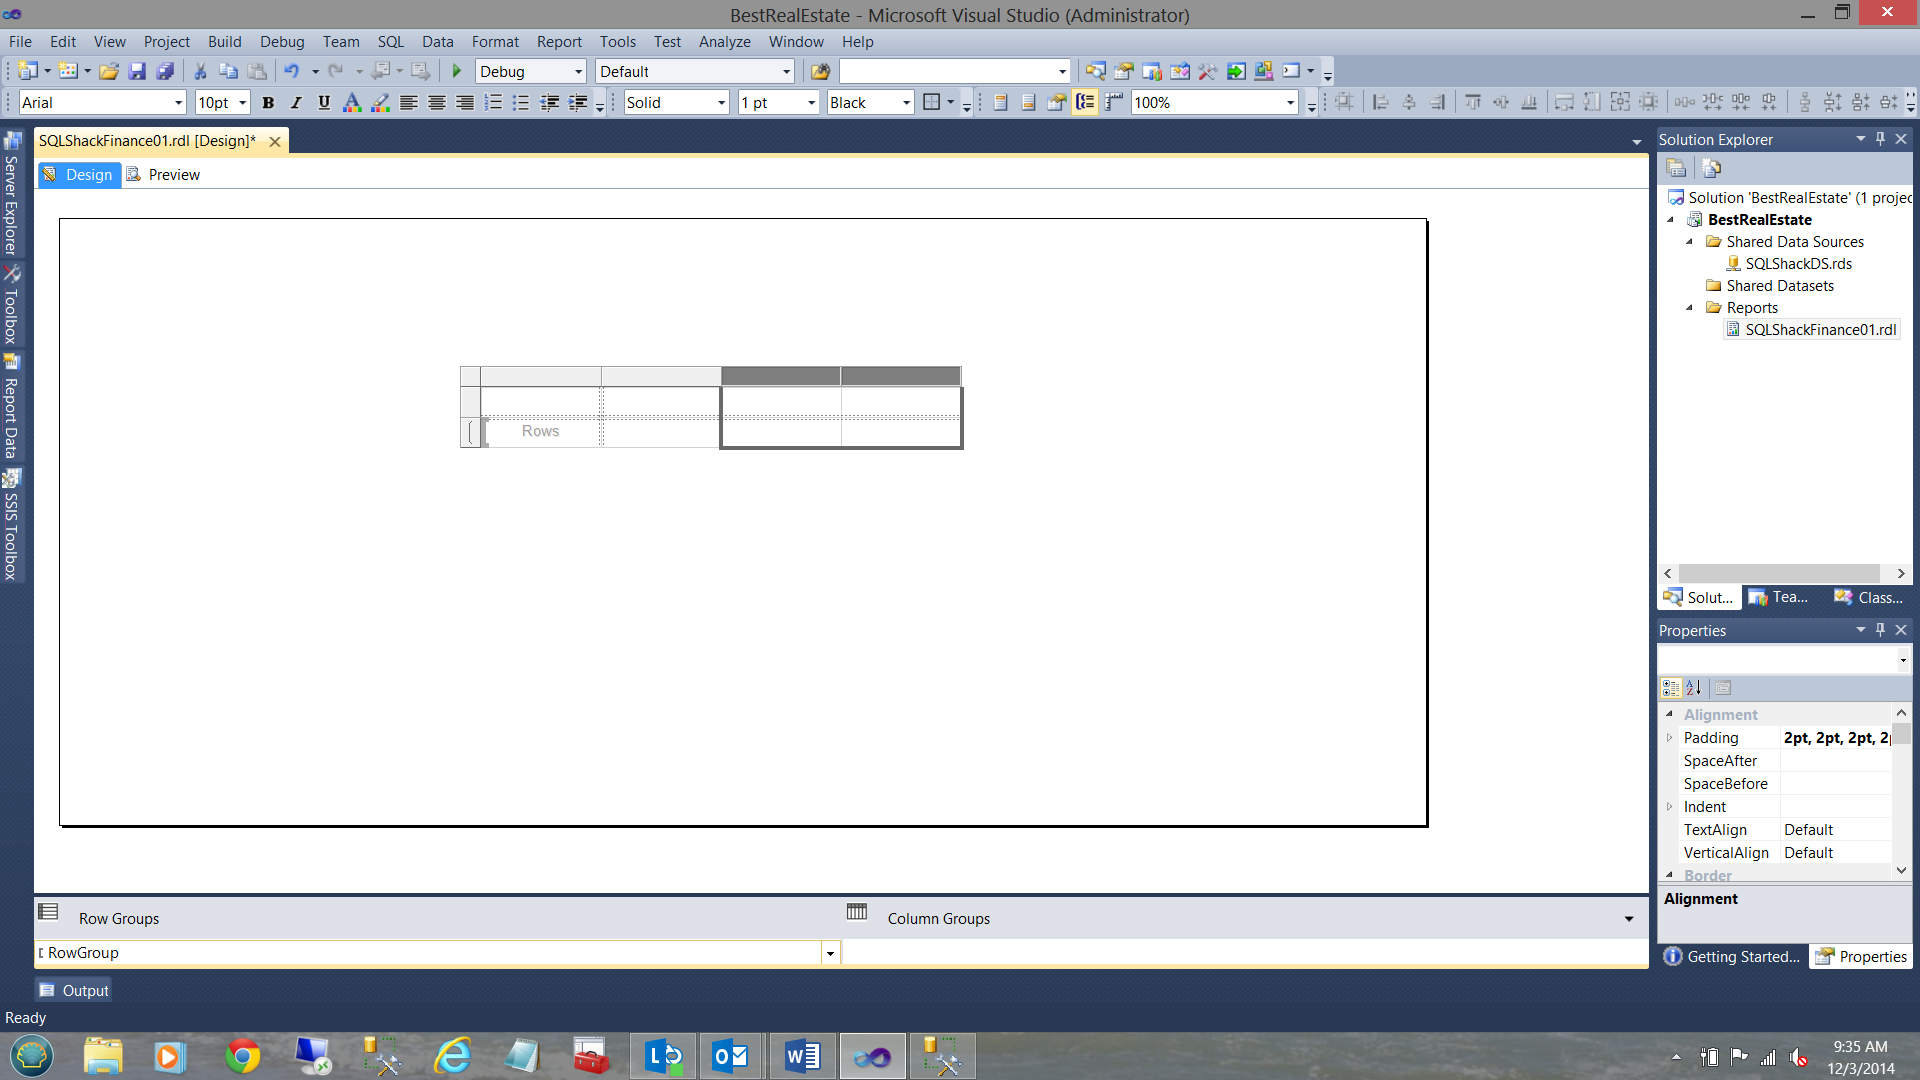
We now populate the columns with the fields from the dataset (see below).
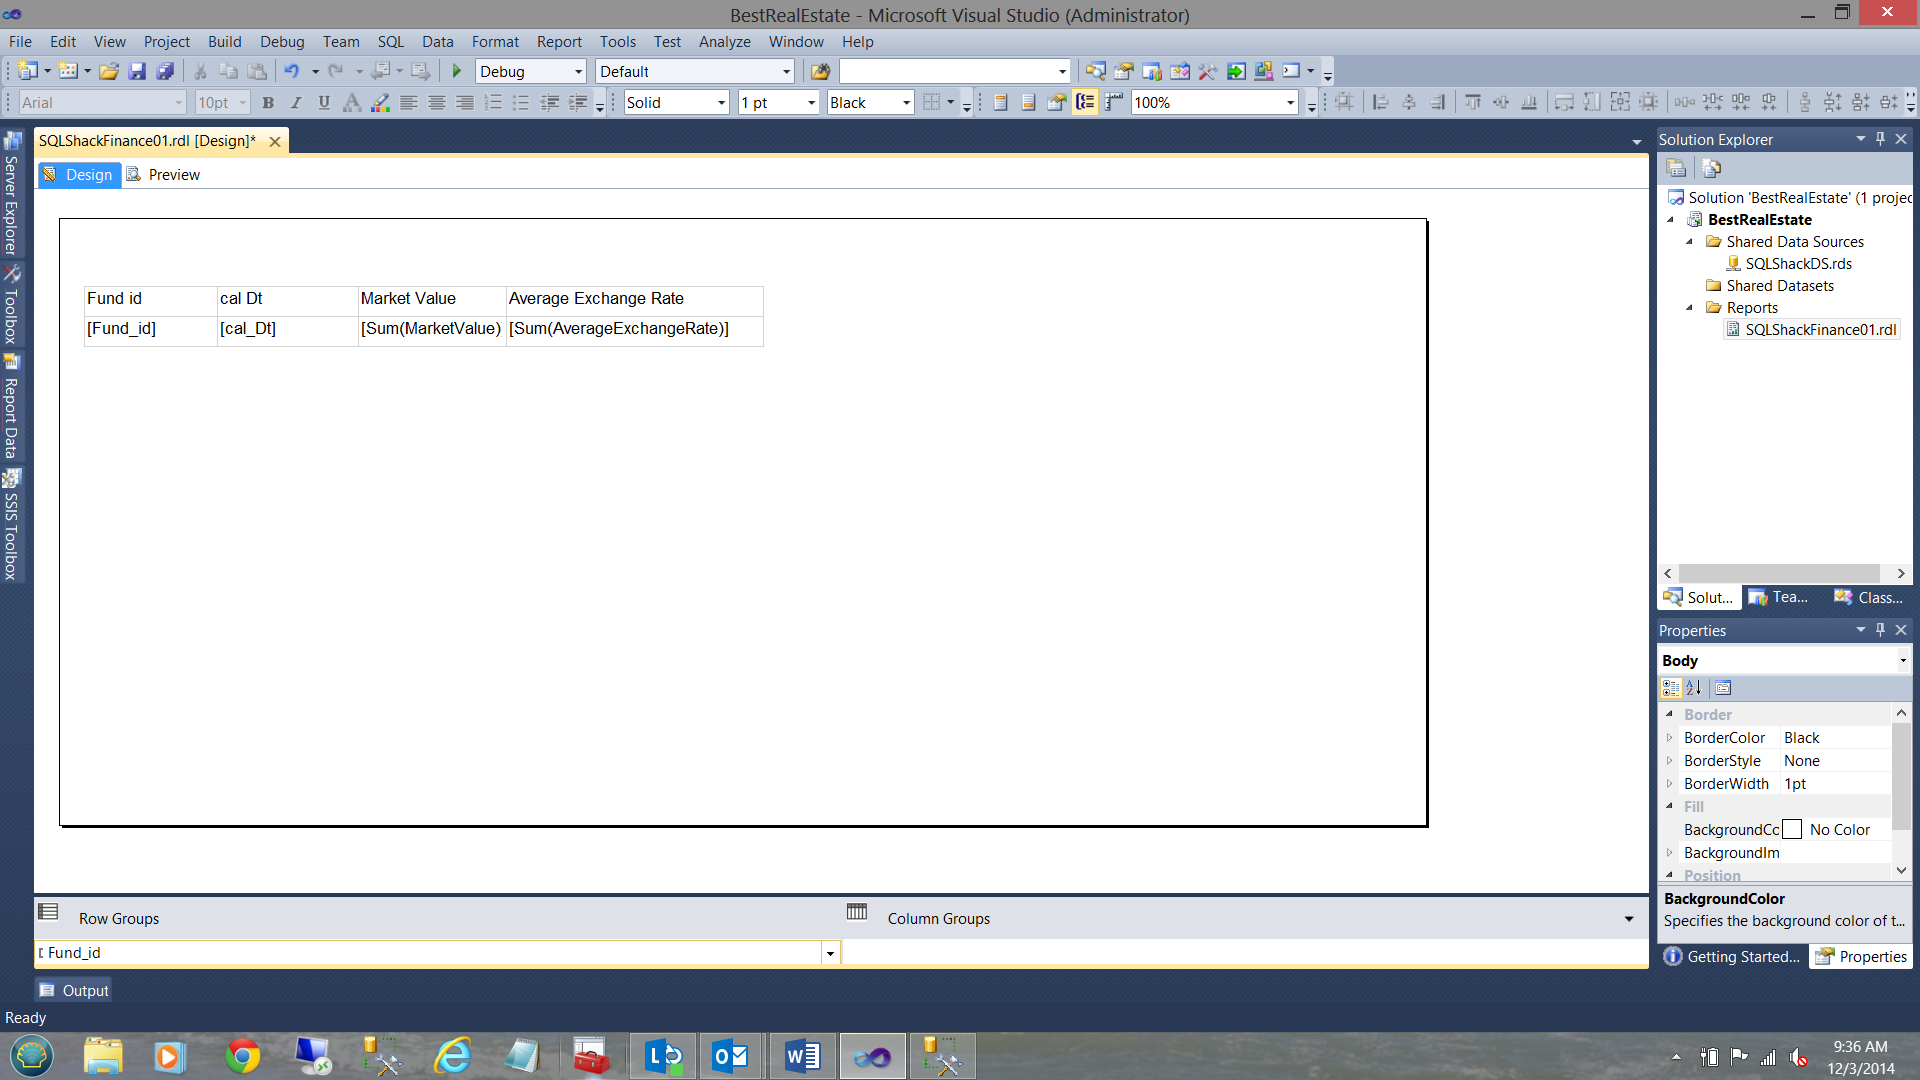
Note that the top row is used as the report column header. I always choose to rename these headers as they are not very ‘pleasing’ to the eye (see below).
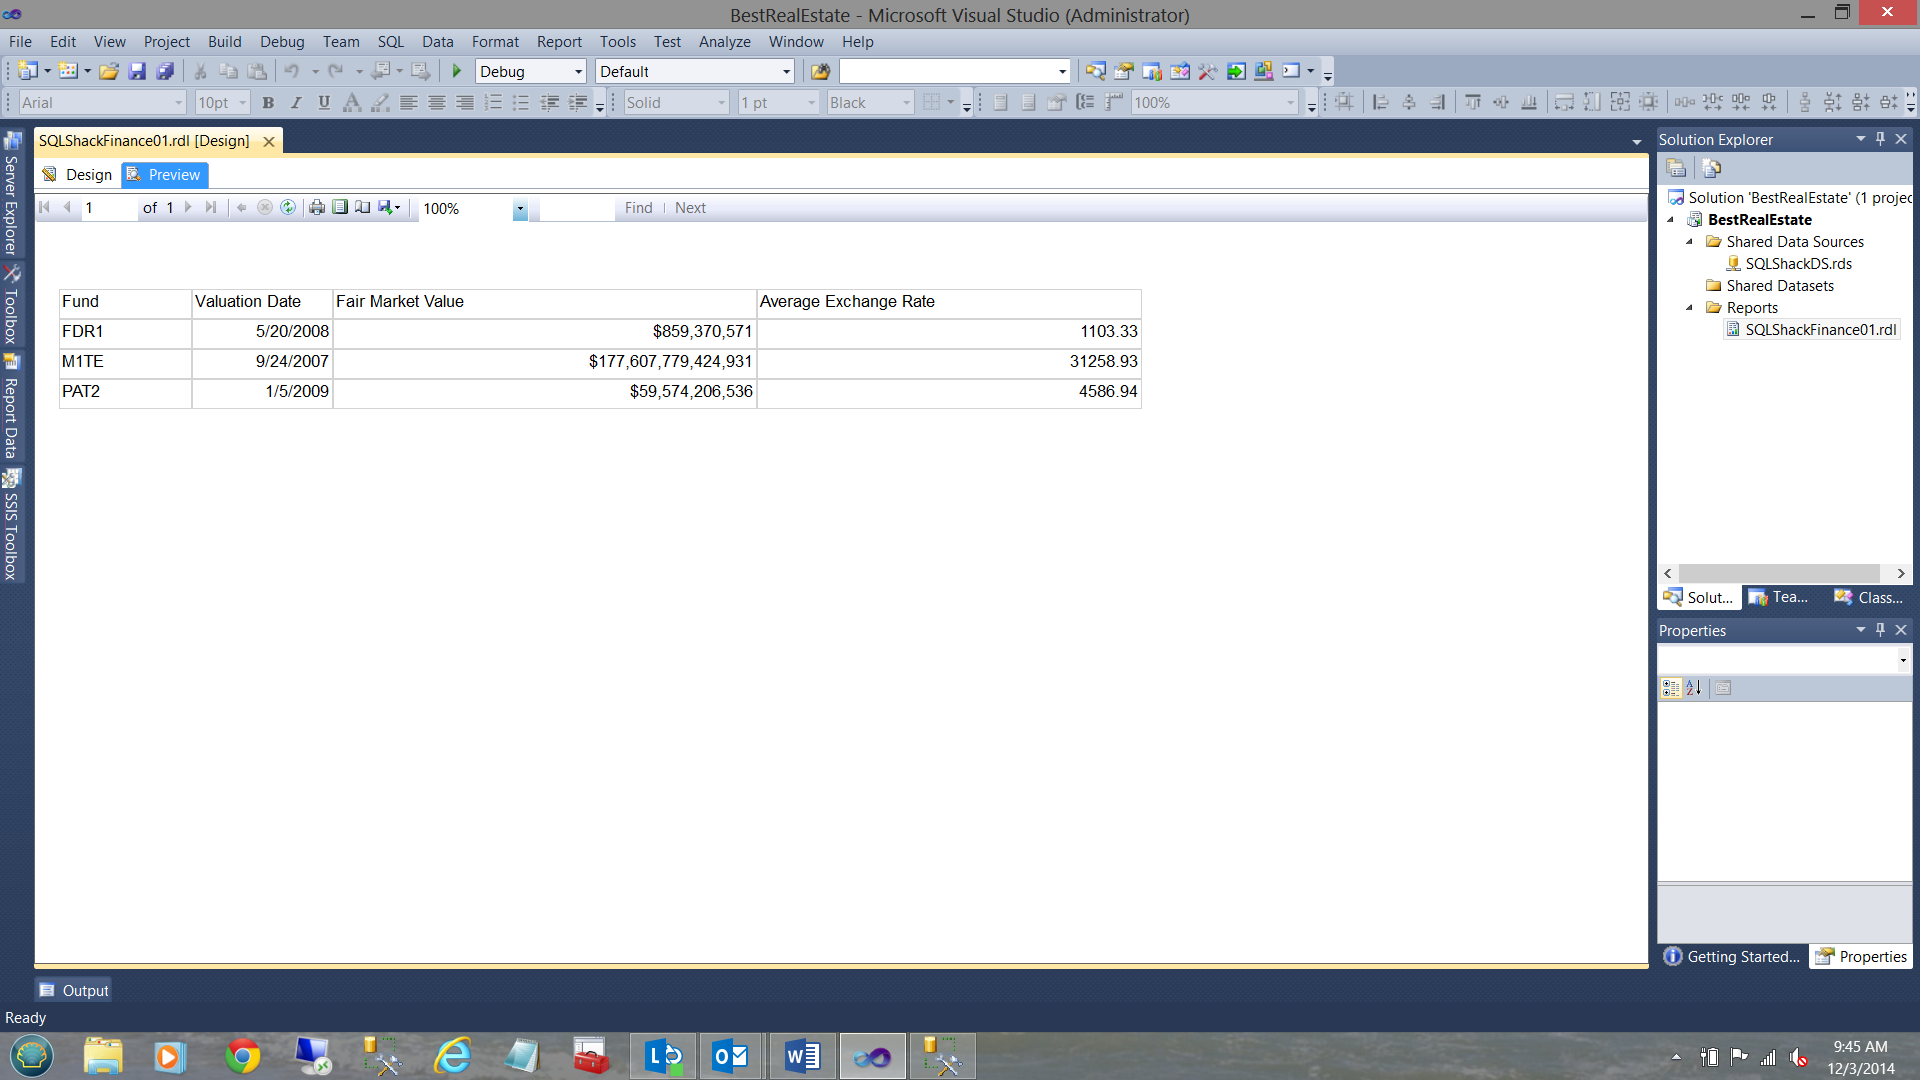
This done, let us see what we have produced. We click “Preview” from the report designer.
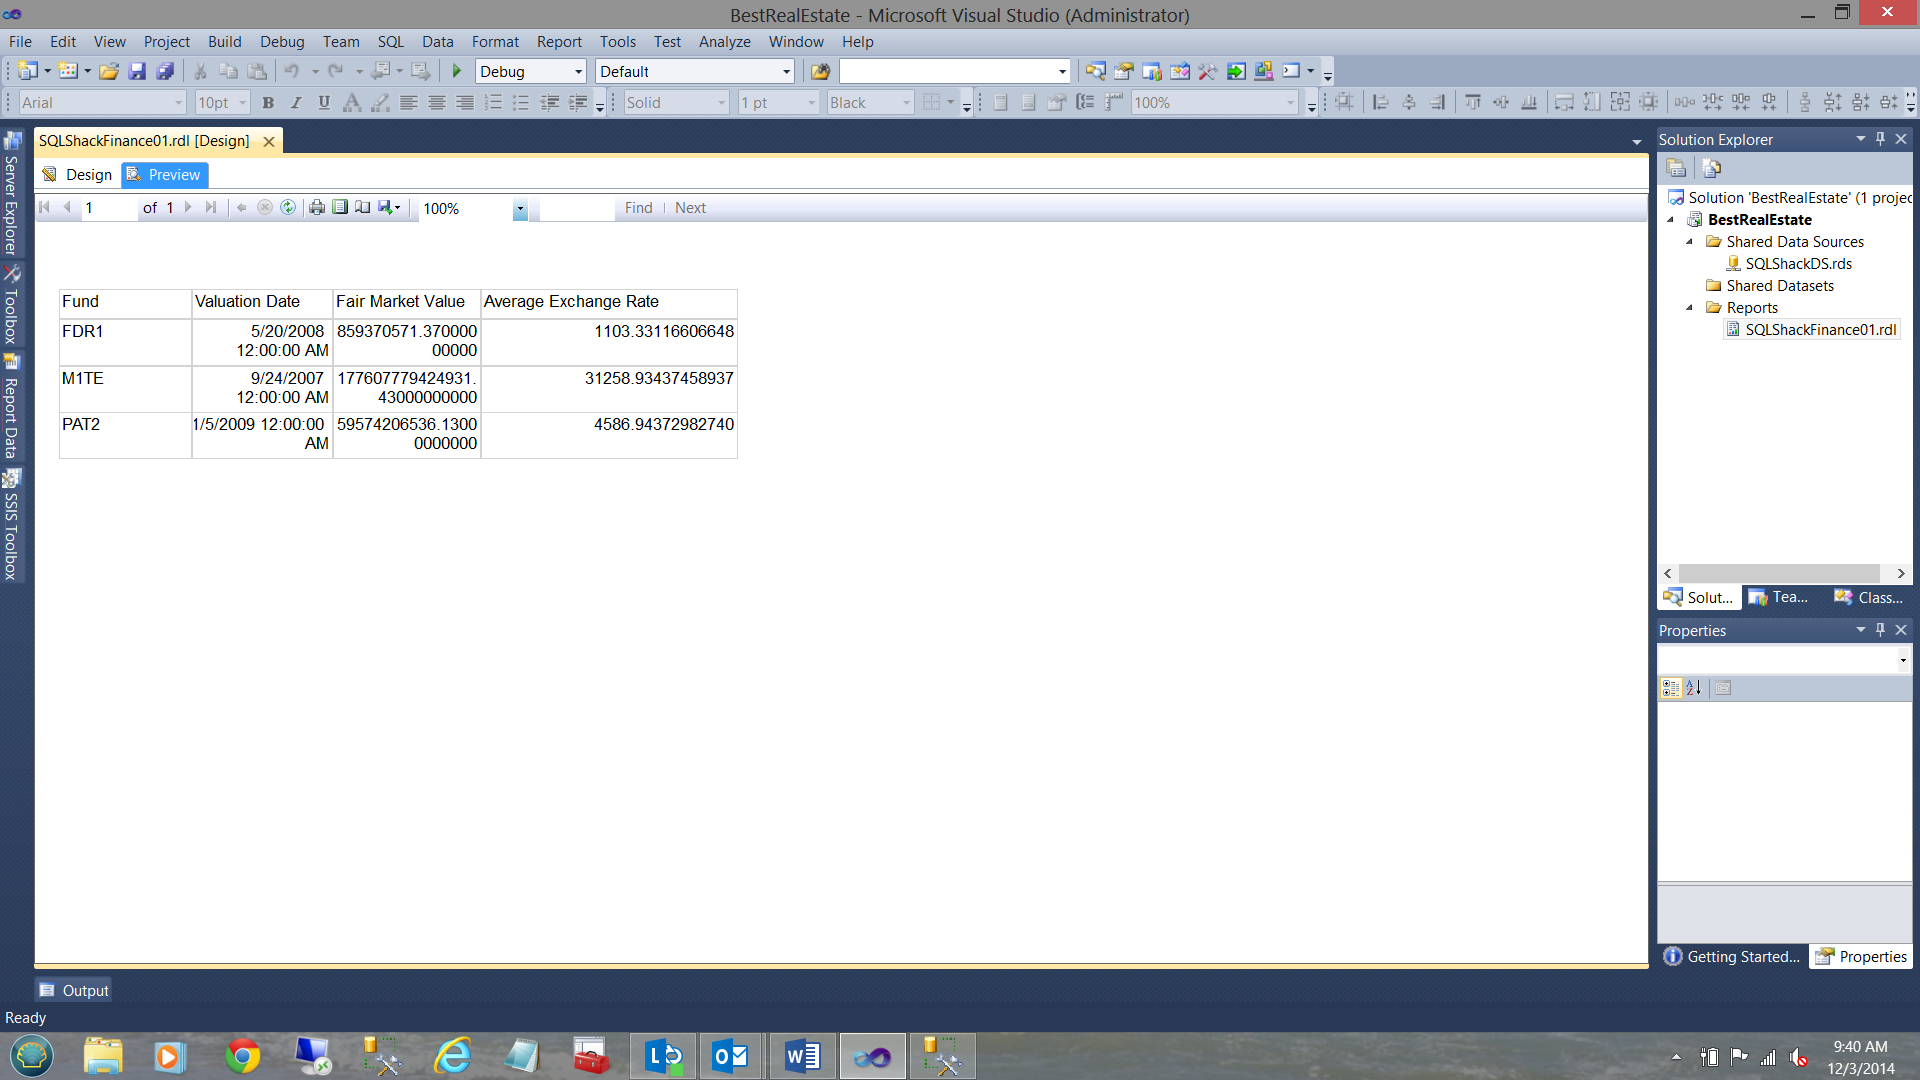
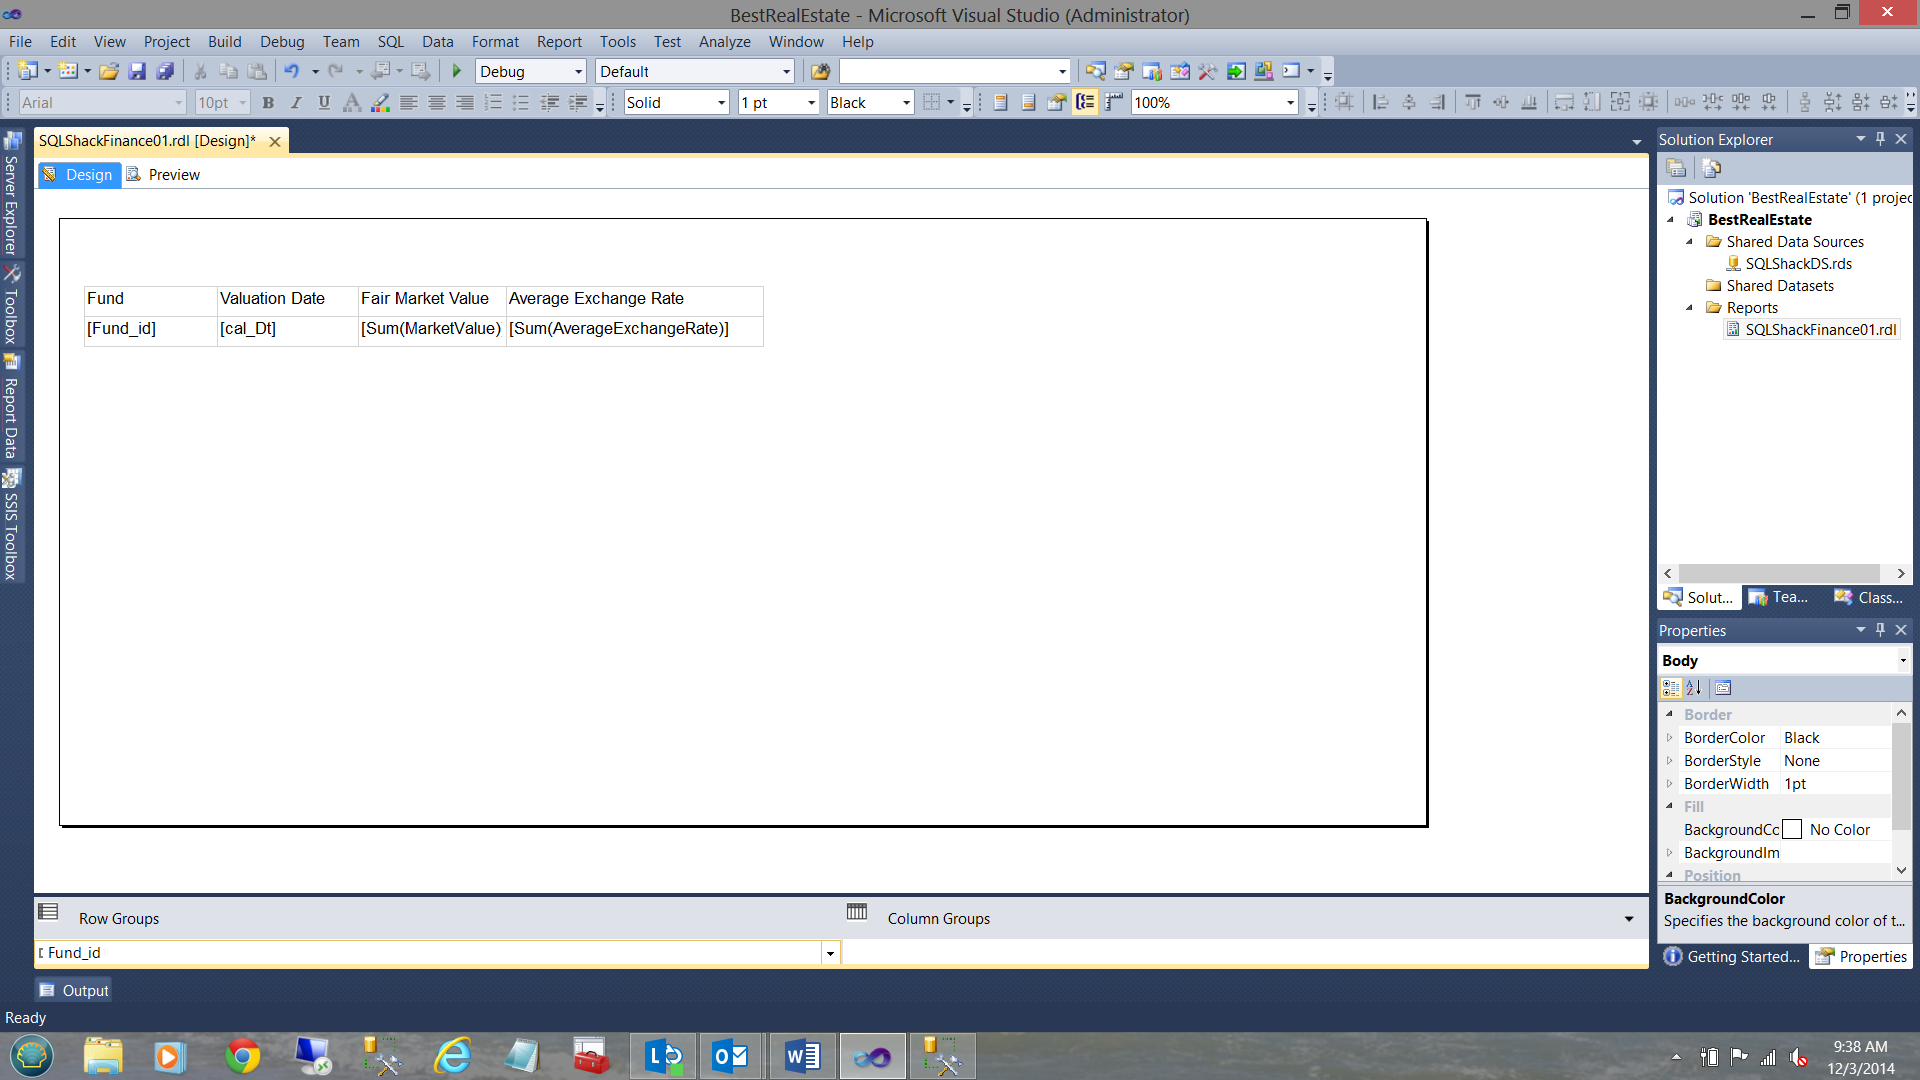
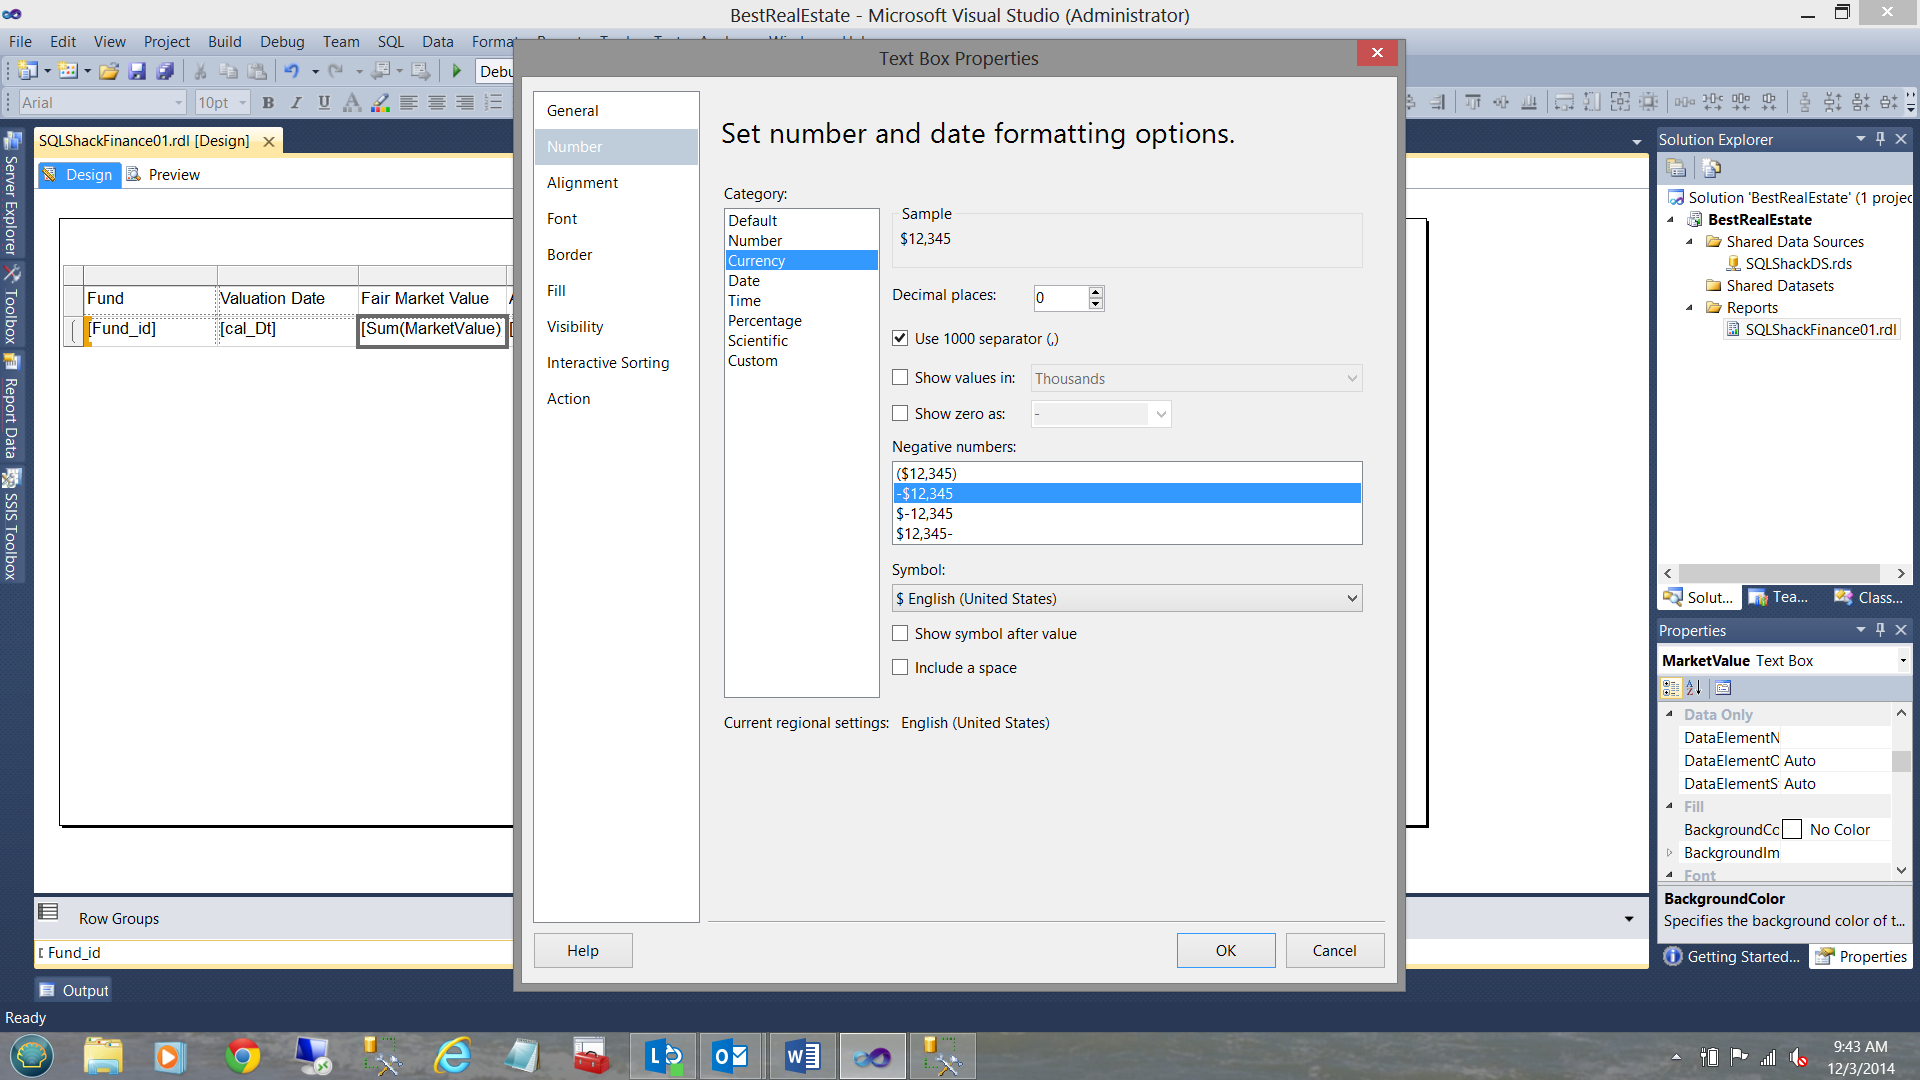
Our data may be seen above. The format however leaves much to be desired. By clicking in each of the field boxes (within design mode), we are able to change the format.
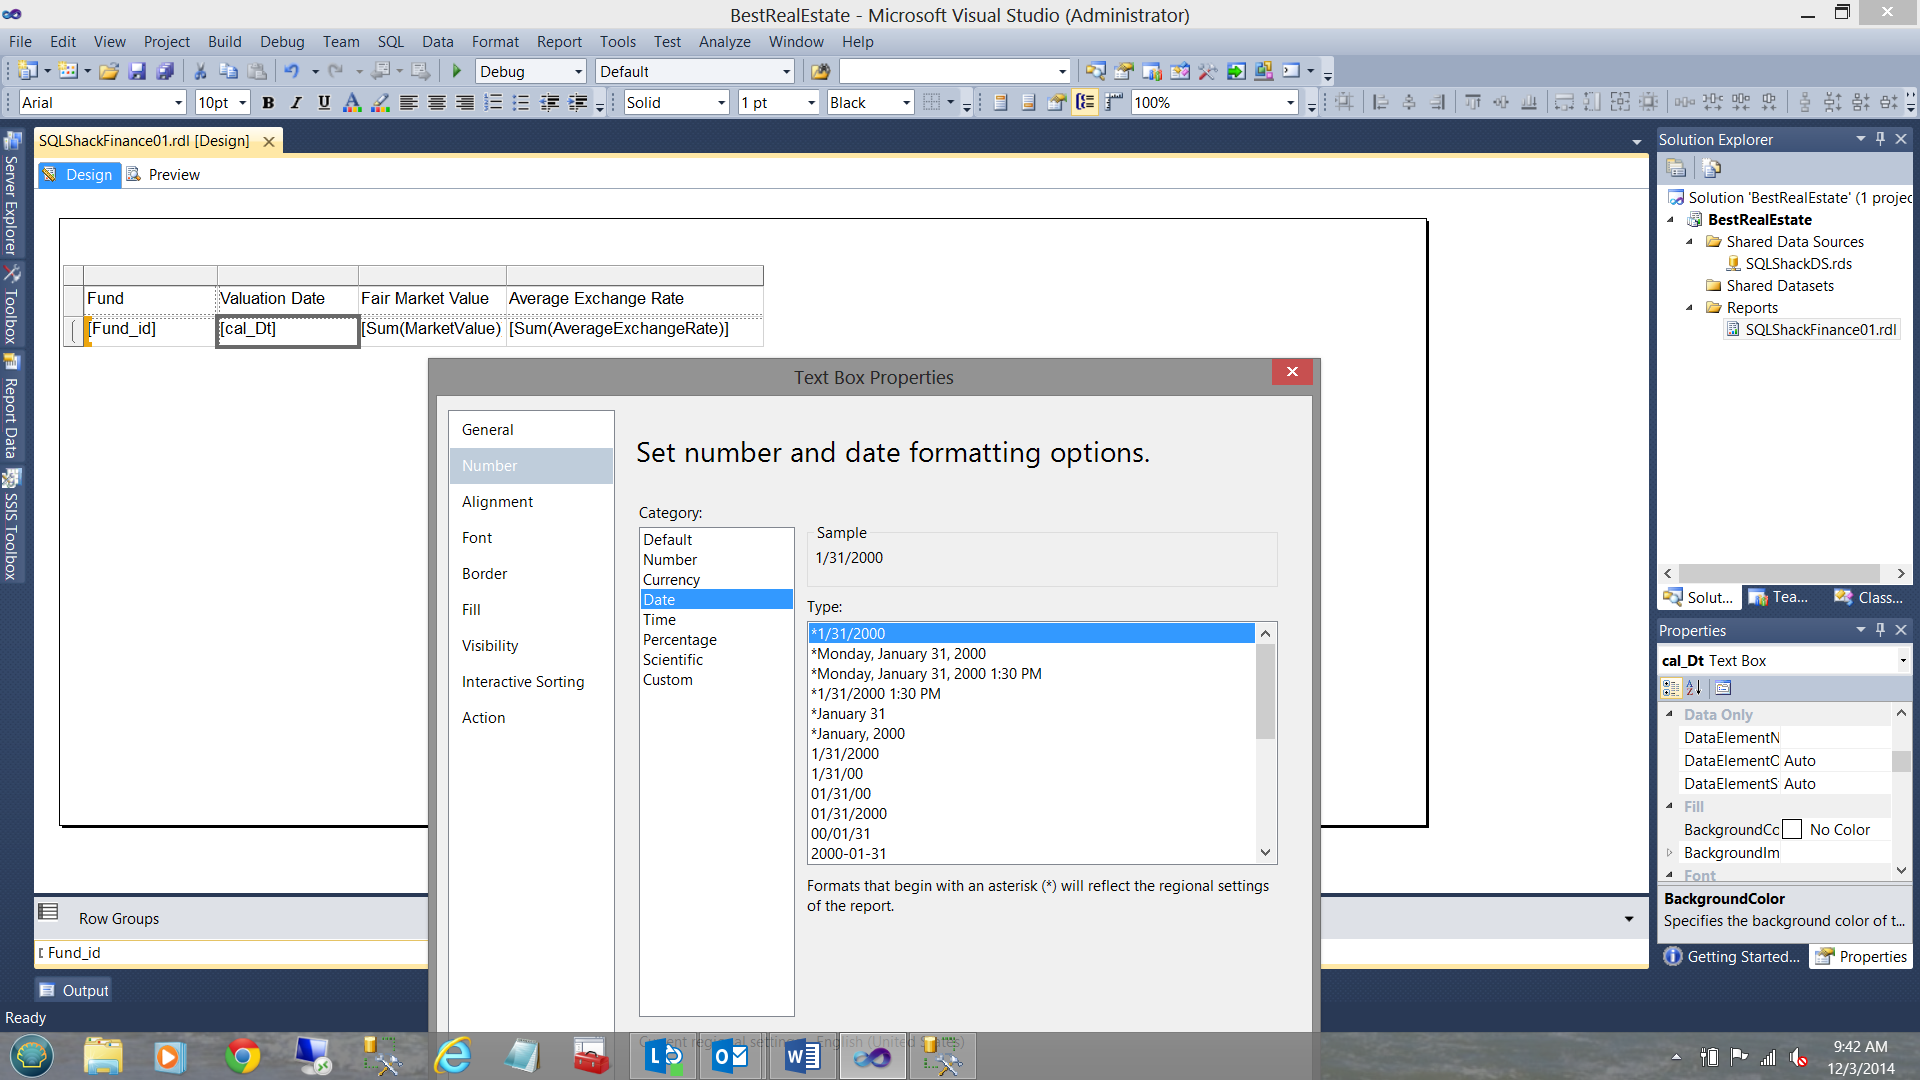
Date is being changed above. Currency is changed below.
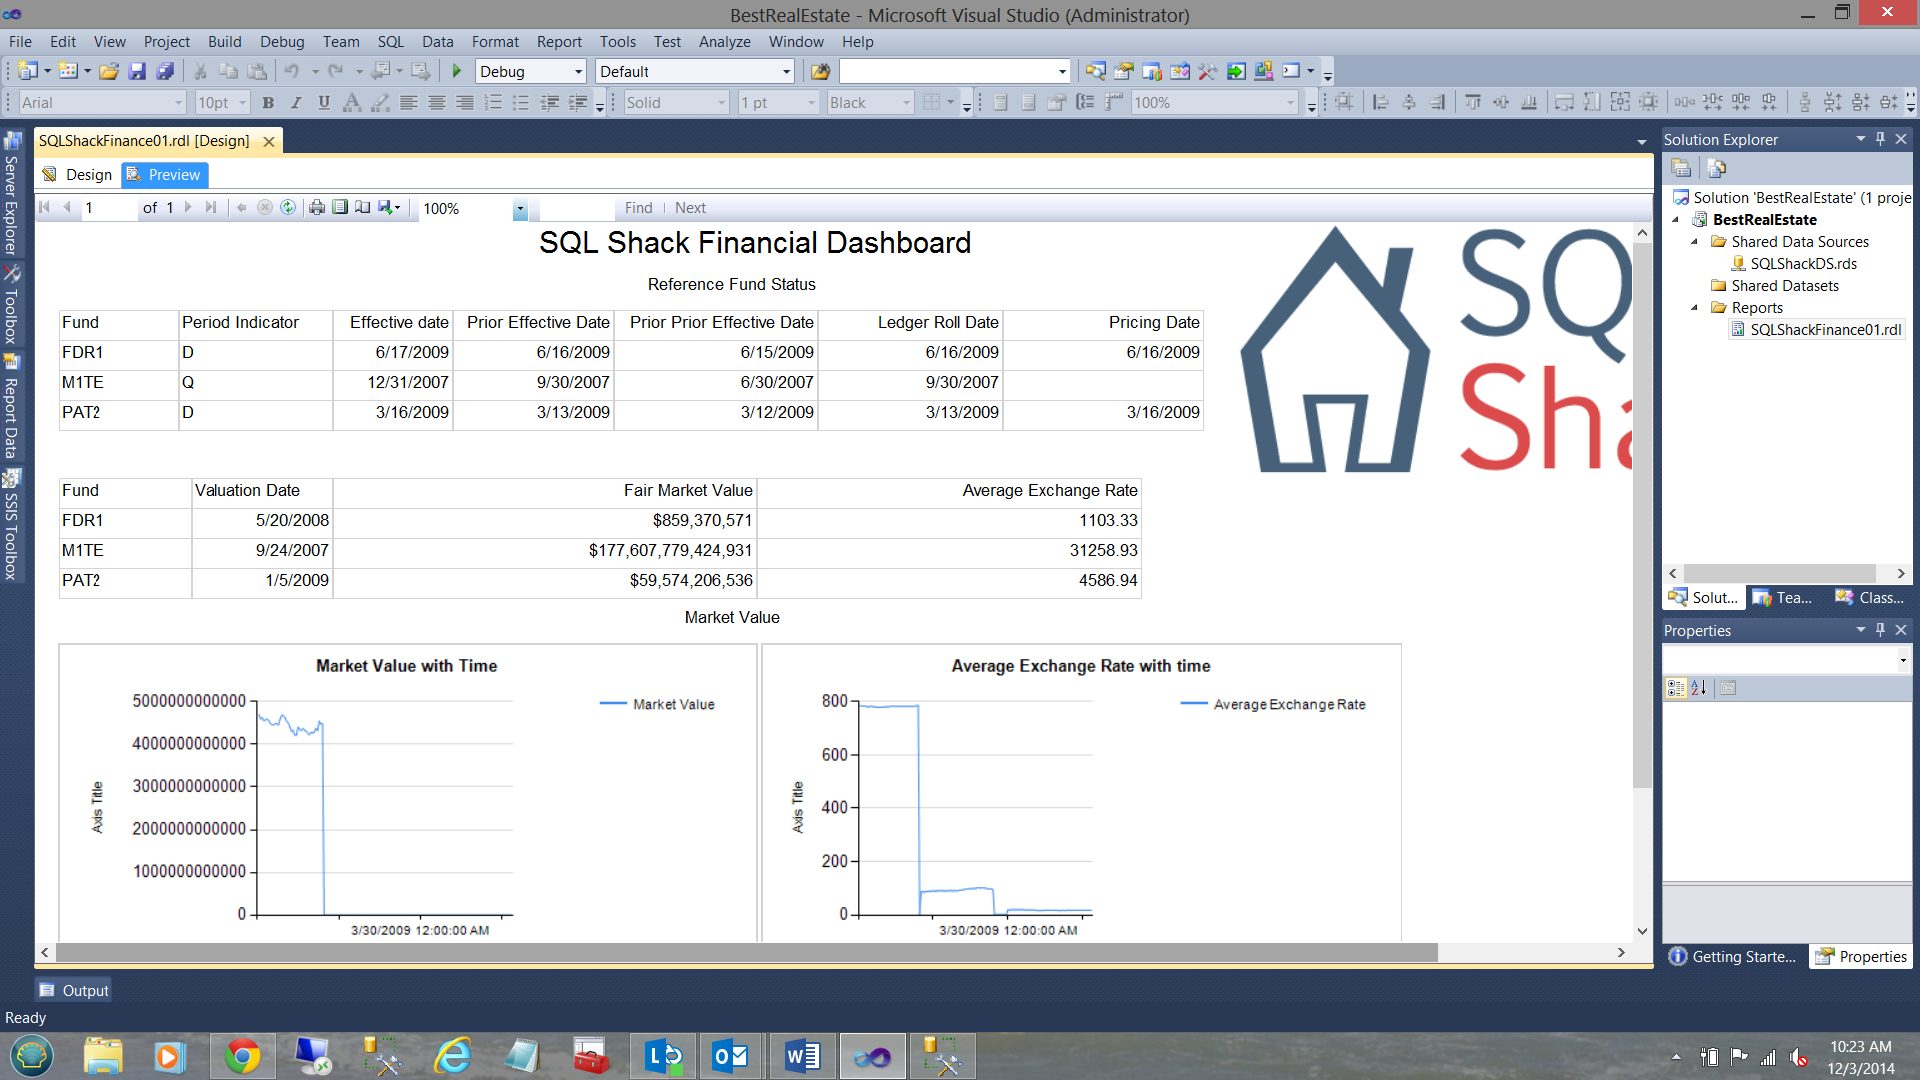
In a similar manner we change to appearance of the Average Exchange Rate. Our final matrix is similar to the one shown below:
In a similar fashion, it is left up to the reader to:
Create the “SQLShackFinancialReferenceFundStatus” stored procedure
12345678910111213141516USE [SQLShackFinancial]GO/****** Object: StoredProcedure [dbo].[SQLShackFinancialReferenceFundStatus12/4/2014 9:25:00 AM ******/SET ANSI_NULLS ONGOSET QUOTED_IDENTIFIER ONGOcreate procedure [dbo].[SQLShackFinancialReferenceFundStatus]asSELECT * from [dbo].[REF_FUND_STATUS]GOCreate the necessary dataset utilizing the local data source that we created above and linking that data source to the shared data source “SQLShackDS”.
Adding more data to our report
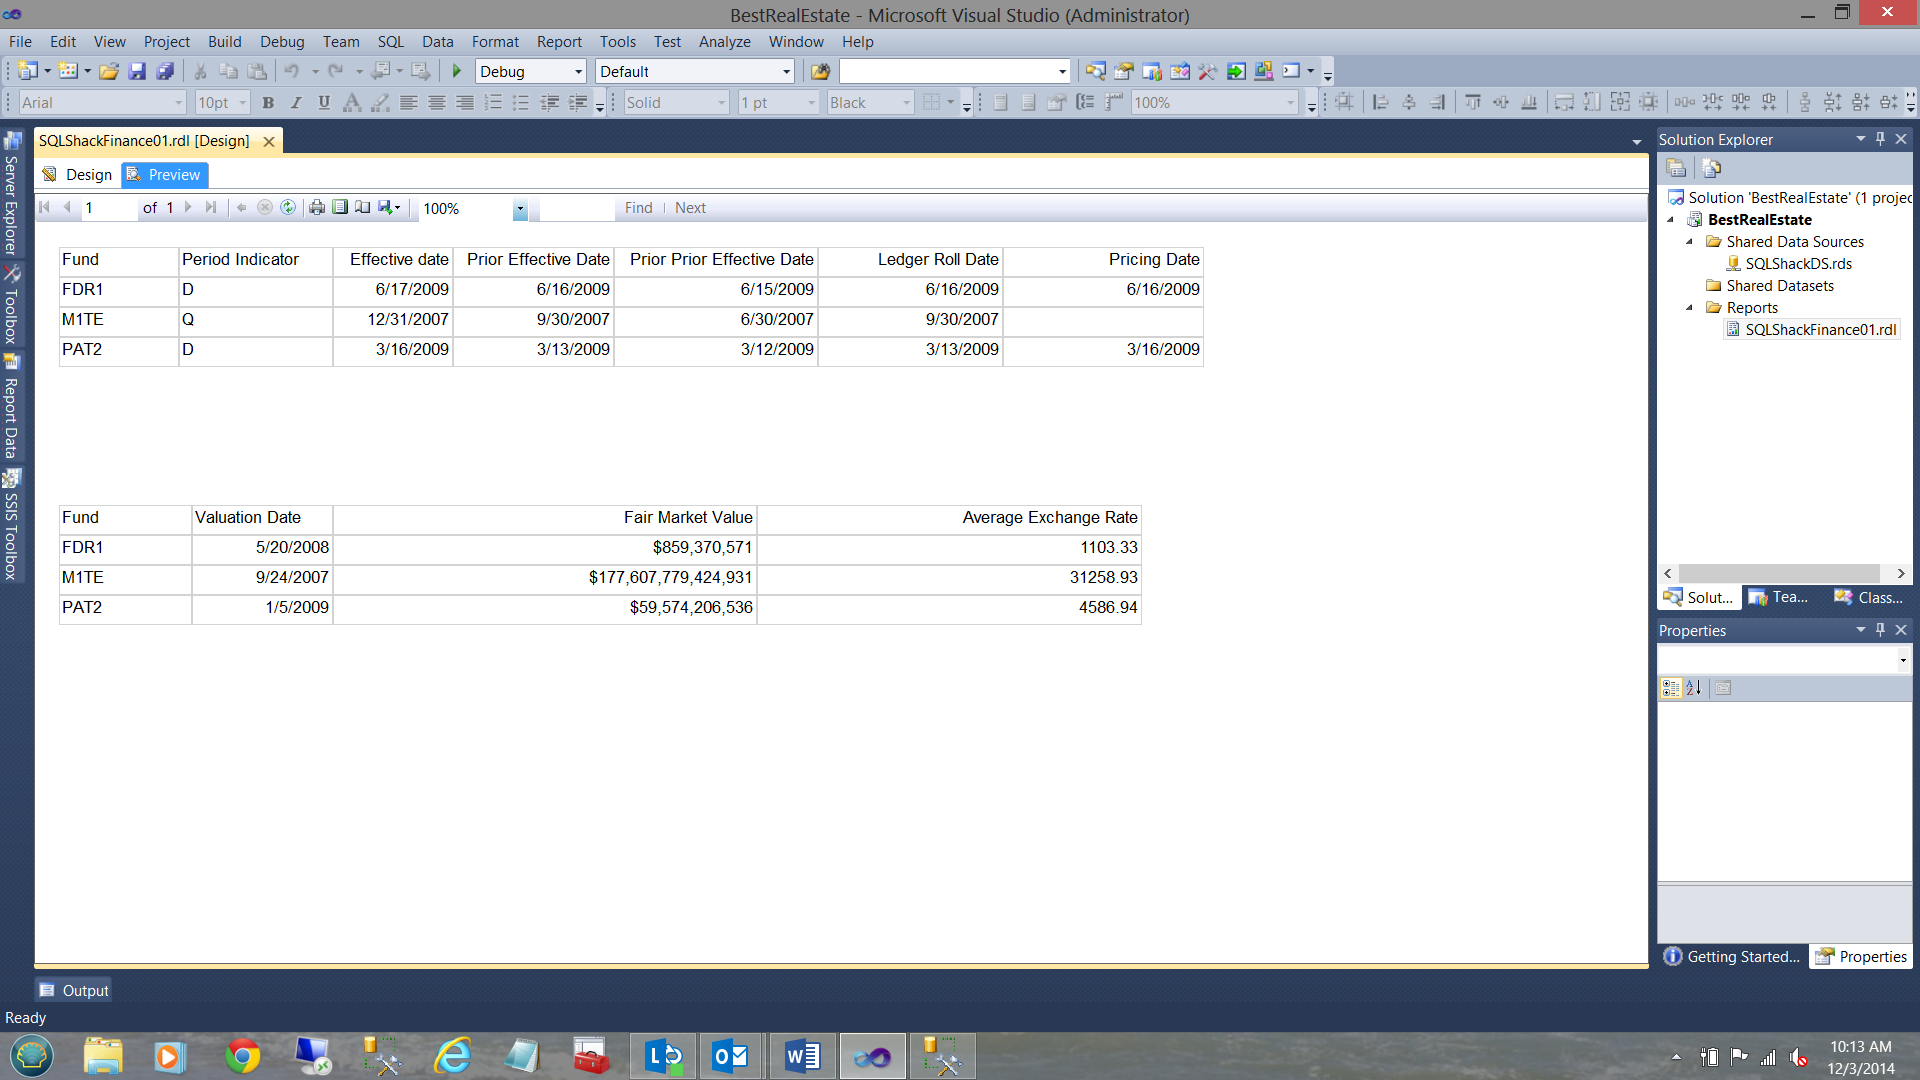
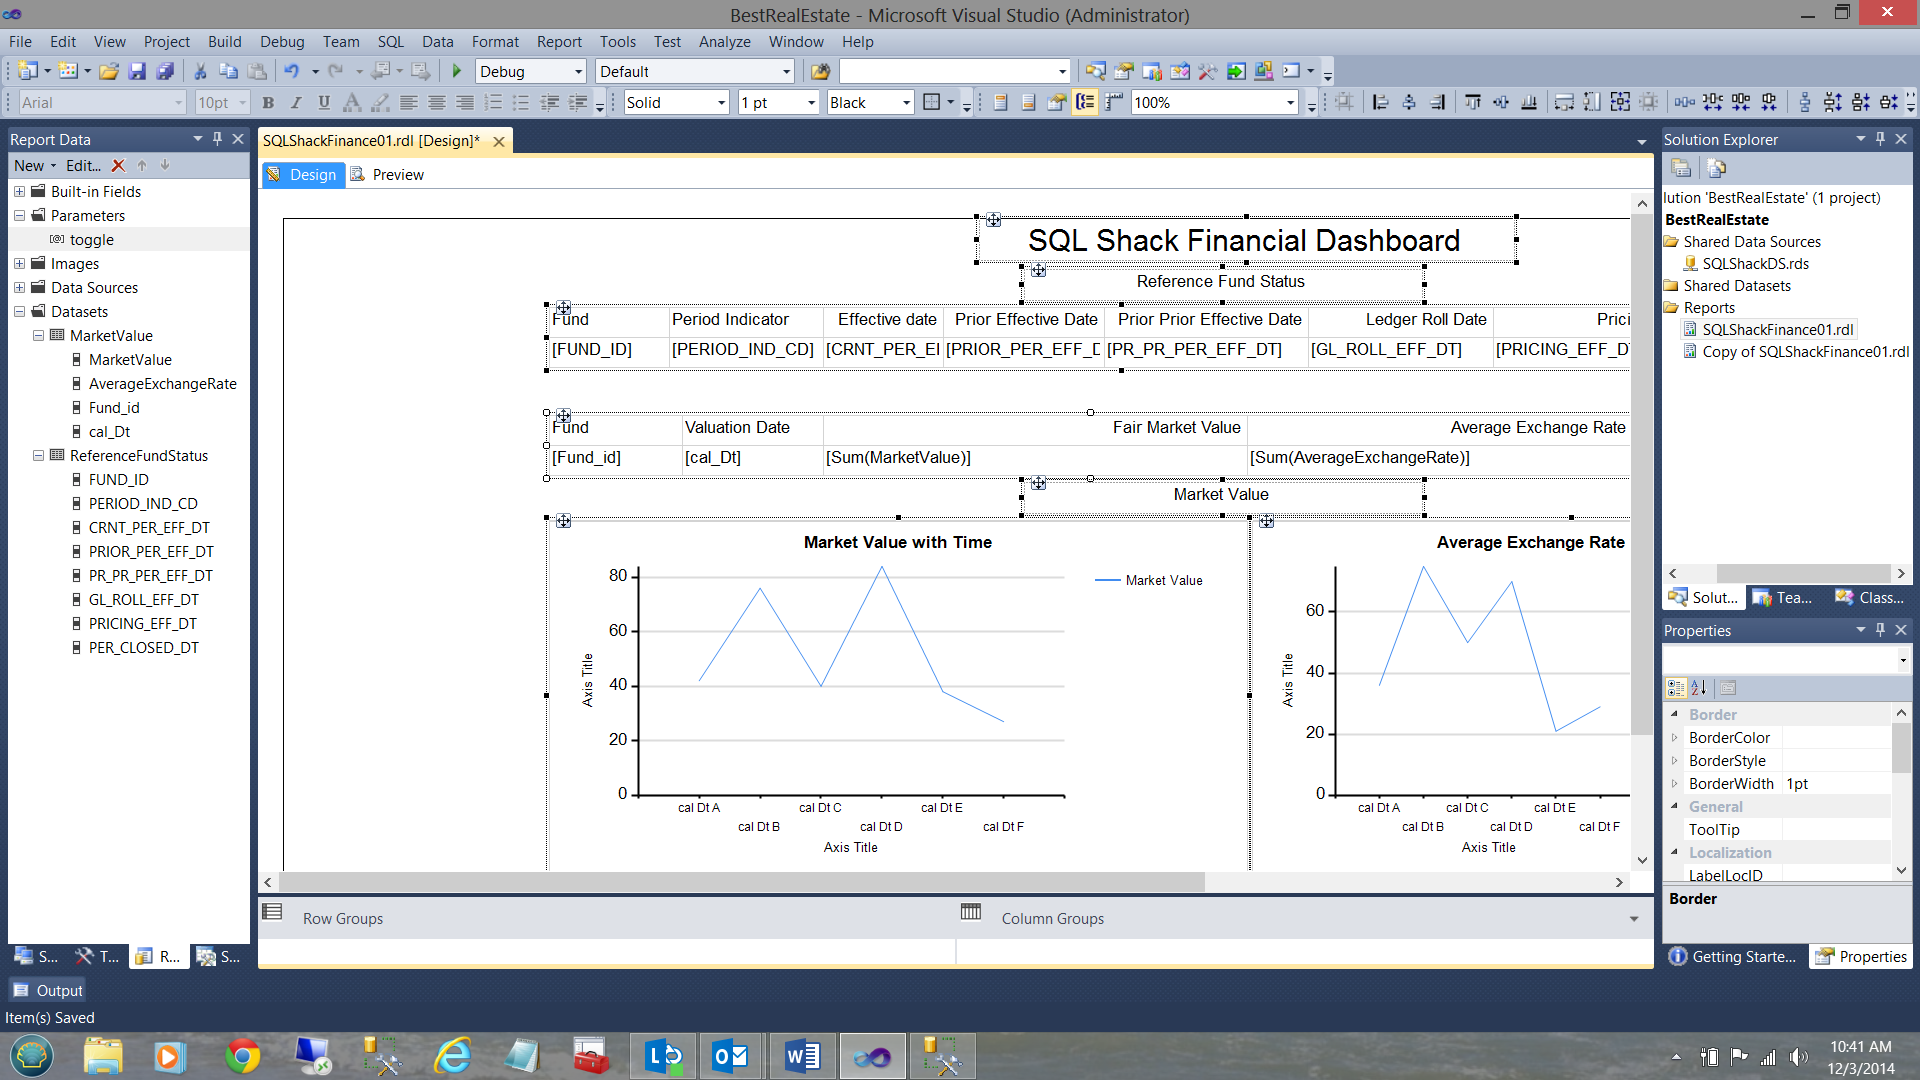
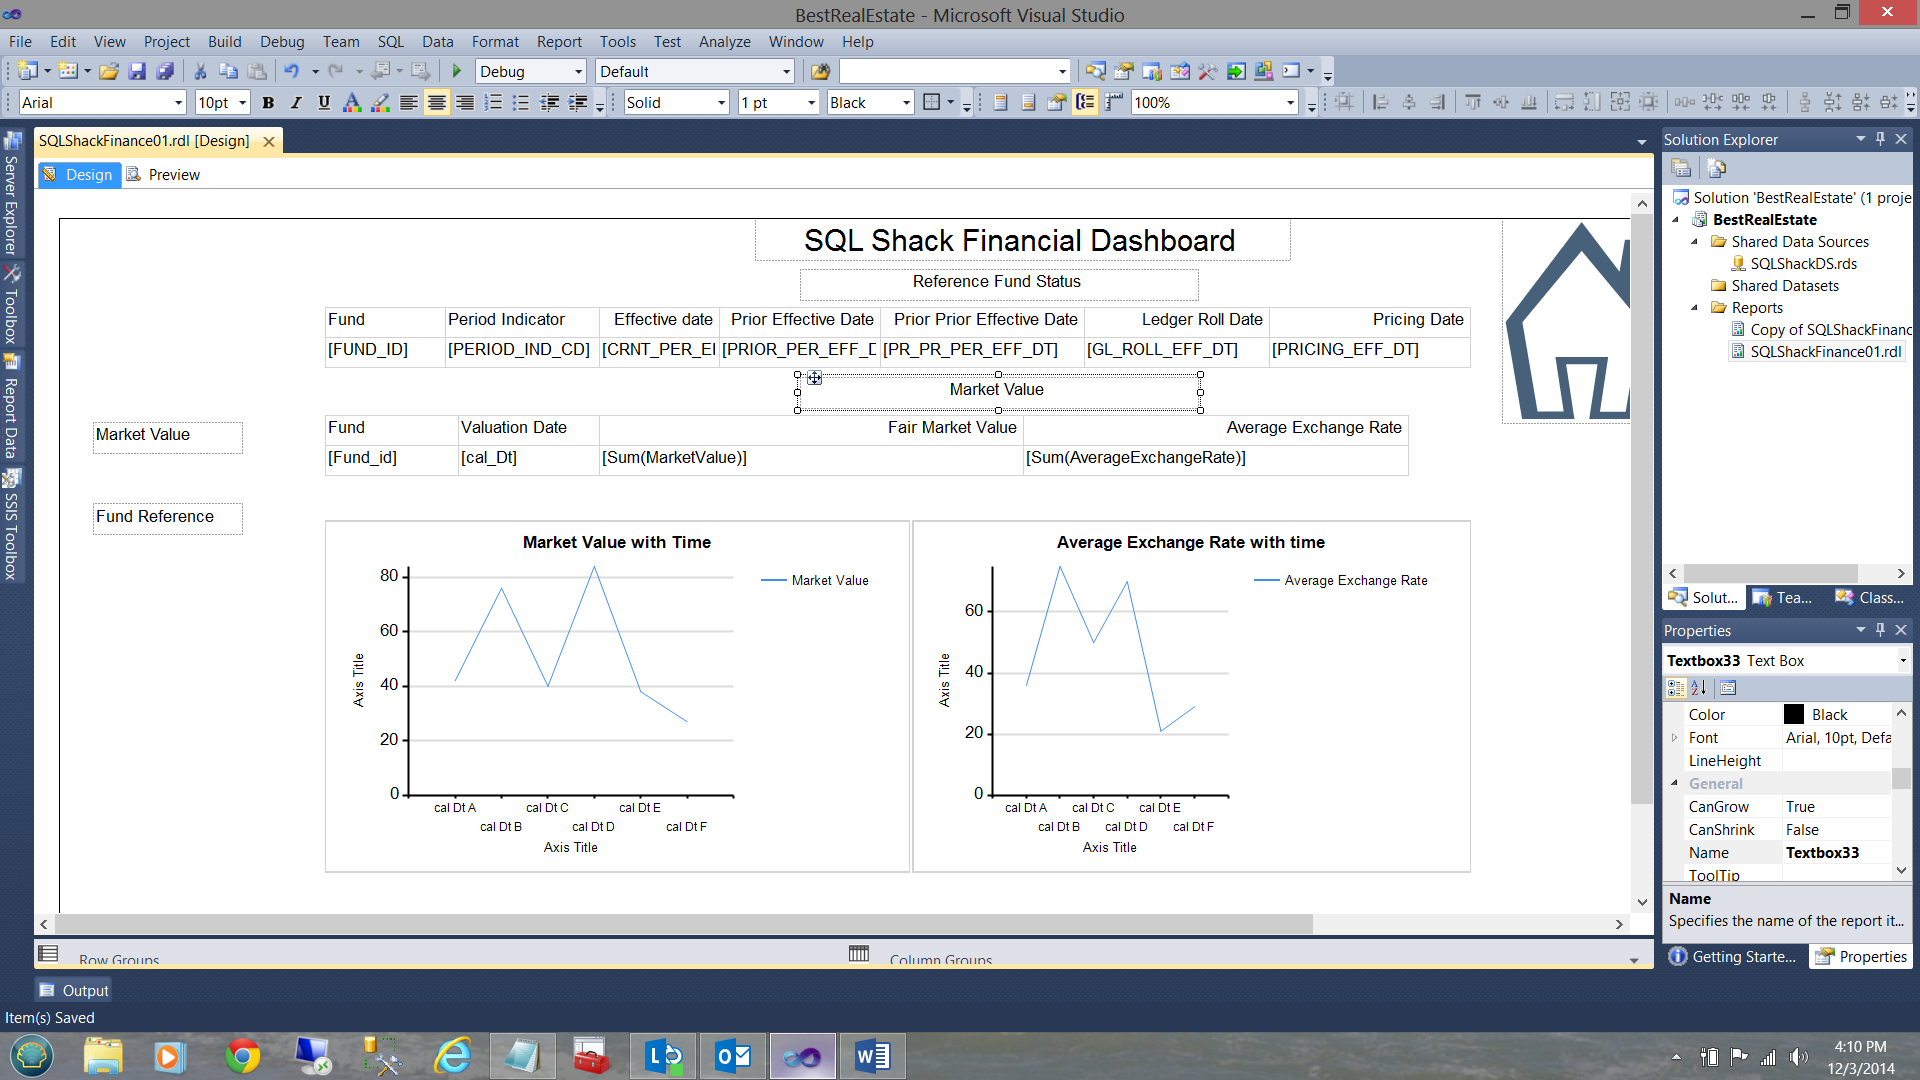
In a similar manner to that which has been described above, I have added another matrix to our report (see below). This matrix contains the “Reference fund status” data (see the first matrix below).
We now add a few charts to reflect upon our Market Value based data and last but not least, the SQL Shack logo. We end up with the following ‘very busy’ report (see below).
Fixing this mess!!
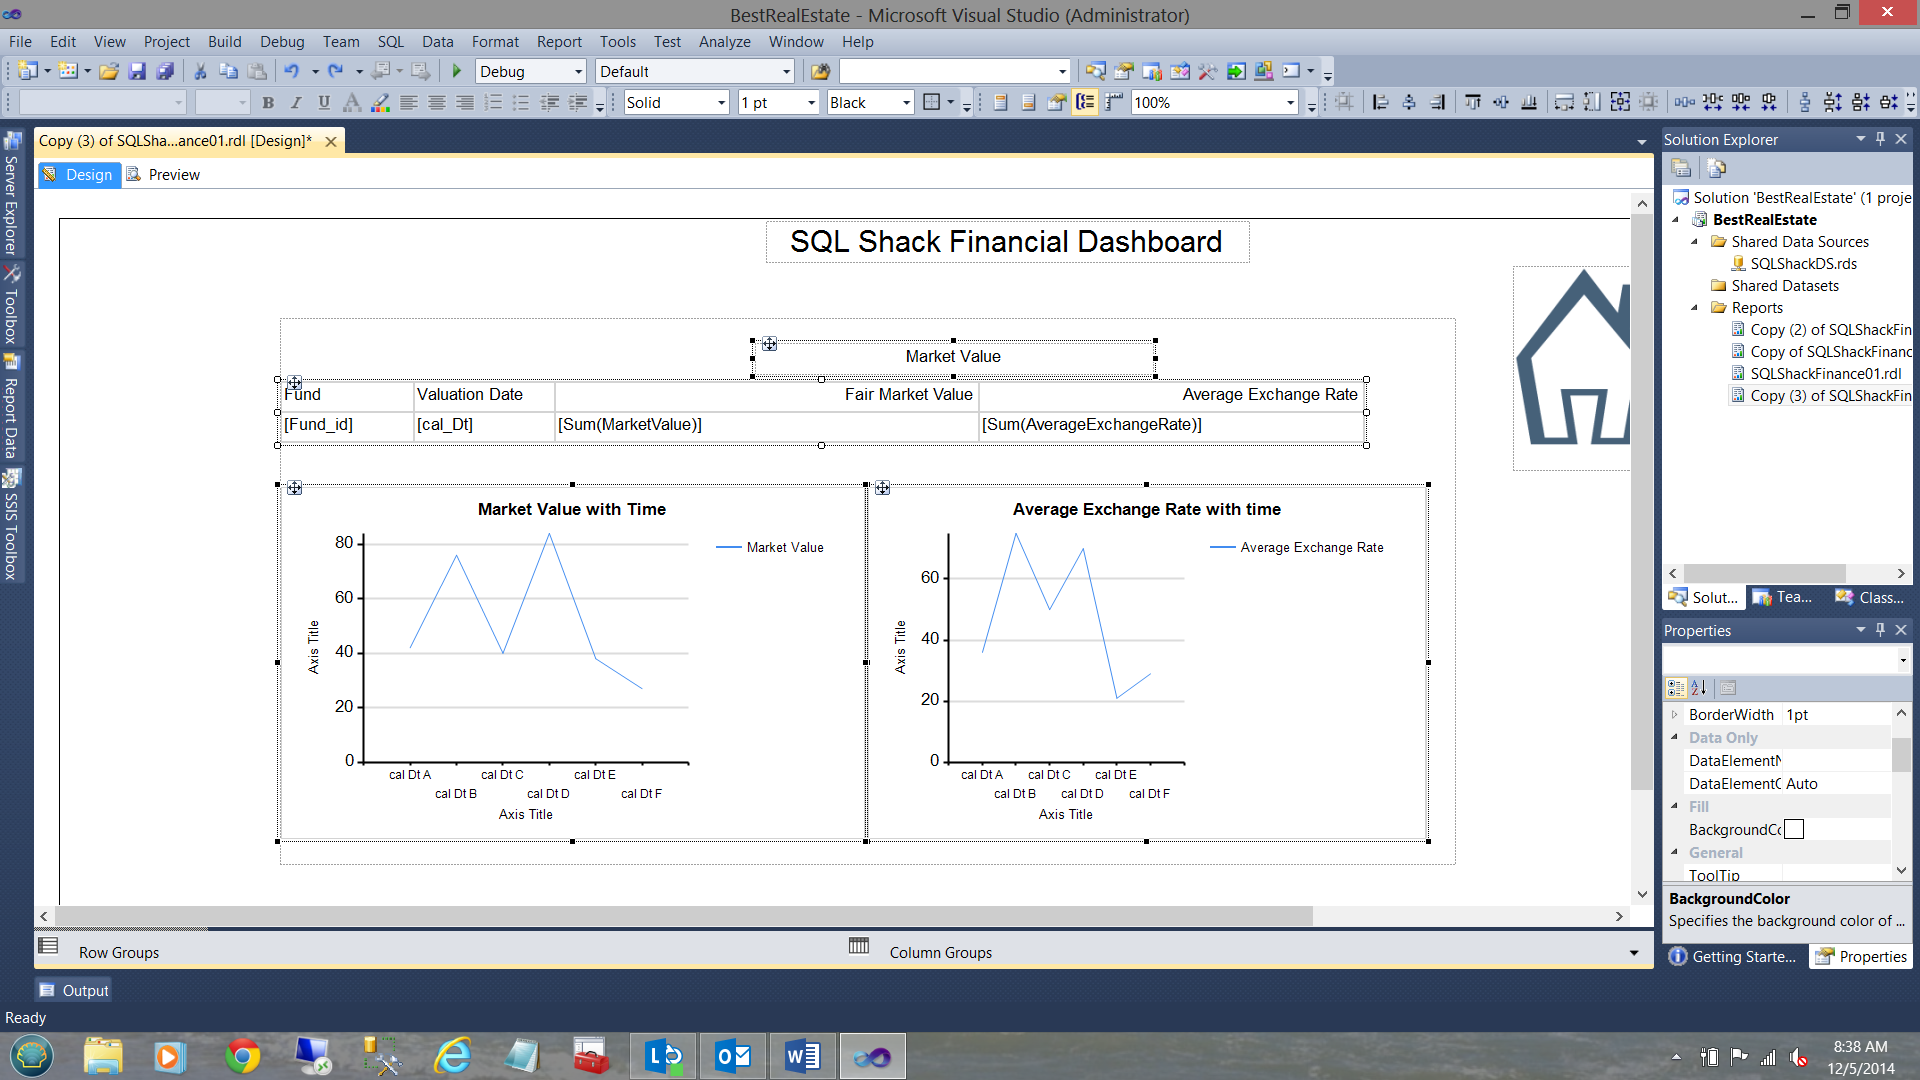
In order to consolidate our report and to keep ‘like-minded’ results together, we are going to place all related objects into rectangle controls and utilize the visibility property of THAT rectangle (see below). Thus when the end user wishes to look at Market Value related data, the rectangle containing the Market Value matrix and the 2 graphs will become visible and when the user wishes to view Reference Fund data, the Market Value objects are hidden and the Reference Fund data is displayed.
The rectangle
The objects being dropped into this rectangle.
It is IMPORTANT to note that the visibility property of the rectangle takes higher precedence than the objects contained within the rectangle. Thus when the visibility property of the rectangle is set to “show”, so will the objects within. When the property is set to hidden, so will the objects within the rectangle.
So how do we achieve all of this?
At this point we shall add a parameter called ‘toggle’ to our report. ‘toggle’ will have an initial / default value of 0 (zero). Further the ‘toggle’ parameter is never displayed on the screen and thus is hidden from the user’s view. It will never appear, requesting input from the end user (see below).
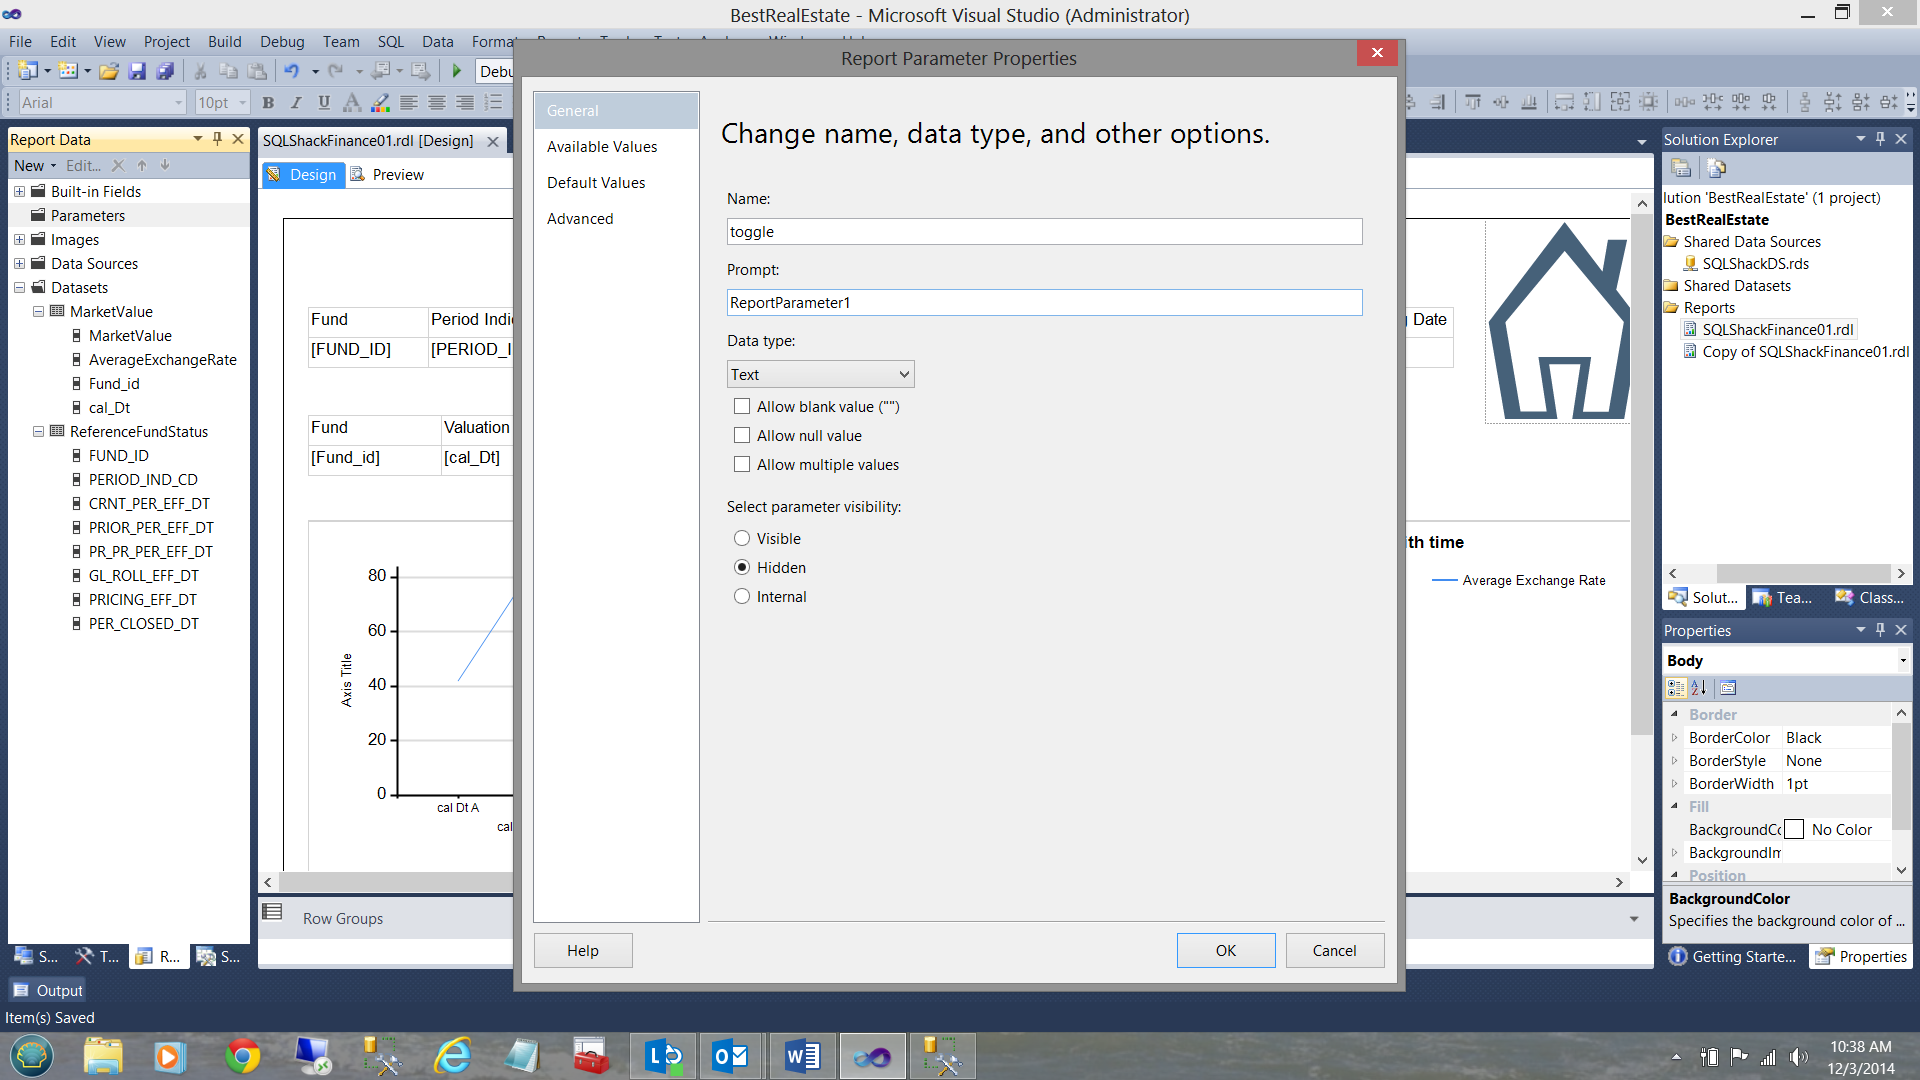
We shall now set the ‘toggle’ default value which will be 0 (see below).
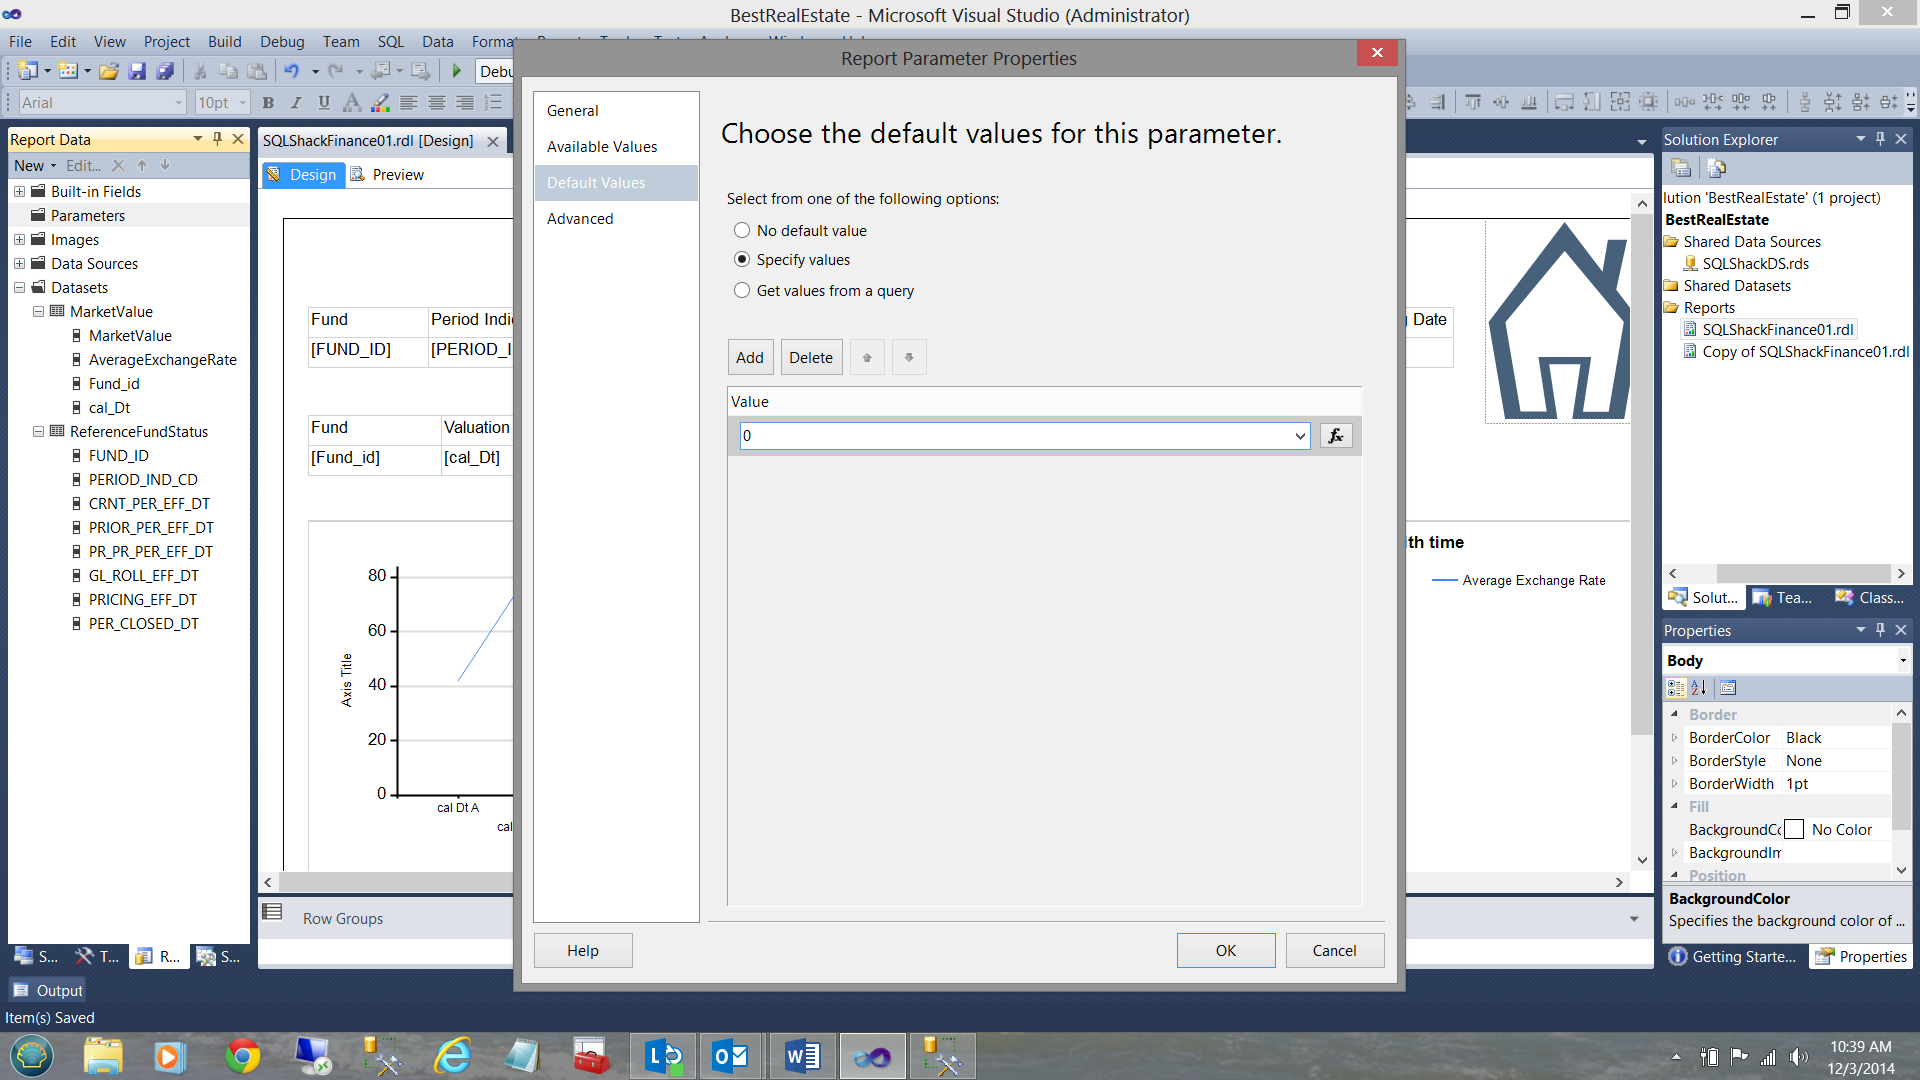
We click OK to leave the “Report Parameter Properties” dialogue box.
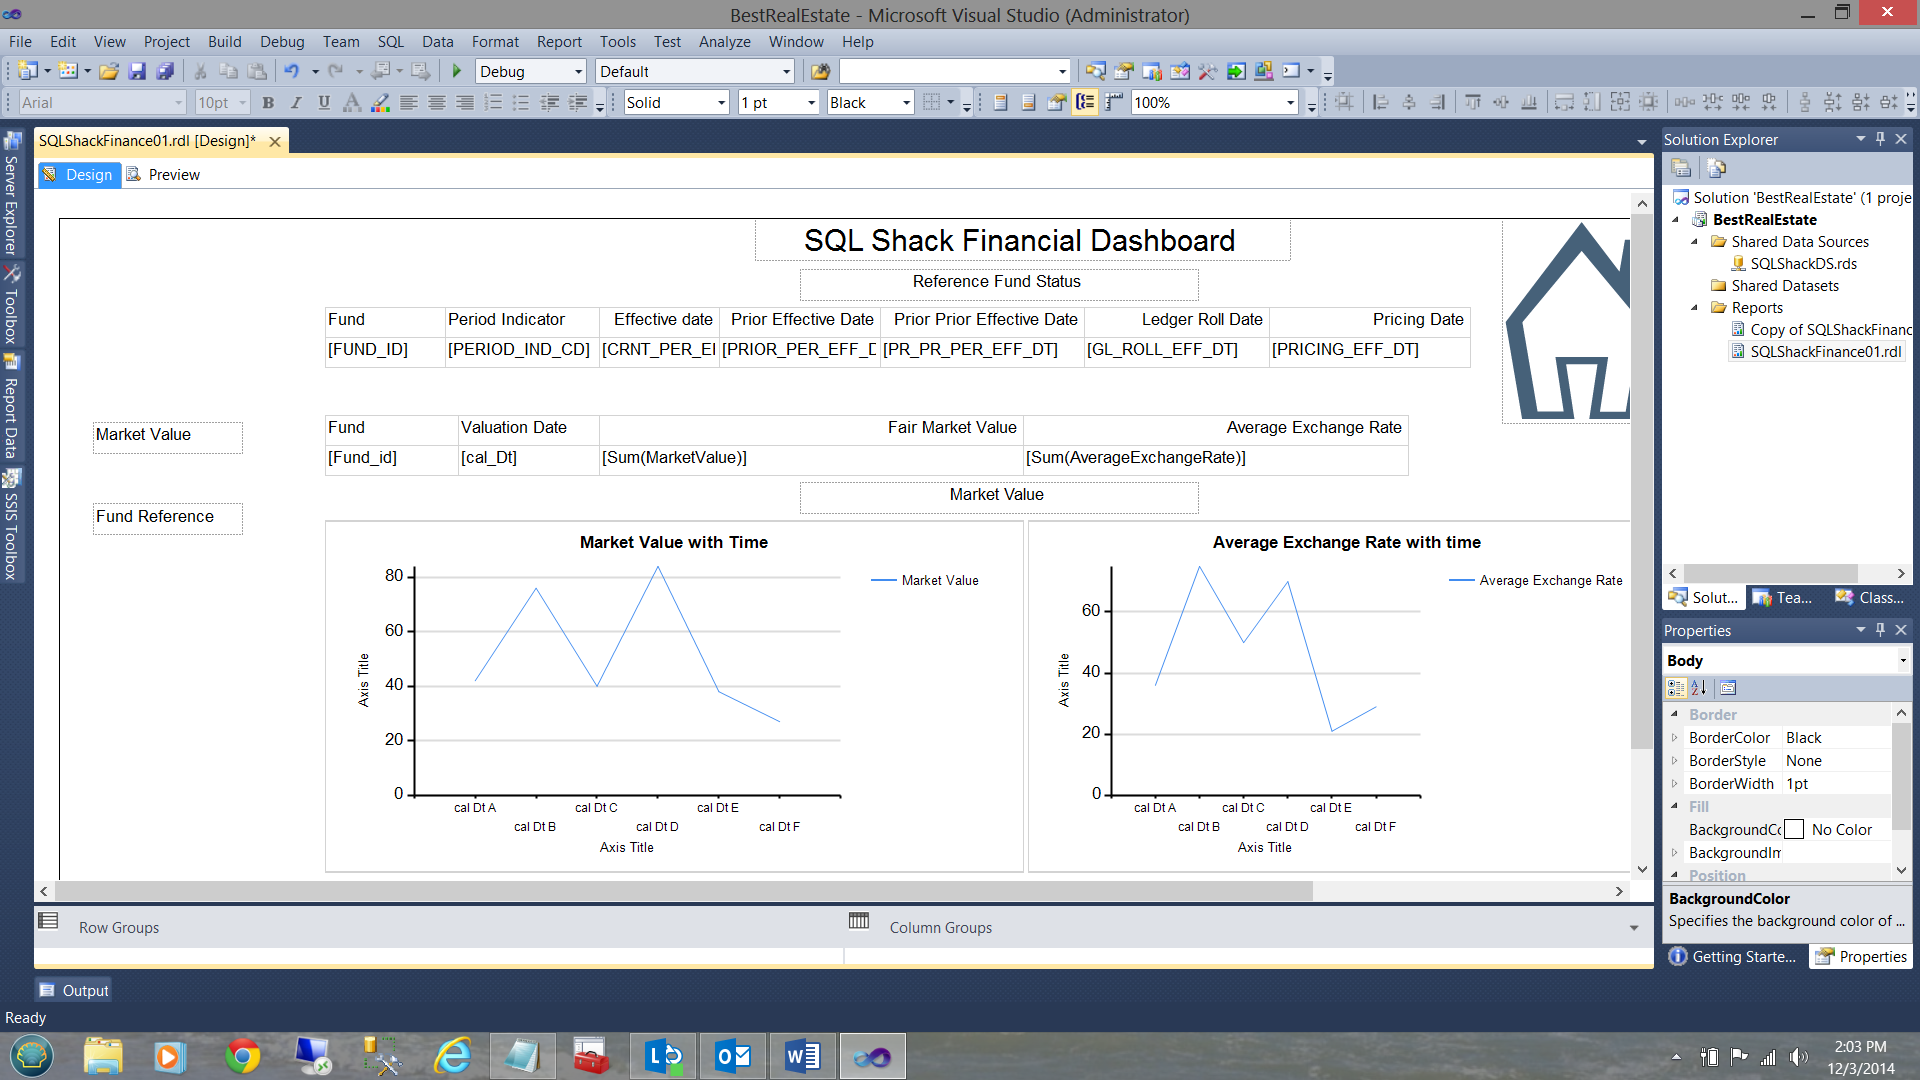
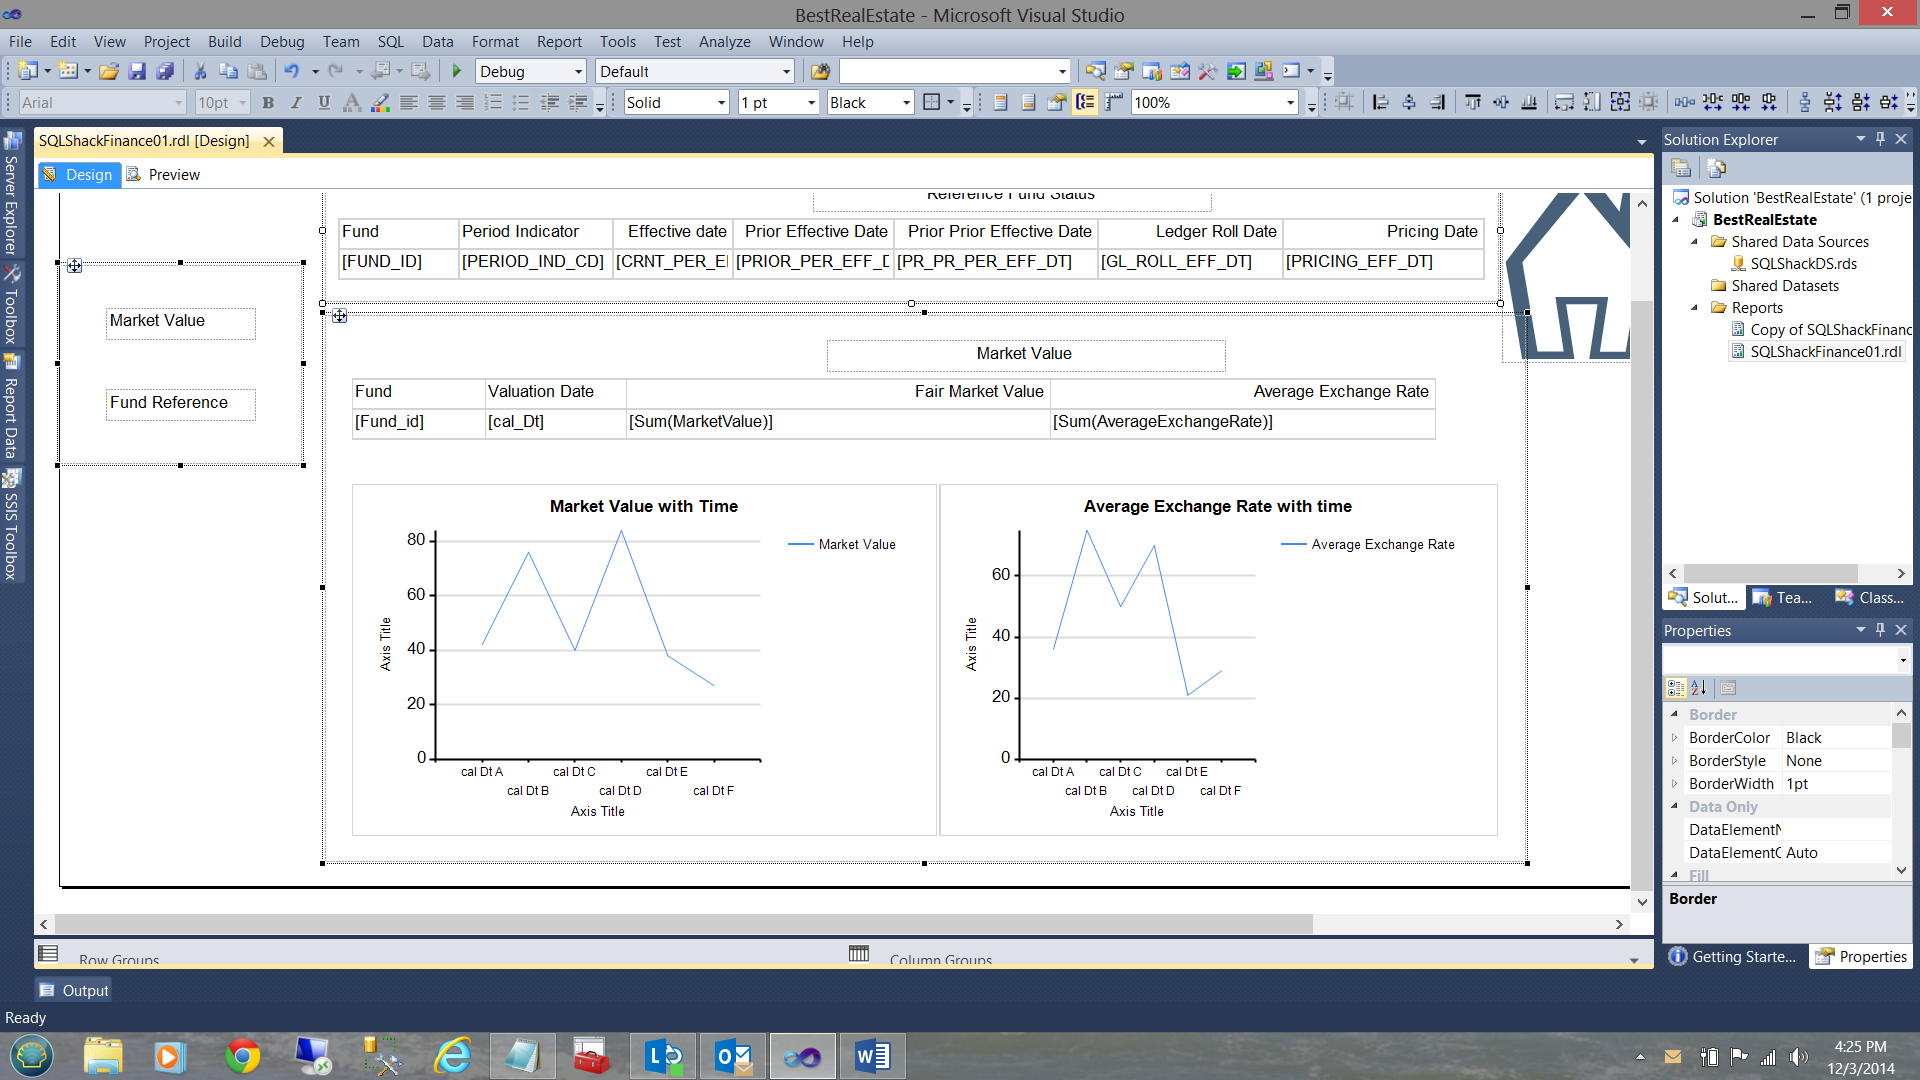
By moving ALL my objects over slightly to the right of the work surface, we create some extra work space (see below).
We now add two text boxes to that empty space (see below). One text box has the text “Market Value” and the other “Fund Reference”. While there is a rectangle enclosing these text boxes, the purpose of this rectangle is to keep the text boxes in situ as the remaining rectangles are toggled between ‘appear’ and ‘hidden’.
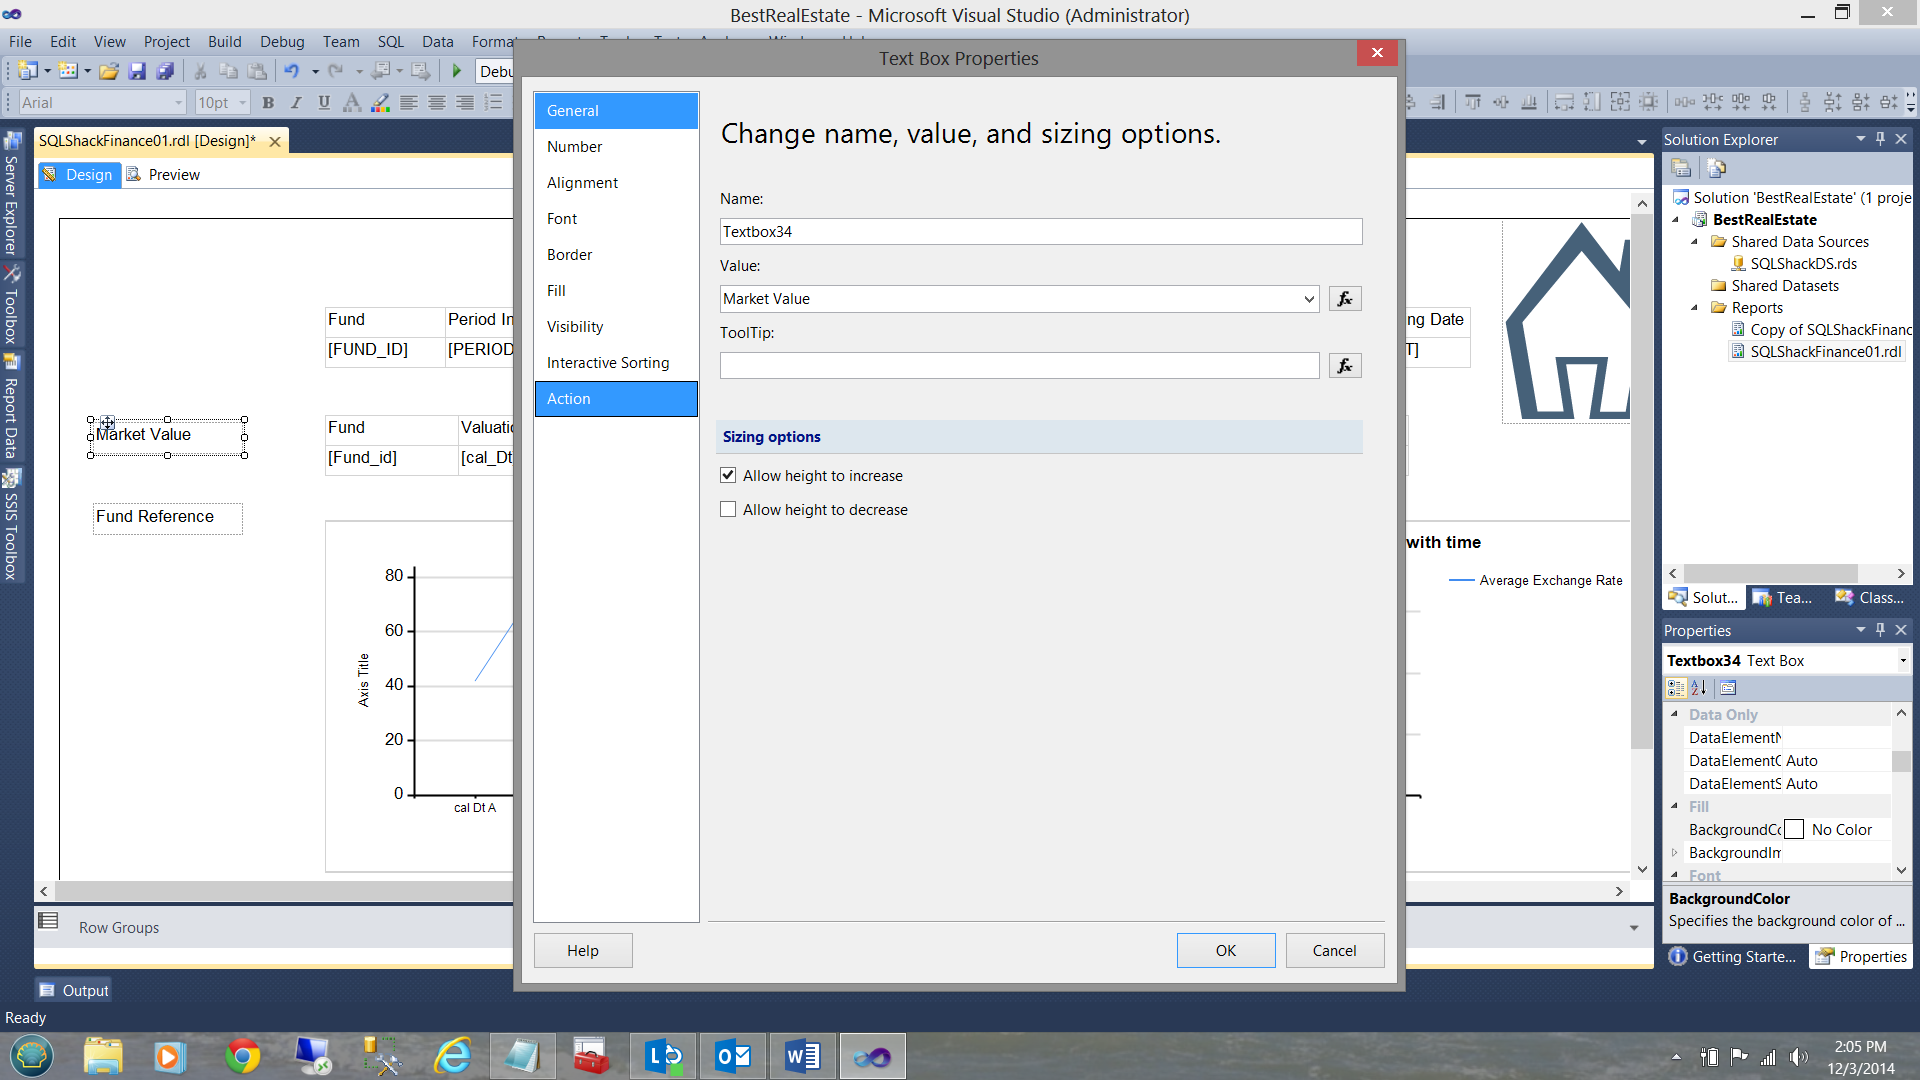
Activating the “Market Value” text box
We right click on the text box and select ‘Textbox Properties’ from the context menu. The “Text Box Properties” dialogue box is brought into view. We select “Action” (see below).
Opening the “Action” box, we select “Go to report”. For “Specify a report”, we create a recursive call to the report that we are constructing (see below).
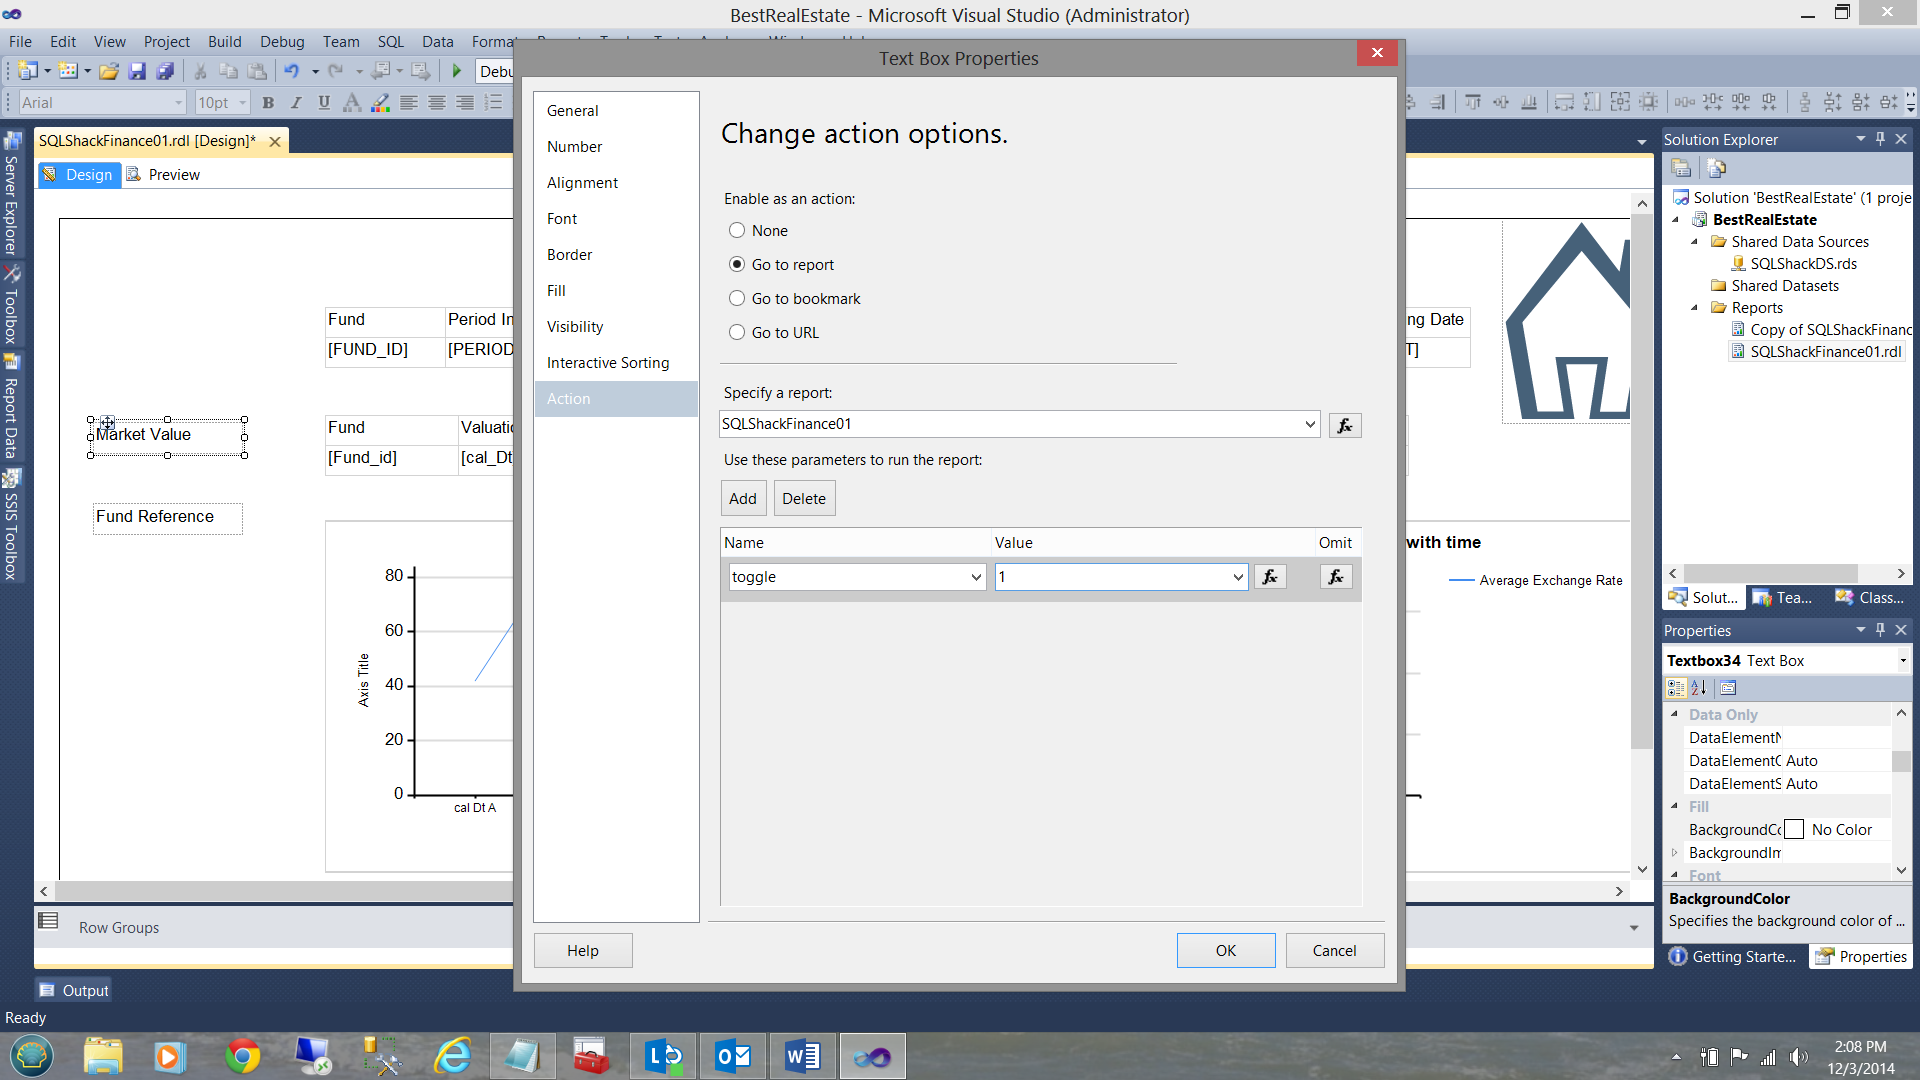
Note that we have added our “toggle” parameter (which we created above) to the “Use these parameters to run the report” section of the properties box and have given it a value of 1. This will be used within the recursive call (see above).
Activating the “Fund Status” text box
We repeat the same steps for setting the “Fund Status” text box, HOWEVER we set its toggle value to 2.
Working the REAL magic!!
Prior to commencing our activities and to give our report a less cluttered look, I rationalized a few things. Not much has changed (see below).
Cut and Paste tasks
As discussed above, we shall be placing all related controls into their own respective rectangle controls.
To achieve this, we “cut” all “Market Value” related objects. Once “cut”, we drag a rectangle control onto the surface, resize it, and then we “paste” the “cut” objects into that rectangle. We have seen this above with the section called “Fixing the mess”.
We repeat this process with the “Reference Fund Status” objects and for the two text boxes that we added (one to show Market Value data and the other to show Reference Fund Status data). The finished rectangles may be seen below:
Setting the Rectangle Toggles
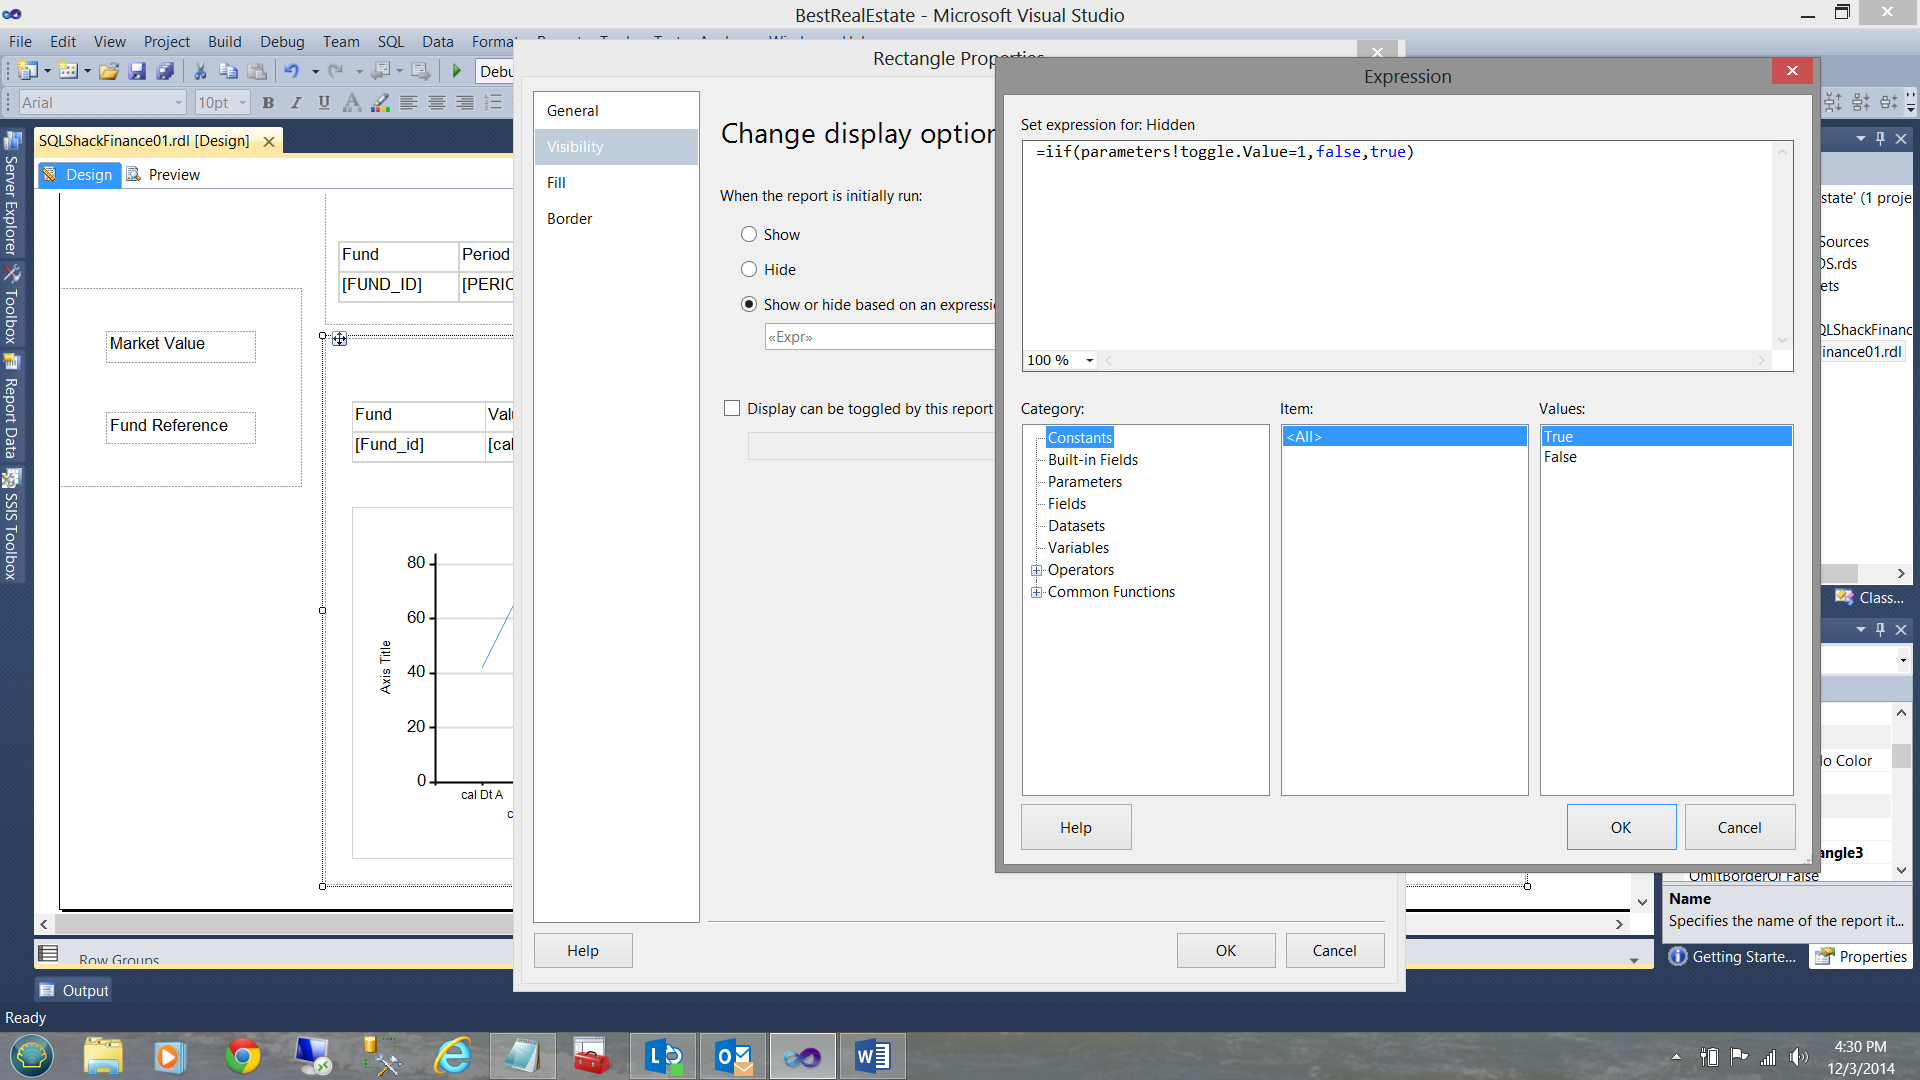
By right clicking on the “Reference Fund Status rectangle”, we bring up the “Rectangle Properties” dialogue box. We now click on the “Visibility” tab and select the “Show or hide based on an expression” radio button. Opening the “Expression” box we add the following script (see below).
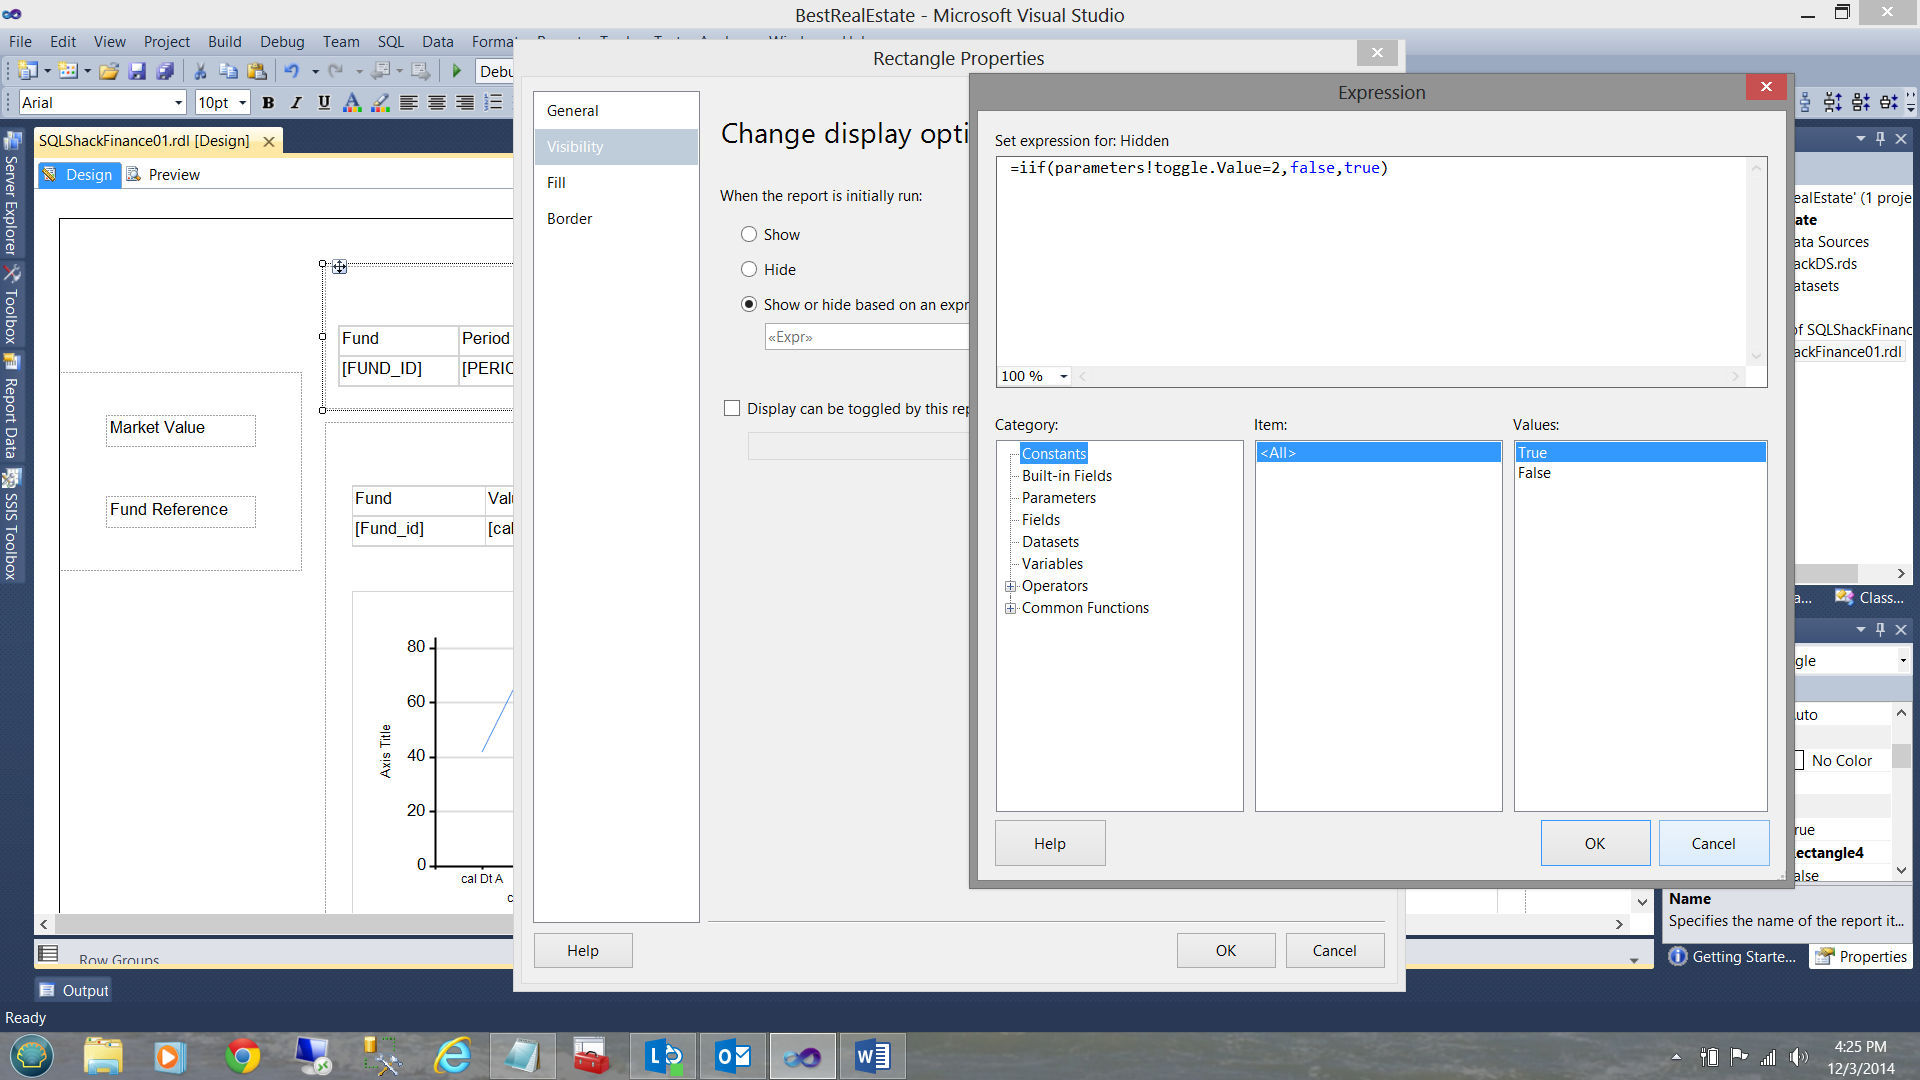
For the “Reference Fund Status”, we see that the rectangle will be visible when the value of ‘toggle’ is changed to 2 (see above).
As a detailed explanation, when toggle is set to a value of 2, “hidden” becomes FALSE and therefore the contents within the rectangle become visible to the end user (see above).
We configure the “Market Value” rectangle in a similar fashion (see below)
Let us give it a whirl!
To start our report in Preview mode, I click the “Preview” tab.
The report screen comes up.
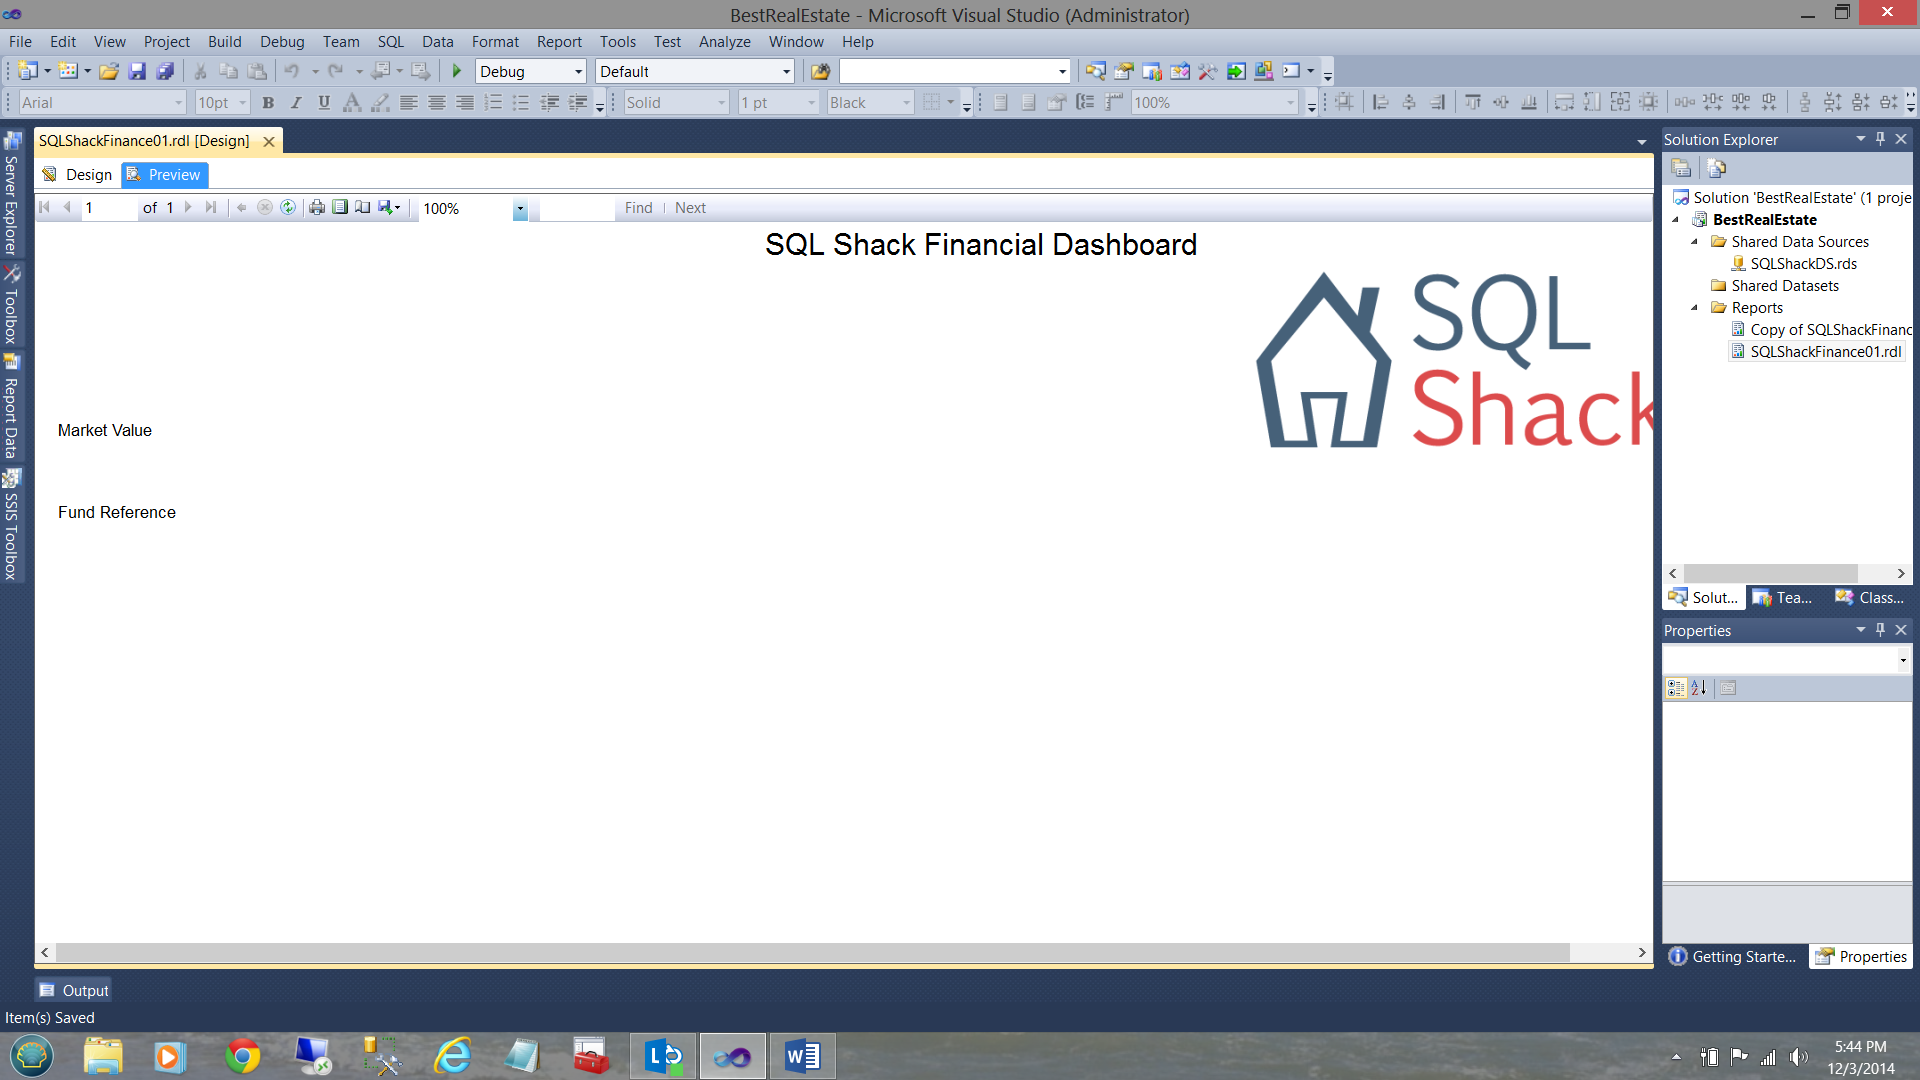
Note that all that is present are our “Market Value” and “Fund Reference” ‘buttons’ to the left, the SQL Shack logo and the “SQL Shack Financial Dashboard” report title. Why are these the only items visible? The reason being that the visibility properties on these items WERE NOT SET, therefore they are visible.
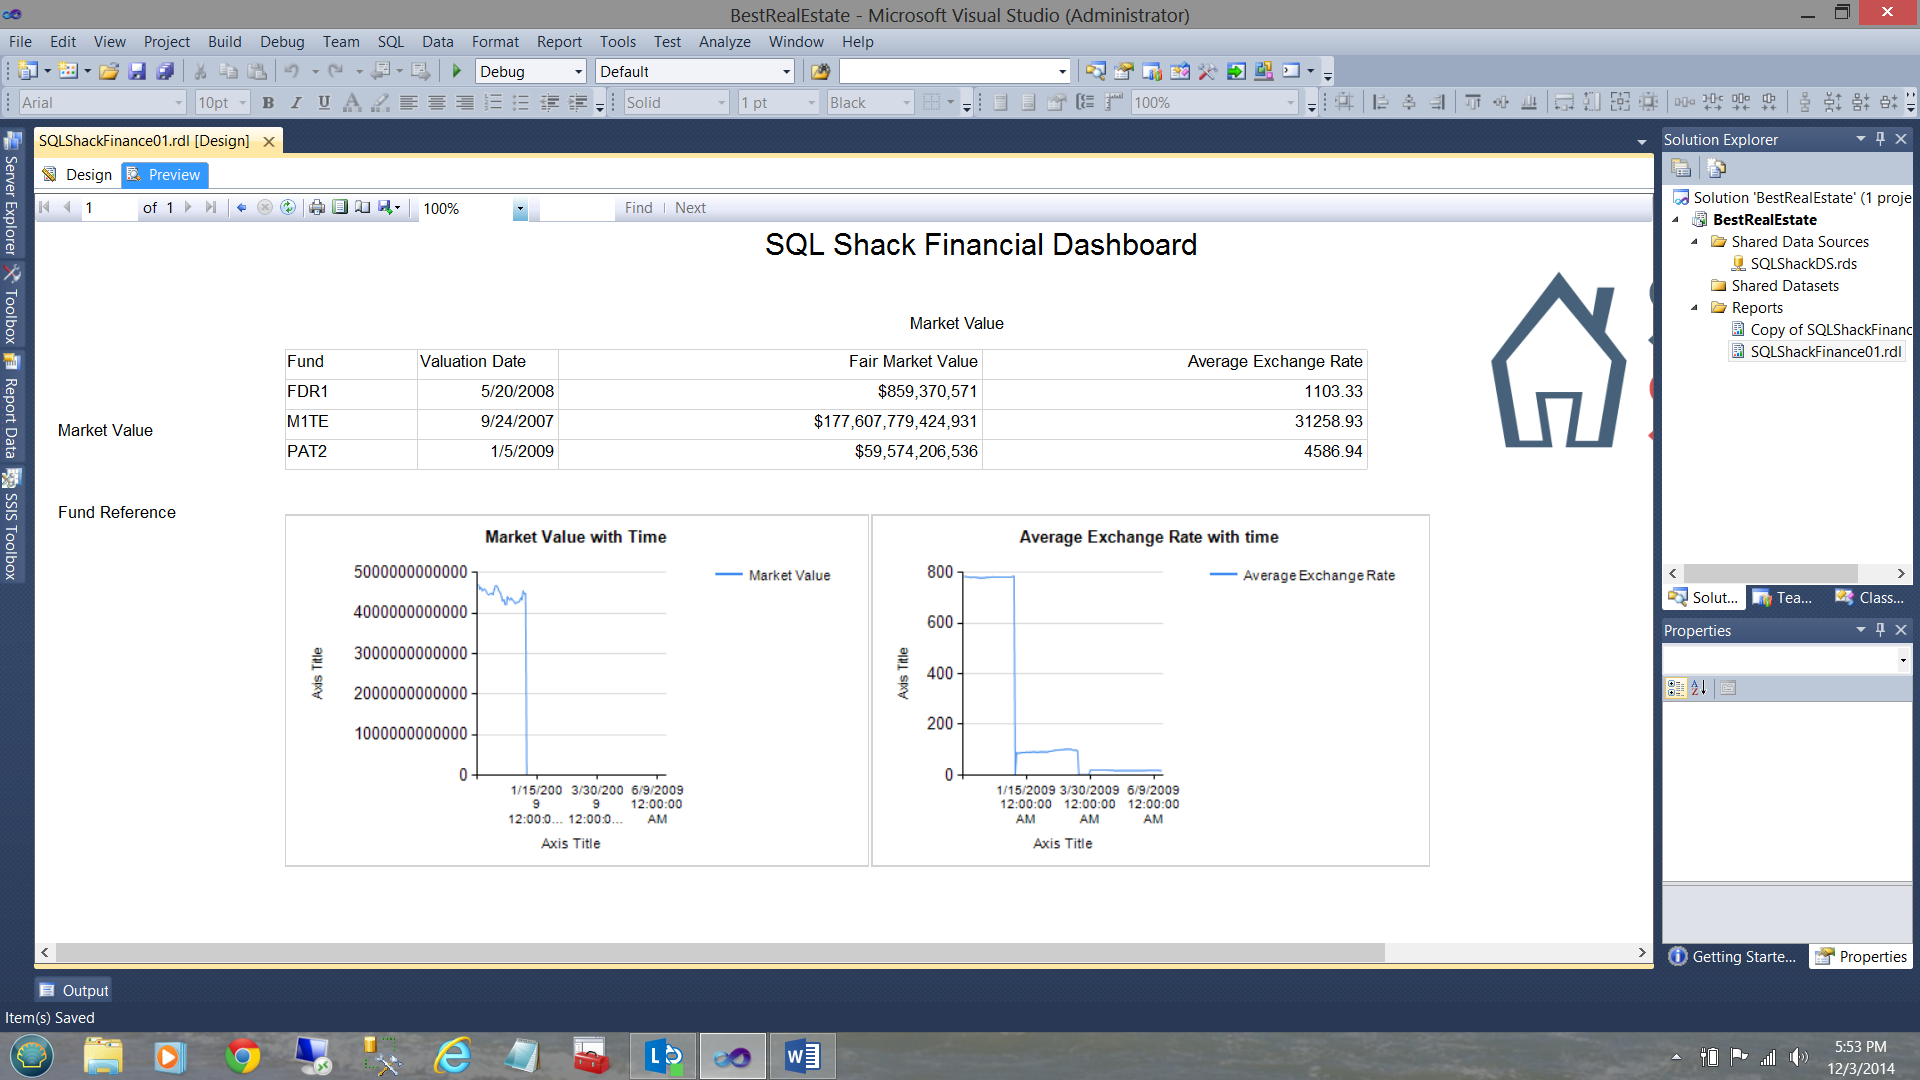
By clicking on the “Market Value” text box, we see the following
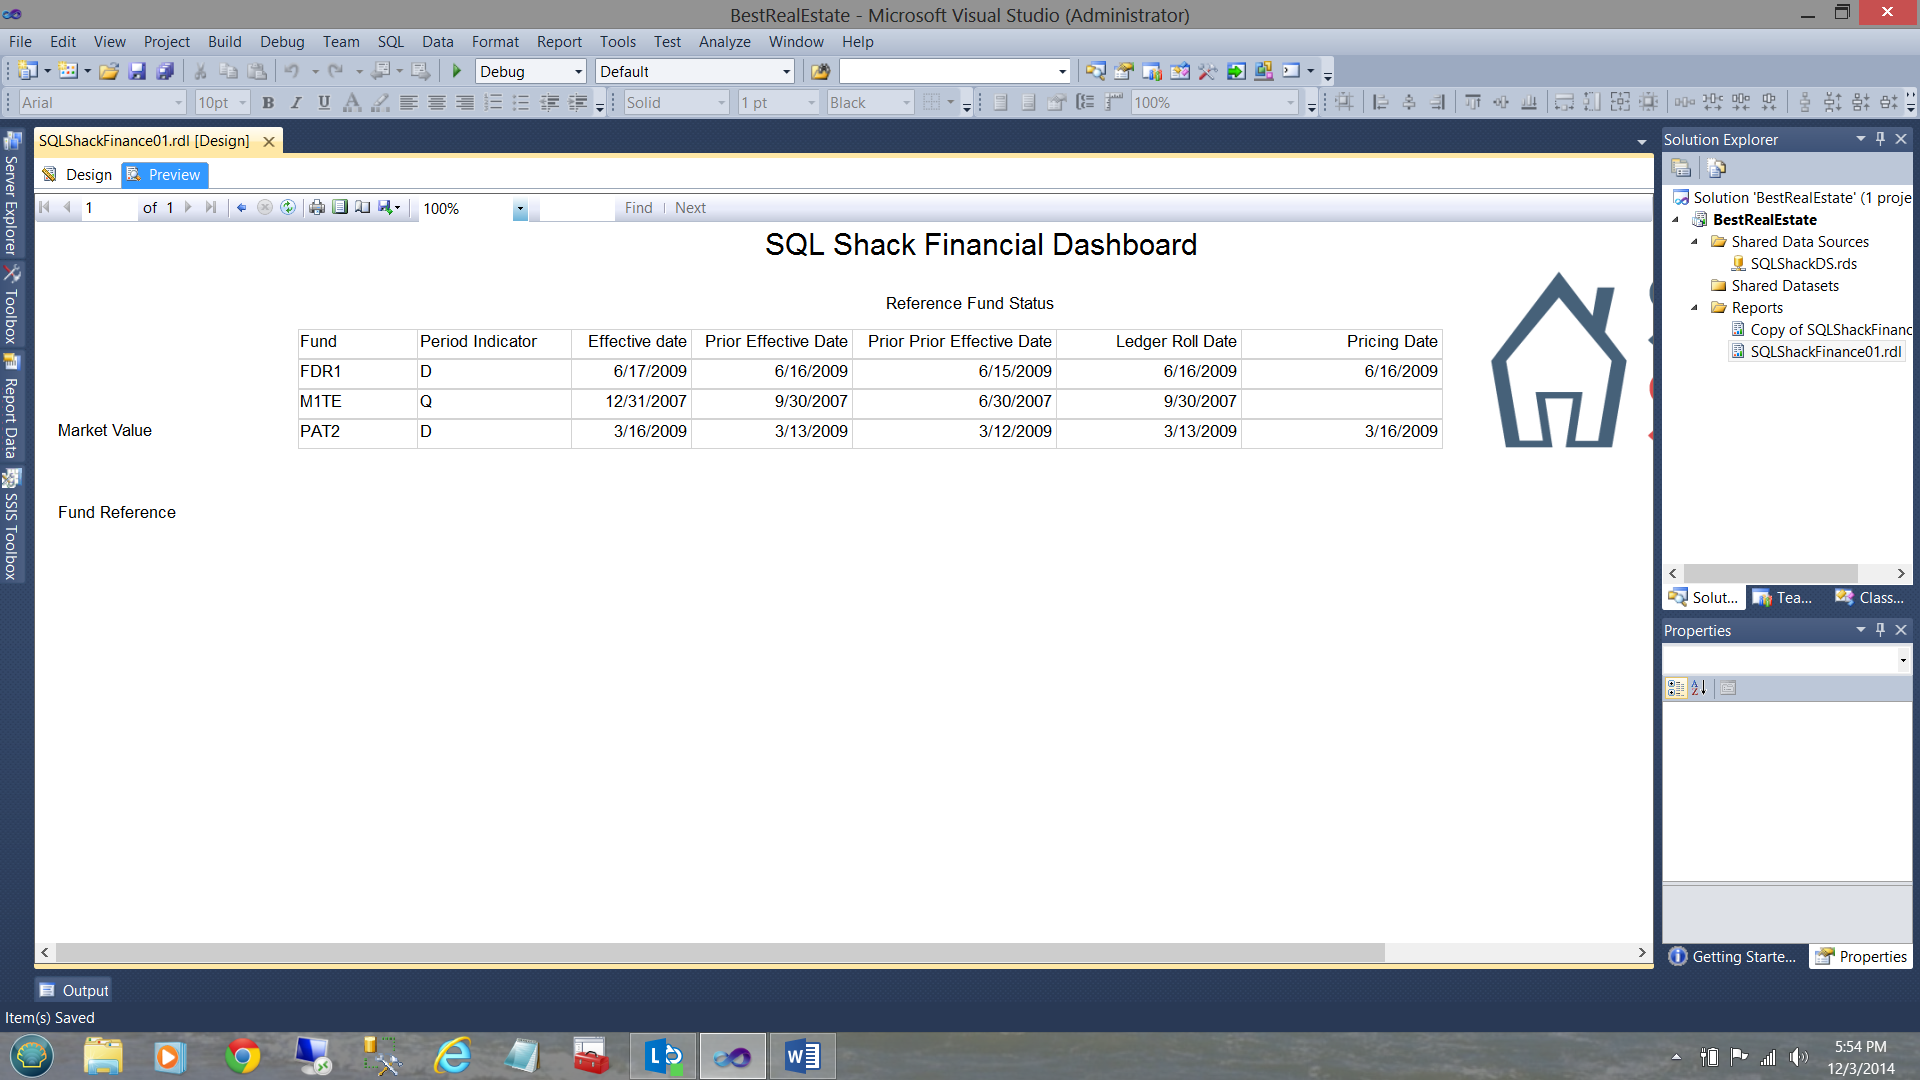
and by clicking the “Fund Reference” text box we note the following:
This said, we have taken a complex report and broken it up into two proper ‘logical units’, we have saved valuable real estate and all within one physical report!
Conclusions
Creating reports utilizing SQL Server Reporting Services is often complex due to end user requirements. Often users wish to view excessive amounts of data on limited amounts of ‘real estate’ within the report body.
By breaking the report down into logical units and working with the “visibility” property of the ‘containing’ rectangles we were able to remove much of the complexity, by enabling the user to define what he or she currently wishes to view; based upon selection “buttons” / text boxes.
As always should you have any questions pertaining to what I have just covered or should you wish a copy of the SQL Server Data Tools project, please feel free to contact me.
In the interim, happy programming.
Steve has presented papers at 8 PASS Summits and one at PASS Europe 2009 and 2010. He has recently presented a Master Data Services presentation at the PASS Amsterdam Rally.
Steve has presented 5 papers at the Information Builders' Summits. He is a PASS regional mentor.
View all posts by Steve Simon
- Reporting in SQL Server – Using calculated Expressions within reports - December 19, 2016
- How to use Expressions within SQL Server Reporting Services to create efficient reports - December 9, 2016
- How to use SQL Server Data Quality Services to ensure the correct aggregation of data - November 9, 2016