This article talks about Python scripts for creating pivot tables in multiple ways.
Introduction
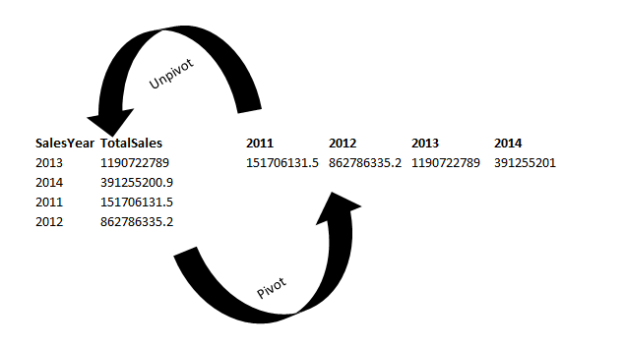
You might use PIVOT tables in Microsoft Excel for data analytics, preparing reports. It helps us to extract meaningful information from a large data set. We can transpose row into column along with aggregations on it.
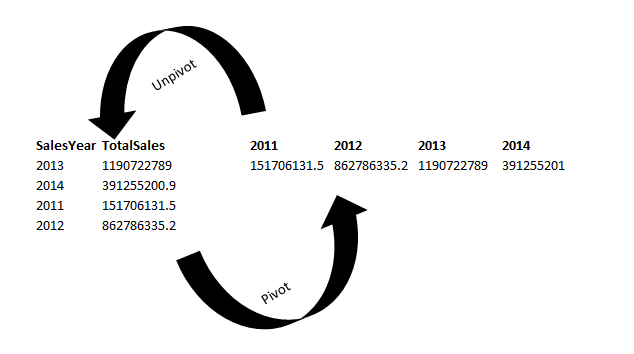
We can generate PIVOT data in different ways in SQL Server.
We can use Recursive CTE, While loop, SQL Concatenation, FOR XML PATH or CLR
- We can also use SQL PIVOT and SQL UNPIVOT relational operators from SQL Server 2017 onwards. You can refer to the article Static and Dynamic SQL Pivot and Unpivot relational operator overview
- We can use SSIS packages for the PIVOT transformation. Refer to this article to learn about the same, An overview of SSIS Pivot and SSIS Unpivot Transformations
Python is an interactive and easy to use programming language. We explored many use cases of Python scripts on SQLShack. This article explores the use of Python for Pivot data.
Python Scripts and Pivot
We will explore a few methods that you can use in Python for a Pivot table. For the demonstration, create the following table and insert data into it.
|
1 2 3 4 5 6 7 8 9 10 11 12 13 14 15 |
CREATE TABLE [dbo].[SalesData]( [EmployeeID] [float] NULL, [FirstName] [nvarchar](255) NULL, [CustomerId] [float] NULL, [CustomerID1] [nvarchar](255) NULL, [CompanyName] [nvarchar](255) NULL, [OrderID] [float] NULL, [ProductID] [float] NULL, [ProductName] [nvarchar](255) NULL, [OrderDate] [datetime] NULL, [UnitPrice] [float] NULL, [Quantity] [float] NULL, [SubTotal] [float] NULL ) ON [PRIMARY] GO |
Open the following attachment to insert data into this table.
Method 1: Create a Pivot using data stored in the SQL table
For this demonstration, I am using data stored in the [SalesData] table of the SQLShackDemo database.
|
1 2 3 4 5 6 7 8 9 10 11 12 13 |
SELECT TOP 10 [FirstName] ,[CustomerId] ,[CustomerID1] ,[CompanyName] ,[OrderID] ,[ProductID] ,[ProductName] ,[OrderDate] ,[UnitPrice] ,[Quantity] ,[SubTotal] FROM [SQLShackDemo].[dbo].[SalesData] Order by [subtotal] |
We want a PIVOT table as highlighted in the following screenshot. Here, we require Quantity, SubTotal and UnitPrice for pivot column ProductName.
We run Python scripts in SQL Server using sp_execute_external_script stored procedure.
Pre-requisites for running Python scripts in SQL Server
- You should be on SQL Server 2017 or SQL Server 2019 for this article
- Install Machine Services (In-Database) – Python
- Enable external scripts execution using sp_configure command
|
1 2 |
EXEC sp_configure 'external scripts enabled', 1 RECONFIGURE WITH OVERRIDE |
For detailed instructions, refer to this article How to use Python in SQL Server 2017 to obtain advanced data analytics.
Once we have prepared the environment, execute the following Python code, and you get the output per our requirement specified above.
|
1 2 3 4 5 6 7 8 9 10 11 12 13 14 15 16 17 18 19 20 21 22 23 24 |
EXEC sp_execute_external_script @language =N'Python', @script=N' import pandas as pd import numpy as np data = InputDataSet #Determine pivot table OutputDataSet = data.pivot_table(values=["UnitPrice","Quantity","SubTotal"], index=["ProductName"], aggfunc=np.sum) print(OutputDataSet) ', @input_data_1 = N'SELECT top 10 [FirstName] ,[CustomerId] ,[CustomerID1] ,[CompanyName] ,[OrderID] ,[ProductID] ,[ProductName] ,[OrderDate] ,[UnitPrice] ,[Quantity] ,[SubTotal] FROM [SQLShackDemo].[dbo].[SalesData] order by [subtotal]', @output_data_1_name = N'OutputDataSet' |
Let’s understand the Python script.
-
In the first block, we use sp_execute_external_script stored procedure and define Python language for the script
We import the Pandas and Numpy python module in the script. These modules provide useful functions for Pivot, data sort, aggregations.

-
In the next part, we define a data frame for the input data set. We have a pivot_table Python function for creating a pivot table from input data
In data.pivot_table, we define indexes and their value column. Here, we define [ProductName] as index column and [UnitPrice],[Quantity], [SubTotal] as data value columns. Data frame OutputDataSet captures this data. We can display the output using a PRINT function

-
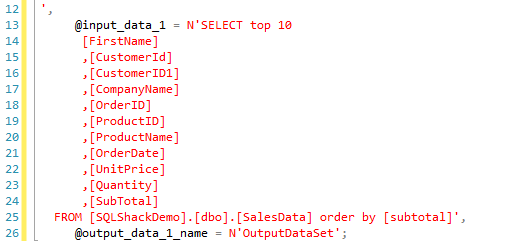
We specify the SQL query to retrieve source data from [SalesData] table in the @input_data_1 argument

Similarly, let’s look at another example of the following source data.
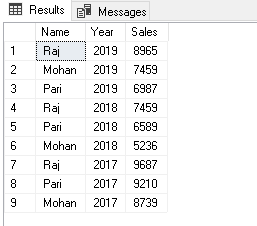
We want to generate pivot data in two formats.
- Total Sales by each employee
- Total Sales by each employee in a sales year
Execute the following Python script in SSMS.
|
1 2 3 4 5 6 7 8 9 10 11 12 13 |
EXEC sp_execute_external_script @language = N'Python', @script = N' import pandas as pd import numpy as np data = InputDataSet #Determine pivot table OutputDataSet = data.pivot_table(values=["Sales"], index=["Name"], aggfunc=np.sum) print(OutputDataSet) ', @input_data_1 = N'SELECT * FROM Sales', @output_data_1_name = N'OutputDataSet'; |
You get the following PIVOT table in the output and it satisfies our first requirement.

For the second requirement, let’s add a new row for Raj and now we have two entries for Raj in the year 2019.
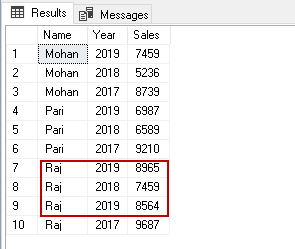
Now, for this requirement, we add [Year] column as well in the index columns for Pivot.
|
1 2 3 4 5 6 7 8 9 10 11 12 13 |
EXEC sp_execute_external_script @language = N'Python', @script = N' import pandas as pd import numpy as np data = InputDataSet #Determine pivot table OutputDataSet = data.pivot_table(values=["Sales"], index=["Name","Year"], aggfunc=np.sum) print(OutputDataSet) ', @input_data_1 = N'SELECT * FROM Sales', @output_data_1_name = N'OutputDataSet'; |
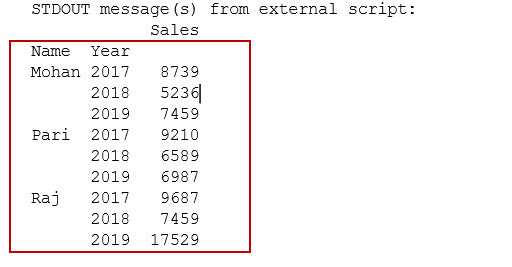
In the output, we get Pivot for employees along with yearly detail. We can note that for Raj it combined both entries of year 2019 and give a sum of sales in pivot output.
Method 2: Read data from a CSV file and prepare a PIVOT data using Python scripts in SQL Server
In the previous examples, our source data was in SQL tables. Python can read CSV, Excel files as well using pandas’ modules.
We can store the CSV file locally in a directory, or it can read directly from a Web URL. In this demo, we use a CSV file stored on a Web URL.
In the following code, we use pd.read_csv function and input a Web URL as source data. Python directly takes data from this URL, but you should have an active internet connection for it.
|
1 |
data = pd.read_csv("https://media.geeksforgeeks.org/wp-content/uploads/nba.csv") |
Later, we define index columns (Team, Salary) and values (college) for it. We also use aggregate function np.sum on this.
|
1 2 3 4 5 6 7 8 9 10 11 |
EXEC sp_execute_external_script @language = N'Python', @script = N' import pandas as pd import numpy as np data = pd.read_csv("https://media.geeksforgeeks.org/wp-content/uploads/nba.csv") OutputDataSet = data.pivot_table(values=["College"], index=["Team","Name","Salary","Position"], aggfunc=np.sum) print(OutputDataSet) ', @output_data_1_name = N'OutputDataSet'; |
Execute this Python script and view pivot data.
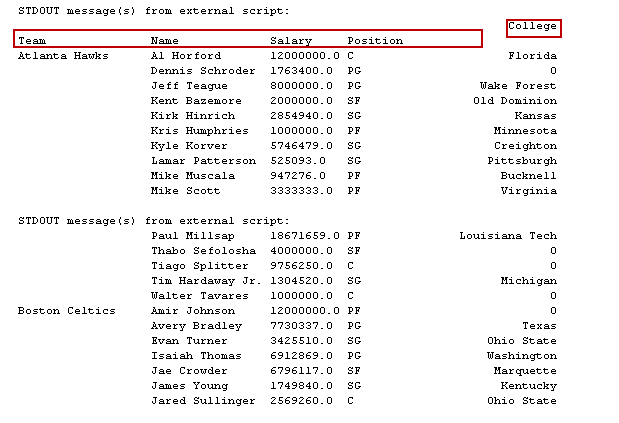
In the output, we can see a few records show zero in the college column. We do not have a college name in the CSV file for those records, and in PIVOT, it shows zero for the NULL or blank cells.
Suppose we do not want those records in the pivot table. Let’s drop these records having blank cells in CSV using the dropna() Python function. We use argument inplace=true to make changes in the data frame itself.
|
1 |
data.dropna(inplace = True) |
The complete code after adding the dropna() function is below.
|
1 2 3 4 5 6 7 8 9 10 11 12 |
EXEC sp_execute_external_script @language = N'Python', @script = N' import pandas as pd import numpy as np data = pd.read_csv("https://media.geeksforgeeks.org/wp-content/uploads/nba.csv") data.dropna(inplace = True) OutputDataSet = data.pivot_table(values=["College"], index=["Team","Name","Salary","Position"], aggfunc=np.sum) print(OutputDataSet) ', @output_data_1_name = N'OutputDataSet'; |
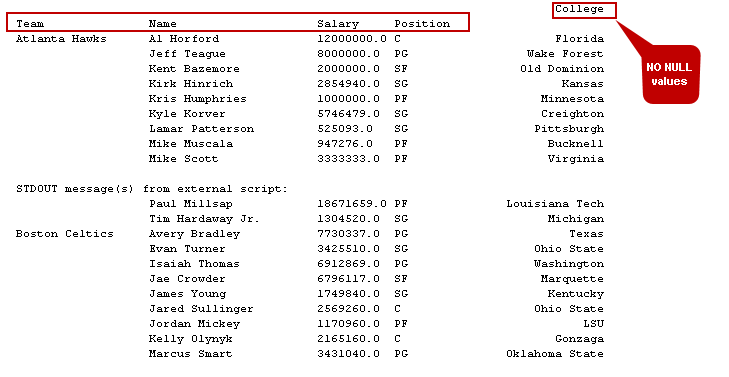
Now, execute it and notice the change in pivot tables. It eliminated records with NULL values in the output as shown in the following image.
Method 3: PIVOT tables using groupby and lambda function in Python scripts
We can use groupby and lambda functions as well in the Python scripts for Pivot tables. For this example, I have a data set of a few states of India and their cities in a SQL table.
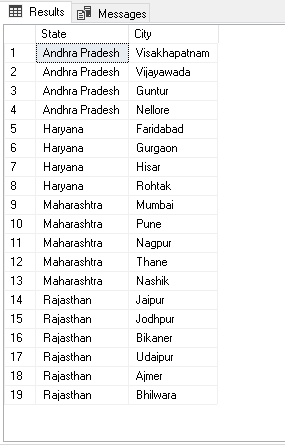
We need a pivot table from this data. In the output, it should list all cities for a state in a column; it should use || as a city name separator.
We use the following function for our scripts.
- Groupby(): We use groupby() function in Python pandas data frame to split the data into the group as per defined criteria. It is a similar function as of SQL GROUP BY function. In the query, we specify the groupby() function on the state column
- Lambda(): We can use a lambda function to construct anonymous functions in Python. We define expressions in this function
- Sorted(): It sorts the results in an ascending or descending order. It is similar to an ORDER BY clause in SQL Server
- Join(): The Join() function creates a concatenated string. We require it to concatenate || in the result set
Execute the following Python script to get the desired pivot data.
|
1 2 3 4 5 6 7 8 9 10 11 12 13 14 15 16 |
EXEC sp_execute_external_script @language = N'Python', @script = N' df = States import pandas as pd pivot = df.groupby("State", as_index = False).agg(lambda x: " || ".join(sorted(set(x)))) OutputDataSet = pivot ', @input_data_1 = N'SELECT [State] ,[City] FROM [SQLShackDemo].[dbo].[States]', @input_data_1_name = N'States' WITH RESULT SETS((State NVARCHAR(100), Cities NVARCHAR(200))); |

Conclusion
In this article, we explored Python scripts for creating PIVOT tables similar to Microsoft Excel. You should explore Python as it is a popular, versatile, and useful programming language.
- Understanding PostgreSQL SUBSTRING function - September 21, 2024
- How to install PostgreSQL on Ubuntu - July 13, 2023
- How to use the CROSSTAB function in PostgreSQL - February 17, 2023

