SQL Server Query Store is a performance monitoring tool that helps us evaluate the performance of a SQL query in terms of several different performance metrics such as CPU and Memory Consumption, execution time and the I/O cycles consumed by the query. Query store is similar to the windows “Task Manager”. A task manager provides information about the CPU, Memory, Network and Disc consumption of a process. Similarly, the Query Store provides insight to similar information.
The following are some of the operations that the Query Store performs:
- Captures query plans and runtime query statistics
- Stores query workload history
- Allows database level troubleshooting and performance analysis
- Enforce policies that execute queries in a specific way
In this article, we will see how to enable the Query Store option and how to perform different operations with the Query Store.
Creating Dummy Dataset
Before working with the SQL Server Query Store, let’s first create a dummy dataset. Execute the following script to create the dataset:
|
1 2 3 4 5 6 7 8 9 10 11 12 13 14 15 16 17 |
CREATE Database Bookshop; GO USE Bookshop; CREATE TABLE Book ( id INT, name VARCHAR(50) NOT NULL, price VARCHAR(50) NOT NULL ) CREATE TABLE Author ( id INT, name VARCHAR(50) NOT NULL, age VARCHAR(50) NOT NULL ) |
In the script above, we create a new database Bookshop. We then created two tables i.e. Book and Author within the Bookshop database. The Book table contains three columns: id, name, and price. Similarly, the Author table contains columns: id, name, and age.
Let’s now add some dummy data in the Book table.
|
1 2 3 4 5 6 7 8 |
INSERT INTO Book VALUES (1, 'Book1', 15), (2, 'Book2', 20), (3, 'Book3', 30), (4, 'Book4', 25), (5, 'Book5', 10) |
Similarly, the following script adds records in the Author table.
|
1 2 3 4 5 6 7 8 9 |
INSERT INTO Author VALUES (1, 'Author1', 15), (2, 'Author2', 20), (3, 'Author3', 30), (4, 'Author4', 25), (5, 'Author5', 10) |
Enabling SQL Server Query Store
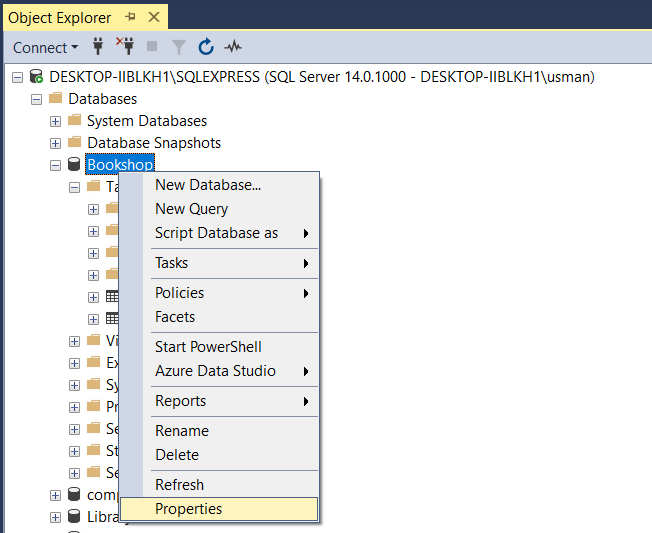
To enable a query store for a database, you can go to SQL Server Management Studio (SSMS) and right-click on the database which you want to enable Query Store for. From the dropdown menu that appears, click on “properties” as shown in the following figure:
Once you click “properties”, you should see the following screen window.

From the options on the top left, select “Query Store”. You will be taken to the following window.
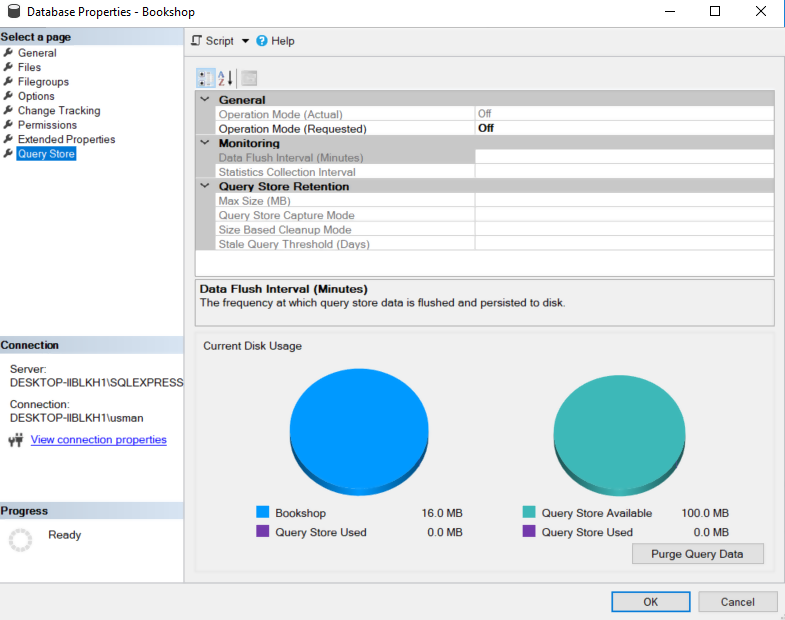
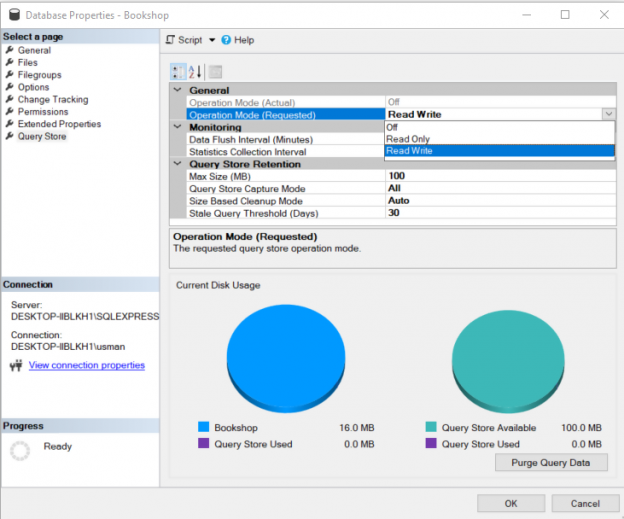
To enable the SQL Server Query store, click on the “Off” option to the right of “Operation Mode” and then select “Read-Write” from the drop-down list that appears as shown in the following screenshot. Doing so will enable the Query Store for the “Bookshop” database.

Let’s briefly discuss the different options in the Query Store window.
- Data Flush Interval: Writes query and database statistics to discuss for logging purposes. The default time is 15 minutes
- Statistics Collection Interval: Interval to collect database and query statistics over. The default value is 1 hour
- Max Size (MB): Data captured by the SQL Server Query Store is stored in a file. The Max Size (MB) specifies the file size. The default value is 100 MB
- Query Store Capture Mode: By default, this is set to ALL which means that all the different types of statistics that the Query Store is supposed to store will be stored
- Size Based Cleanup Mode: It is used to purge the data when the file size for SQL Server Query Store exceeds Max Size in MBs. By default, it is set to Off. You can enable it by selecting the Auto option
- Stale Query Threshold (Days): Number of days after which the statistics from the Query will be removed
SQL Server creates a view for the Query Store in System Views of the database on which you enable the Query Store. To see the view, go to Database-> Views -> System Views and there you should see sys.query_store_plan. This view can be used to view reports about the information retrieved by the Query Store.
Viewing SQL Server Query Store Reports
If you do not have already executed any queries on the “Bookshop” database, execute the following queries. We are executing these queries because we want to see different types of performance metrics for our queries.
Execute the following script:
|
1 2 3 4 5 6 7 8 9 10 11 12 13 14 15 16 17 18 19 20 21 22 23 24 25 26 27 28 |
USE Bookshop SELECT * FROM Author GO 100 INSERT INTO Book VALUES (6, 'Book6', 15), (7, 'Book7', 20), (8, 'Book8', 30), (9, 'Book9', 25), (10, 'Book10', 10) Go 10 INSERT INTO Author VALUES (6, 'Author6', 15), (7, 'Author7', 20), (8, 'Author8', 30), (9, 'Author9', 25), (10, 'Author10', 10) Go 10 |
In the script above, we execute three different queries multiple times. The first READ query is executed for 100 times. The next two INSERT queries are executed 10 times.
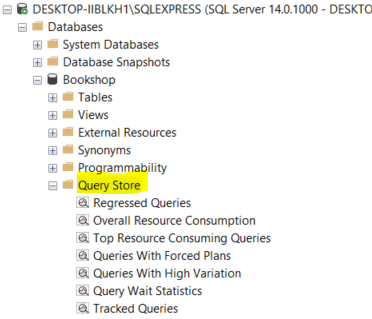
To view the SQL Server Query Store Reports, go to the Database->Query Store as shown below:
Regressed Queries
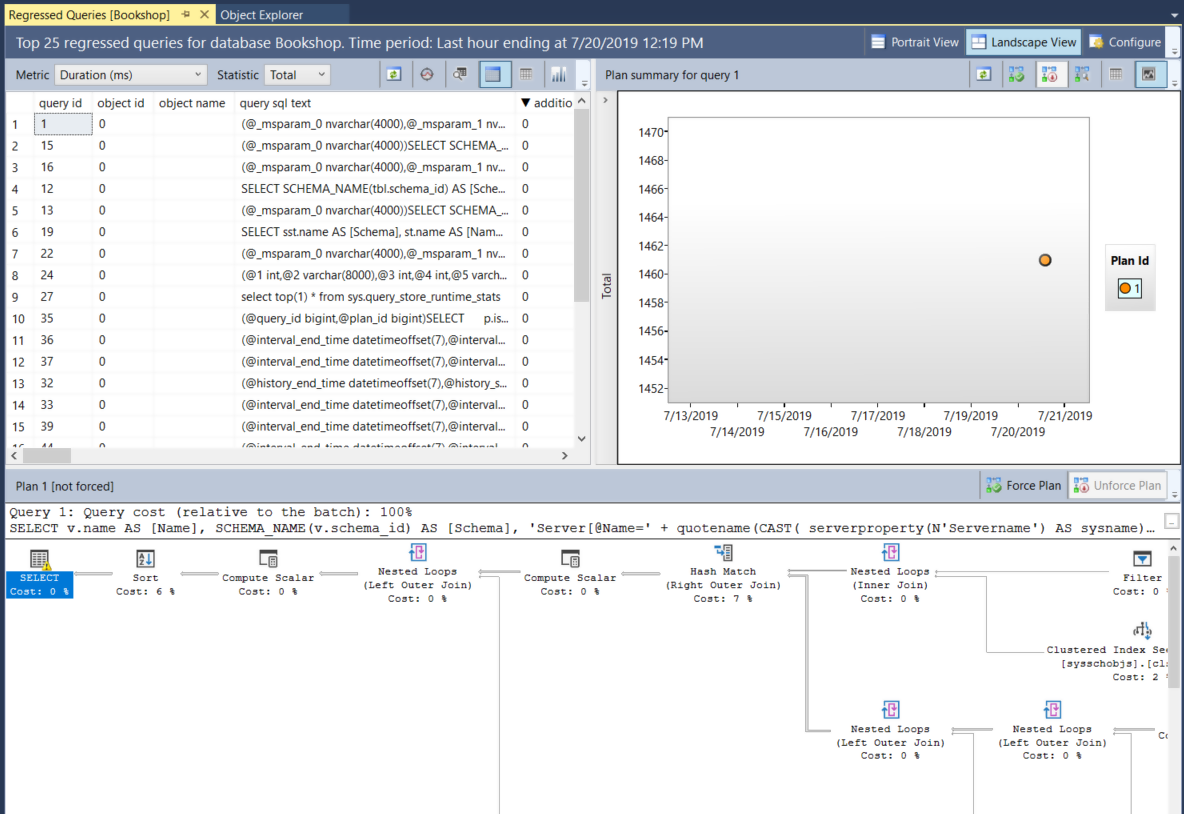
To view the regressed queries, right-click on the “Regressed Queries” option and then click “View Regressed Queries”. The following screen will appear:
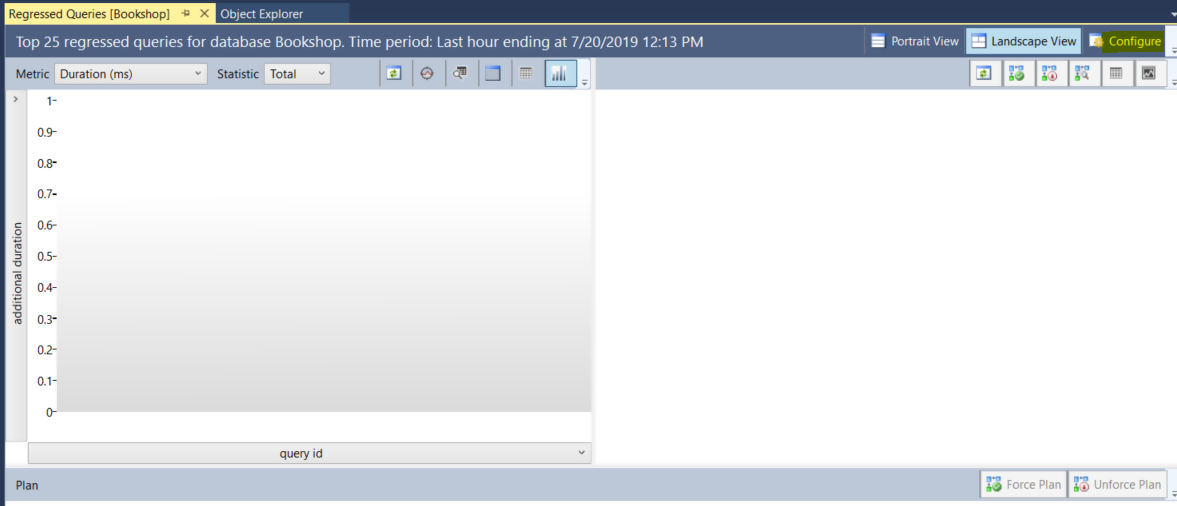
To configure the regressed query window, select the Configure option from the top right corner. The Configure options open the following window:
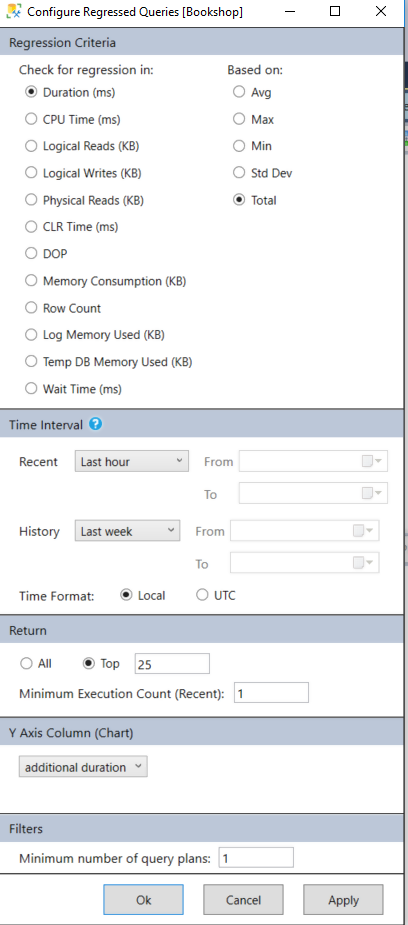
Here you can select the characteristics that you want to view for the regressed queries. For instance, the duration of the query, the Memory Consumption, Logical Reads and Writes etc. You can also set the Time Interval and the number of Queries to view.
It is important to note that if you do not see any query in the chart view, click on “View regressed queries in a grid format with additional details” as shown below.
You will see the details of the regressed queries as shown below:
You can see the query Id along with the detailed statistics regarding every query.
Overall Resource Consumption
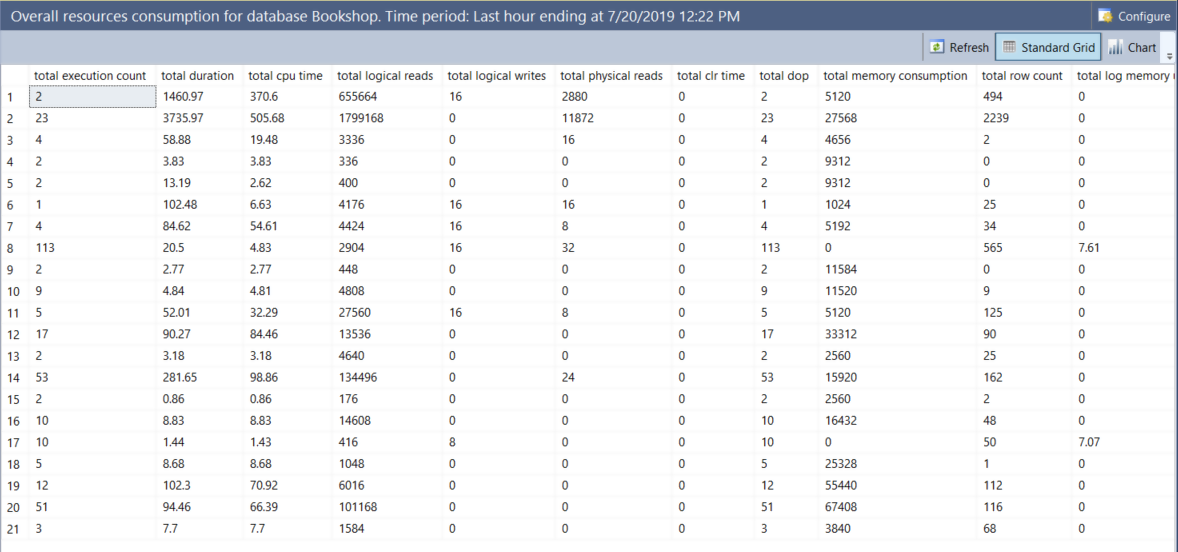
The overall resource consumption option shows an overall view of the resources consumed by the queries over a specific period of time. In the following screenshot, the overall resource consumption by all of our queries, executed in the last one hour is being shown.
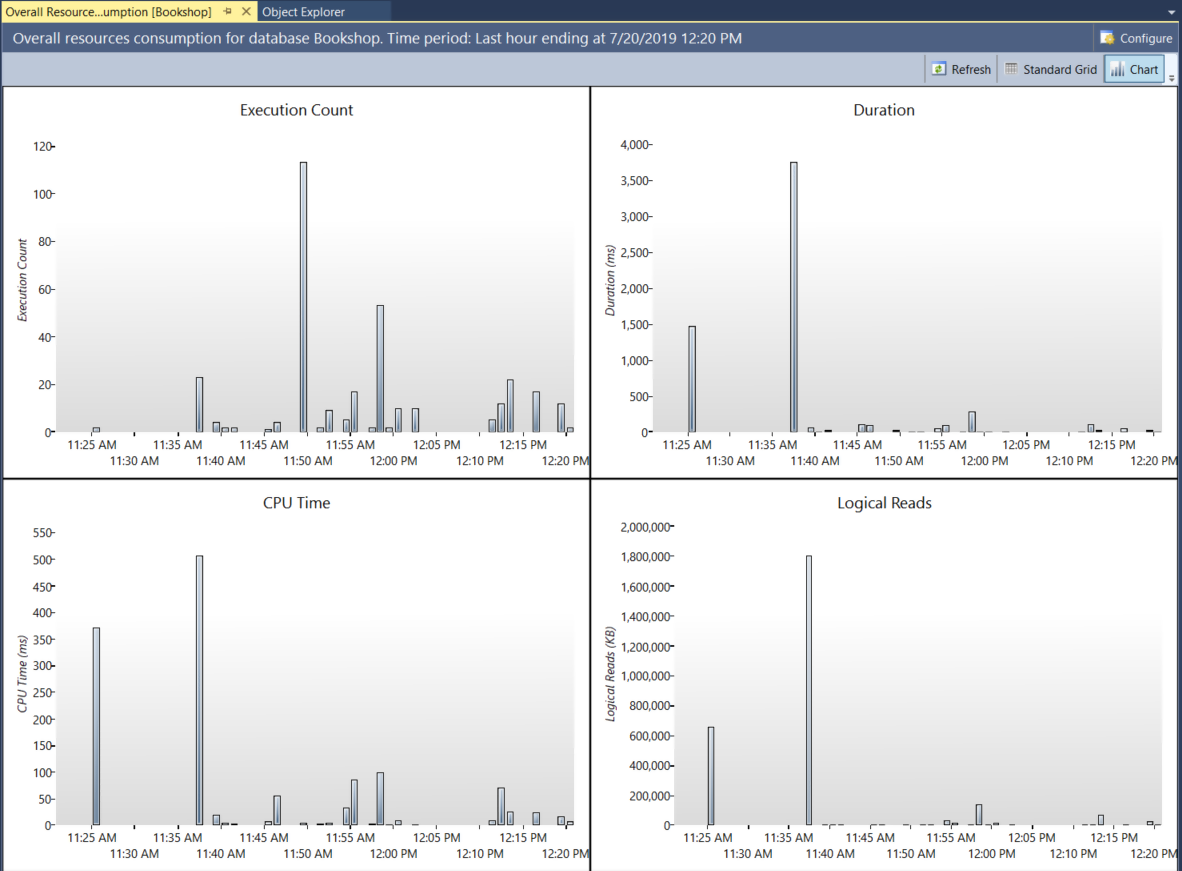
Here again, you can use the “Configure” option to specify the type of statistics you want to see, the time interval for which you want to see the statistics and the number of queries that you want to see in the report. If you click on the Standard Grid option from the top left menu, you will see the overall resource consumption in a grid format as shown below:
Top Resource Consumers
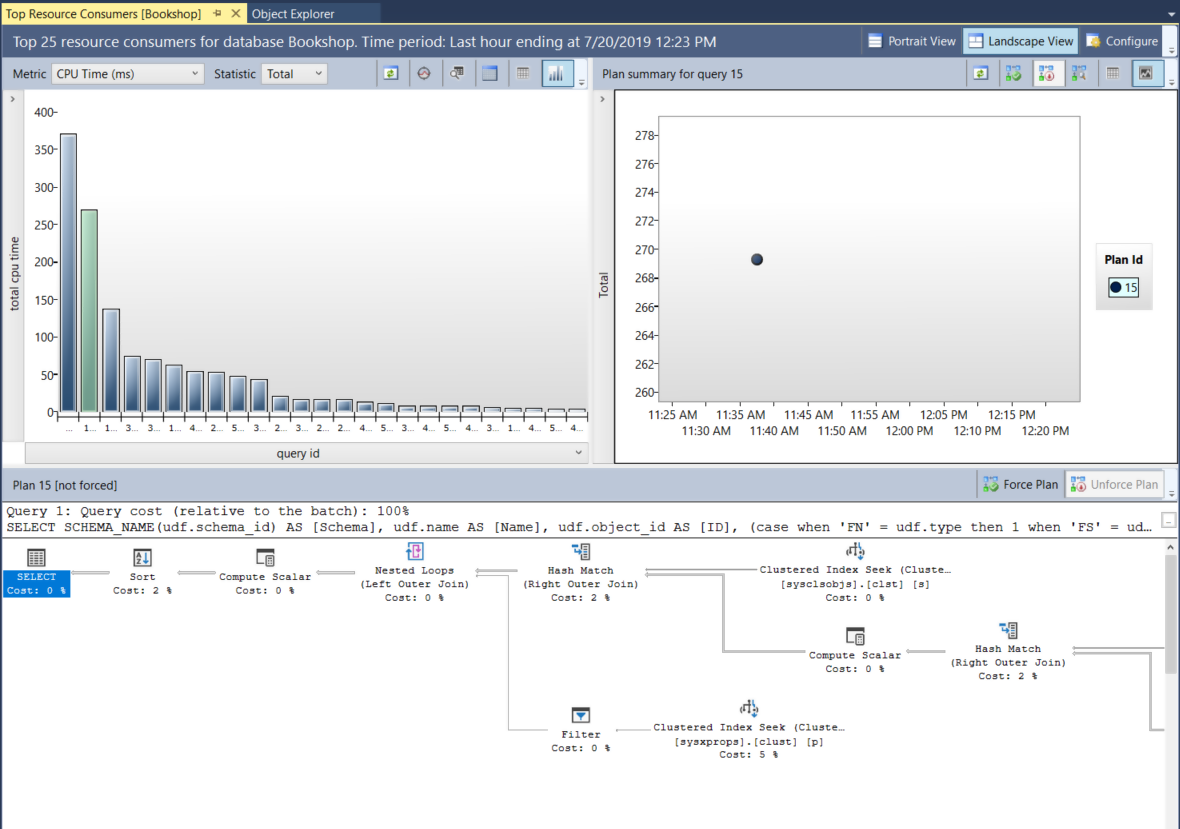
Top resource consumers, as the name suggests are the queries that consume the most resources. By default, information about 25 most resource consuming queries are displayed. As shown below, it shows the CPU time for the highest resource consuming queries for the last hour.
Again, you can use the “Configure” option to change the statistics. Another option is to click on “Metric” in the top right of the window and to change the performance metric for the queries.
If you hover over a query, you can see the details of the query as shown below:
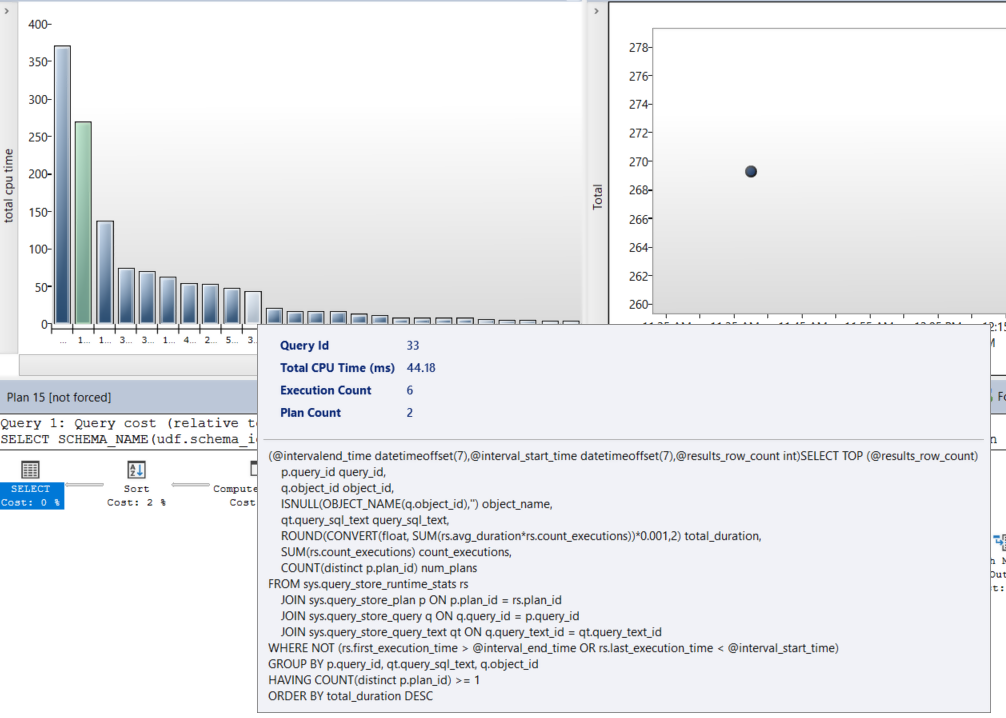
Since we do not have any queries with a forced plan, if you select “Query with Forced Plans” option, you will not see anything.
Queries with High Variation
This feature was introduced in 2017. Queries with high variations are the queries with the most variation between different performance metrics. For example, sometimes they take more CPU cycles and times to execute and sometimes they execute fairly quickly. Such queries have parameterization problems. It is important to locate and correct such queries. The following screenshot displays information about queries with high variation.
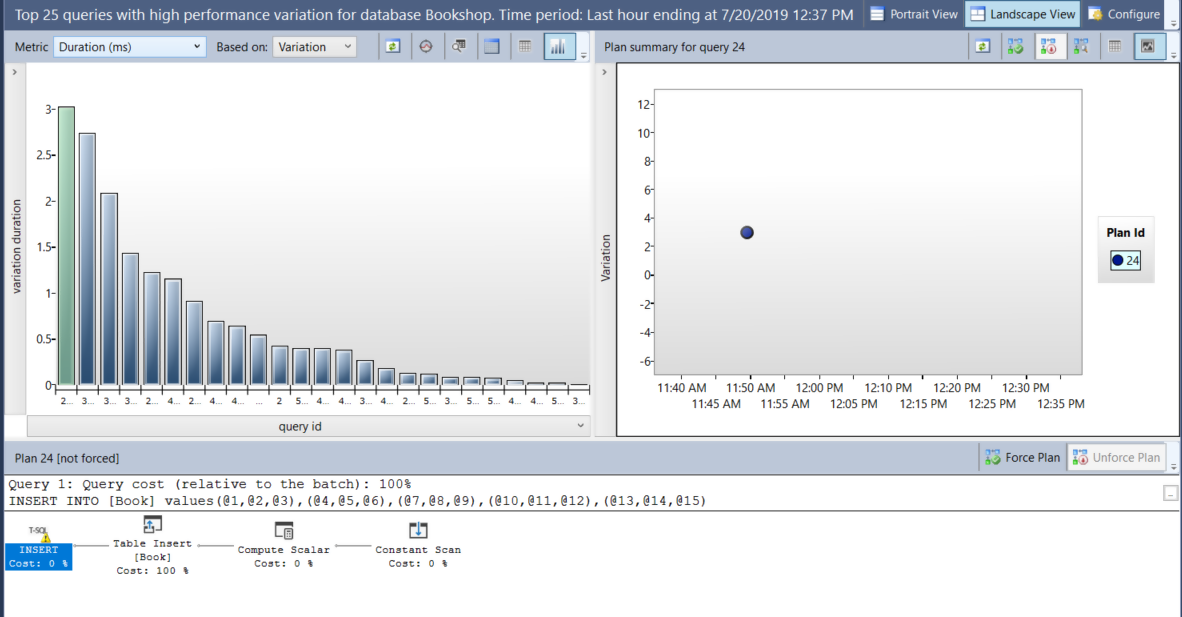
You can hover over the query and see the details of the query.
Query Wait Statistics
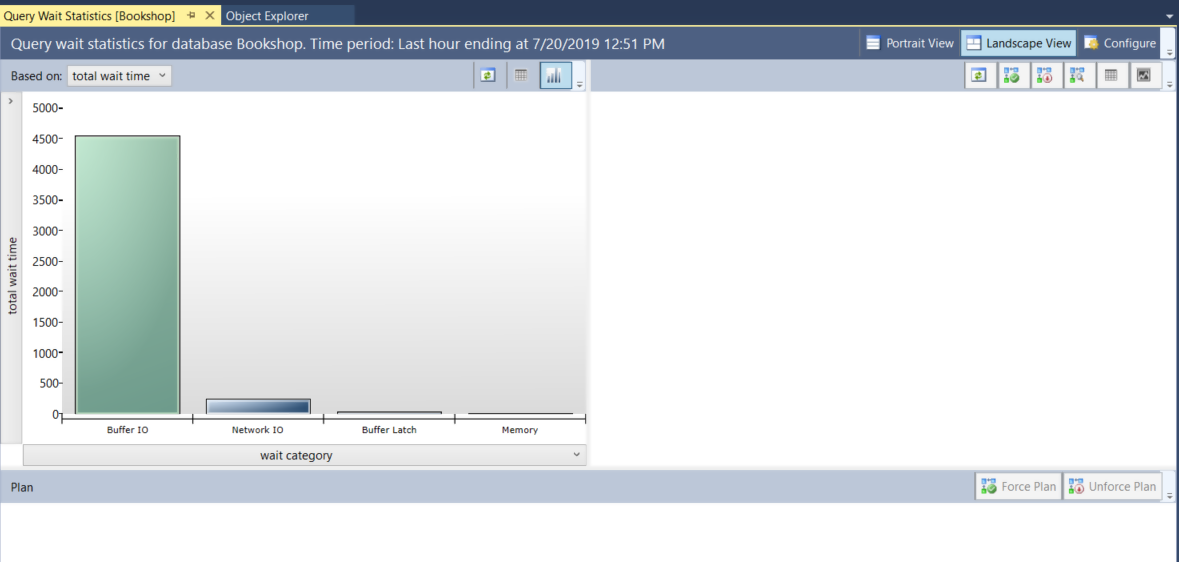
Query wait statistics contain information about how long a query had to wait because of different bottlenecks, before it gained access to the required database resources. The following figure contains a screenshot of query wait statistics.
Finally, “Tracked Queries” contains the queries that we have been tracking. If you want to keep track of any particular query, you can just add that query to tracked query and it will show up in tracked queries.
If you wish to learn more on Query Store in SQL Server, I would recommend going through these articles, SQL Server Query Store – Overview and Use cases for Query Store in SQL Server.
Conclusion
In this article, we saw how to enable SQL Server Query Store that can be used for the performance monitoring of SQL Server queries. We also saw different types of reports offered by the SQL Server Query Store.
Other great articles from Ben
| Understanding SQL Server case statement |
| How to use window functions |
| What is the Difference Between Clustered and Non-clustered Indexes? |
- Working with the SQL MIN function in SQL Server - May 12, 2022
- SQL percentage calculation examples in SQL Server - January 19, 2022
- Working with Power BI report themes - February 25, 2021

