
In this article, we are going to understand the various types of Power BI time calculations and how to implement these calculations. We will also understand the reason behind implementing such time-based calculations and the importance of these in the real world. The Power BI time calculations are also known as Time Intelligence functions that can be applied in DAX. There are a lot of functions available under Time Intelligence and you can read about it in detail from the official documentation from Microsoft.
Time Intelligence is an important methodology in Business Intelligence where analysts try to find out the progress or performance of metrics over a certain period of time. This period can be weeks, months, quarters, or even years. For example, a very common question that might arise from the Sales department is that – “How are our sales compared to the last year?”. This question gives an answer if the sales have increased over the last one year or have it been on a decline. If the sales have decreased with respect to the previous year, then the analysts might need to find out possible reasons why the sales went down.
A wide variety of Power BI time calculations are supported using DAX. You can see the entire list of time intelligence functions from the official DAX guide.
Pre-Requisites for Power BI Time Calculations
There are certain prerequisites that need to be taken care of before implementing the Power BI Time Calculations. These are discussed in the following section.
Setting up the dataset
For the purpose of demonstration, I am going to use the famous WideWorldImportersDW database. This is a sample database that is provided by Microsoft to try out new features related to the SQL Server family. You can download the backup of the database from GitHub and then restore it to your local instance of SQL Server.
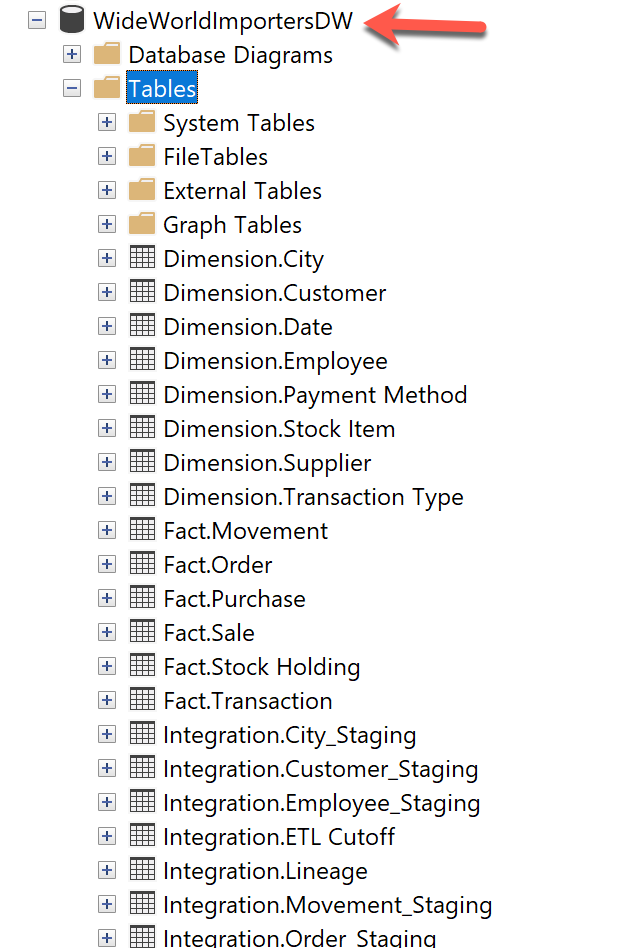
Figure 1 – WideWorldImportersDW Database Imported
Once the database is restored, you can see all the tables being available in the list like in the figure above.
Date Dimension Table
Another important requirement in order to get started with Power BI Time calculations is the date dimension table. The date dimension is a special table in data warehousing technology that contains uninterrupted date values for a few years. The number of years usually depends on the context of analysis; however, these dimension tables contain data from somewhere 30-50 years.
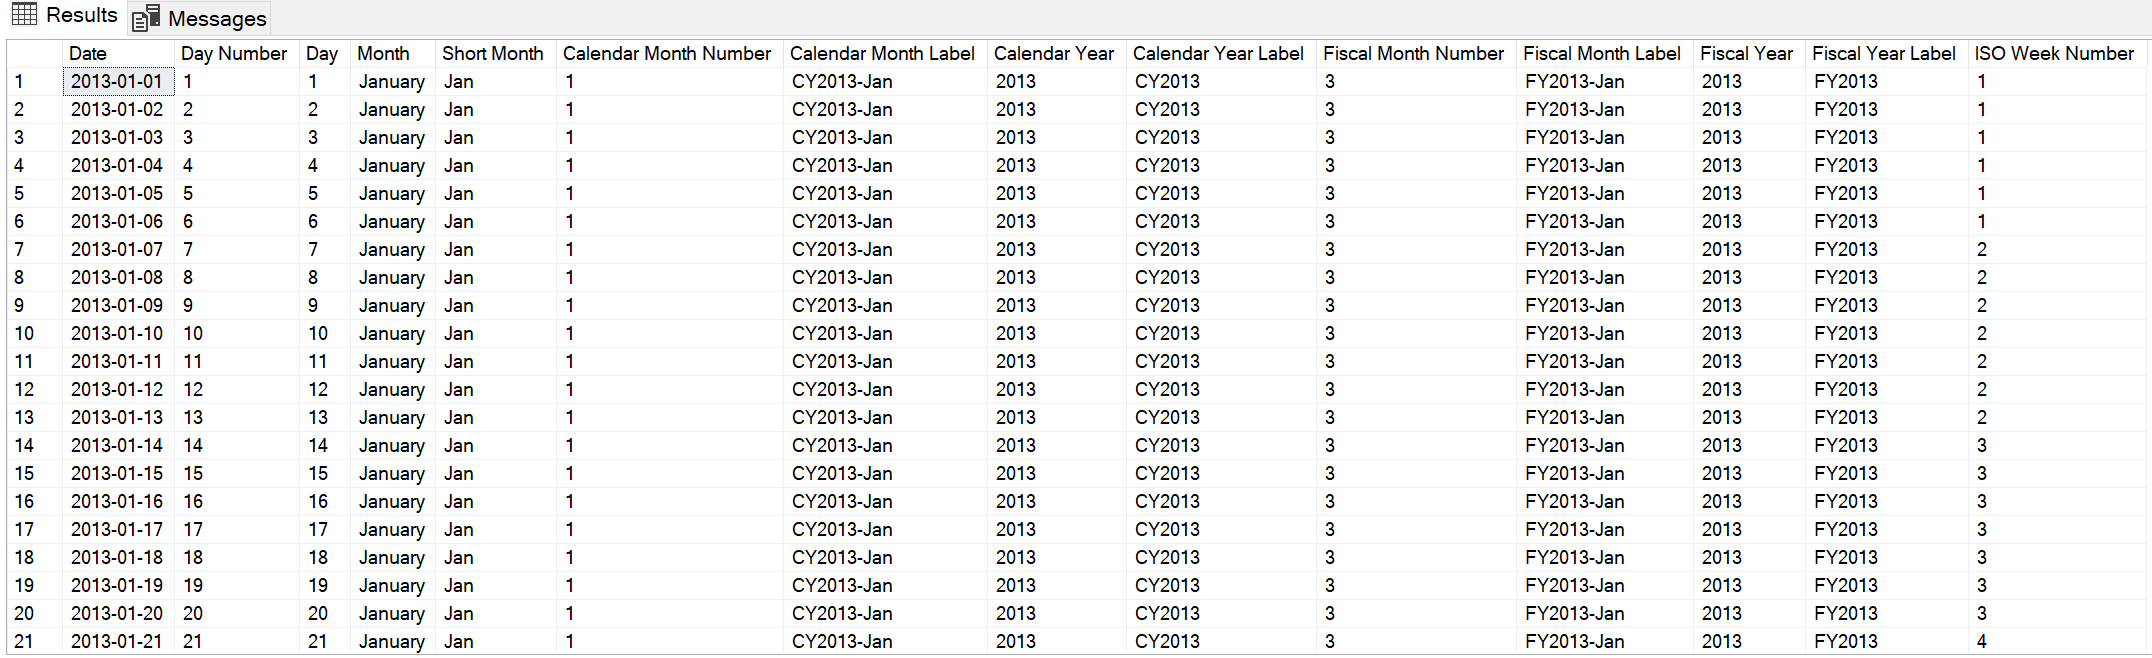
Figure 2 – Date Dimension Table
In the WideWorldImportersDW database, we already have a date dimension table “Dimension.Date” available that can be used to build the Power BI time calculations. This date dimension table contains the date start from 1st January of the starting year until the 31st December of the ending year.
Implementing Time Intelligence in Power BI
Now that we have some idea about what Time Intelligence in Power BI is, let us go ahead and start fetching data into a report and building the calculations. Open Power BI Desktop and bring in data from the following two tables.
- Dimension.Date
- Fact.Order
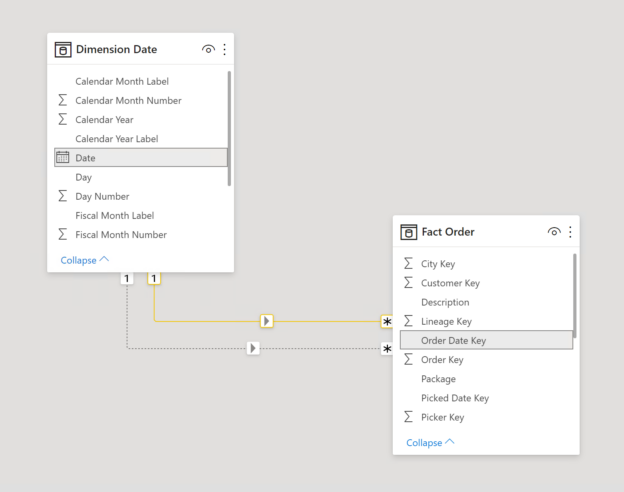
Once these two tables are imported into Power BI, you can check the data model and both the tables are joined using the date field.

Figure 3 – Power BI Data Model for Time Intelligence
As you can see in the figure above, both the tables are linked to one another using a one-to-many relationship between the Date and Order table.
Now that we have imported data into the Power BI model, let us prepare the visuals by creating a simple table from the following fields.
- Date from Dimension Date
- WWI Order ID from Fact Order
Once both these fields are imported, the table will look somewhat like this.
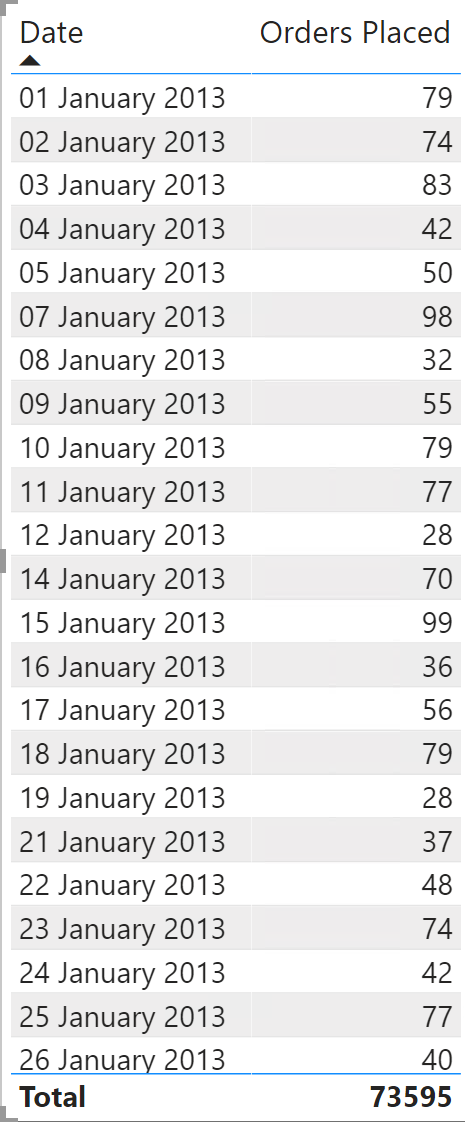
Figure 4 – Power BI Report Visual with Date and Orders
Calculating YTD, QTD and MTD
Now that our base report is completed, we are good to implement the Time Intelligence calculations in the report. For the purpose of this tutorial, I am going to create the following three measures in the period-to-date section.
- Year-to-date calculation – This is calculated from the beginning of the calendar year or the fiscal year up to the current date. It is helpful in order to analyse trends in the data over a period and also compare performance with other peers. For example, if I want to calculate the YTD sales on 31st May 2021, then all the sales from 1st January 2021 through 31st May 2021 would be aggregated and displayed
- Quarter-to-date calculation – This is almost like the YTD calculation that we have just discussed, except the fact that the starting day is the beginning of the current quarter instead of the current year. For example, all the sales starting from 1st April 2021 until 31st May 2021 will be aggregated in this case
- Month-to-date calculation – The Month-to-date calculation is used to aggregate the sales from the first day of the current month until the current day of analysis. For example, all aggregated sales starting from 1st May 2021 until 31st May 2021
Let us now implement these in Power BI. We are going to create three new measures in the Fact Order table for each of the above calculations as follows.
|
Function |
DAX Formula |
|
YTD |
YTD = TOTALYTD(DISTINCTCOUNT(‘Fact Order'[WWI Order ID]), ‘Dimension Date'[Date]) |
|
QTD |
QTD = TOTALQTD(DISTINCTCOUNT(‘Fact Order'[WWI Order ID]), ‘Dimension Date'[Date]) |
|
MTD |
MTD = TOTALMTD(DISTINCTCOUNT(‘Fact Order'[WWI Order ID]), ‘Dimension Date'[Date]) |
Once the three measures are created, including the measures in the table, and Power BI will calculate the respective measures based on the formula being used.
MTD
The MTD measure calculates the running total number of orders for each month and resets as the month ends.
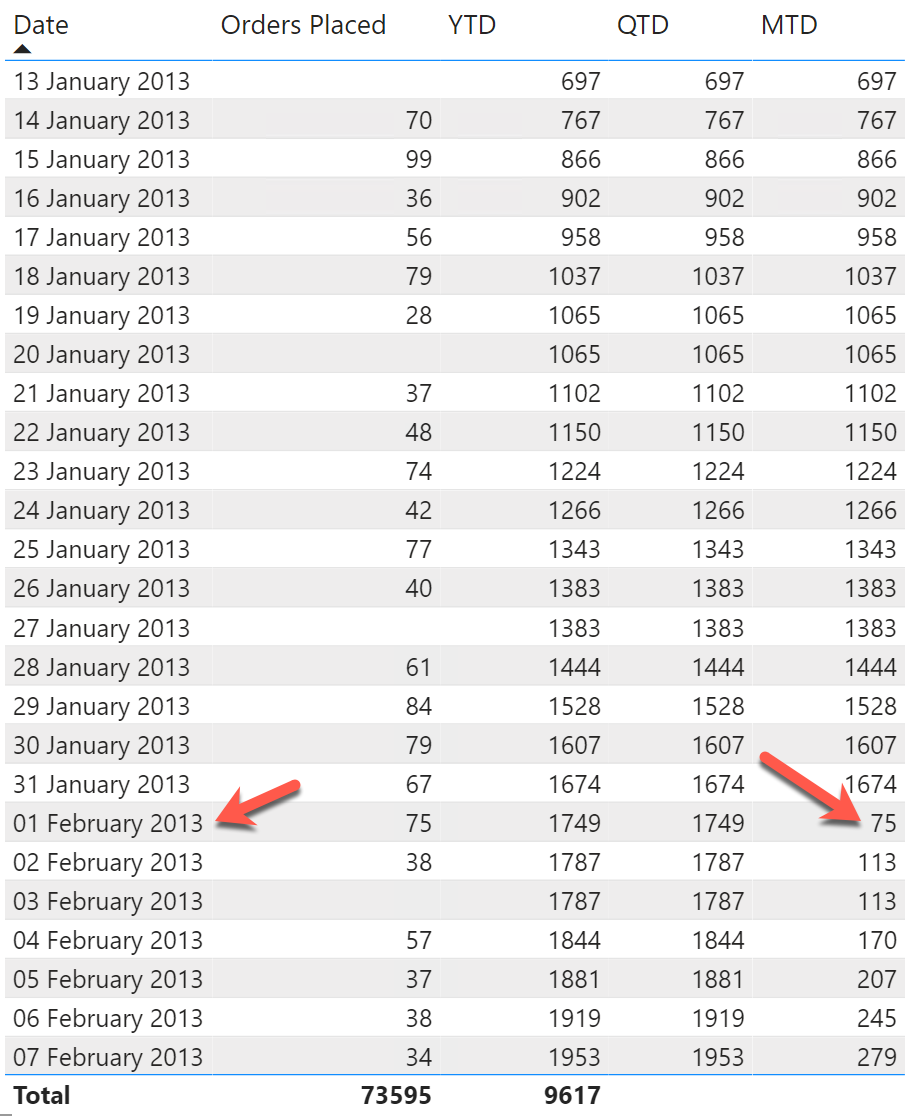
Figure 5 – MTD Calculation in Power BI
As you can see in the figure above, the values for MTD keeps on adding up for the month of January and then resets as February starts.
QTD
Similarly, for QTD, the values of the QTD column will keep on adding up for the entire quarter and as the quarter ends, the value will reset and start from the beginning.
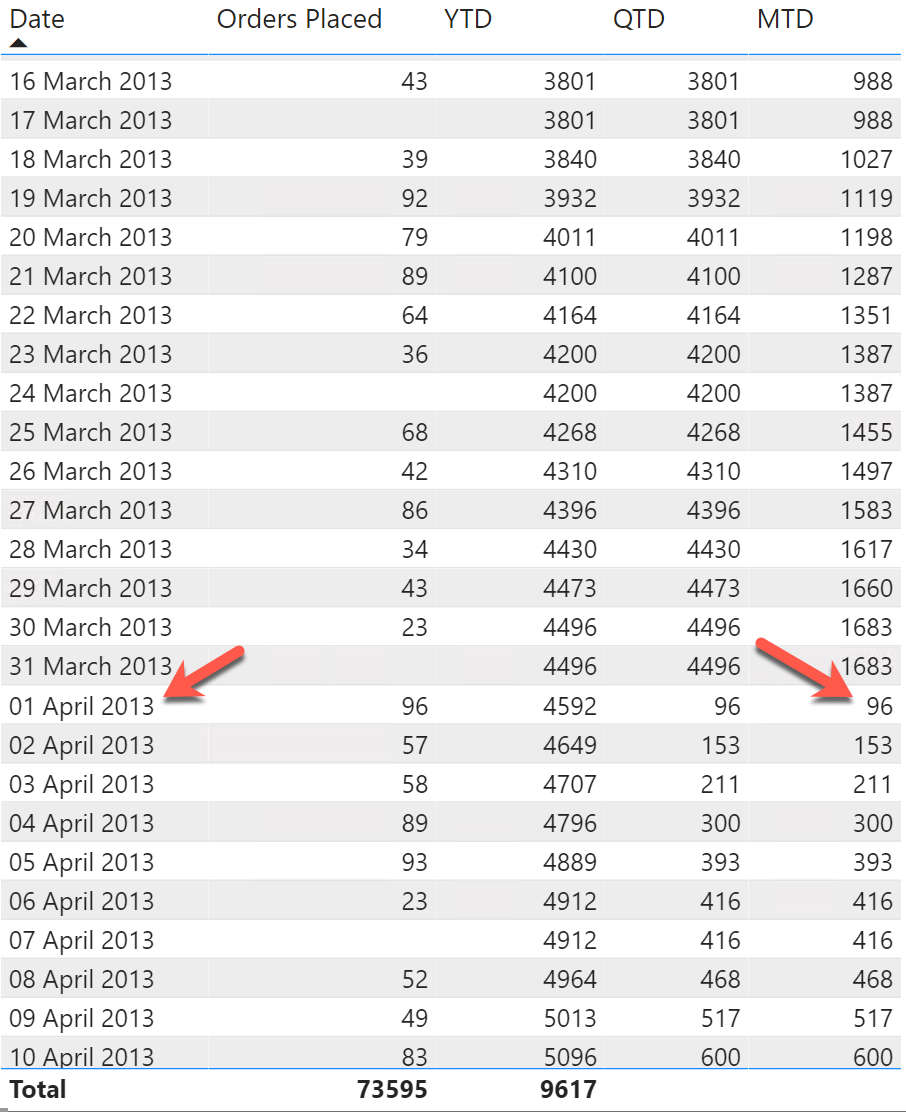
Figure 6 – QTD calculation in Power BI
In the above figure, it can be seen that the values for both the MTD and the QTD reset as both the month and the quarter reset after 31st March 2013.
YTD
For the YTD calculation, the counter resets at the end of the calendar year. During this, all the other measures for QTD and MTD will also be reset as both the quarter and the month will change.
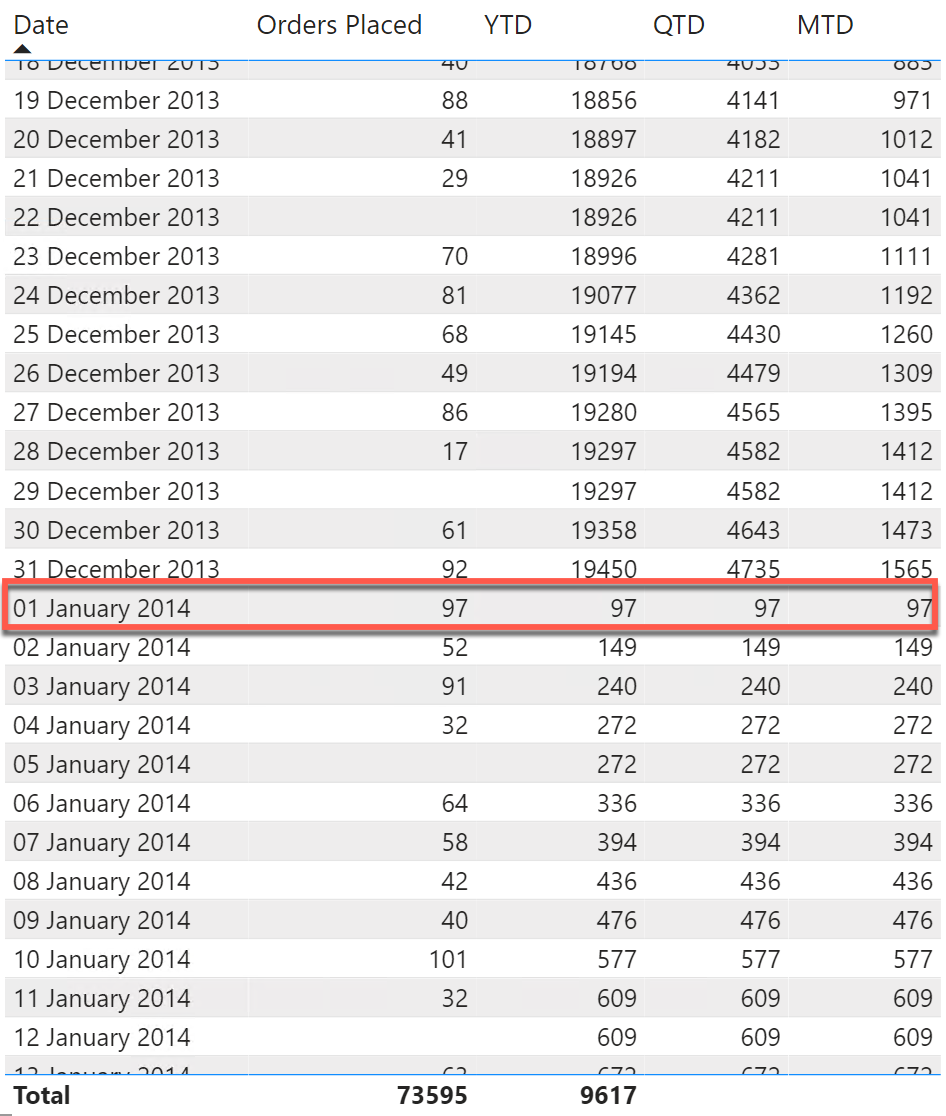
Figure 7 – YTD Calculation in Power BI
As you can see in the figure above, the year, quarter, and the month end on 31st December 2013 and hence the values for all the three measures are reset from 1st January 2014. This will be the same for each of the years, quarters, and months hereafter.
Conclusion
In this article, we have discussed in detail the implementation of Power BI Time Calculations. These date and time-based calculations are also known as time intelligence in the world of Power BI. There are many functions available in the time intelligence domain. However, some of the most used are comparisons over fixed time intervals like year on year, month on month, quarter over quarter, etc. In addition to that, there are also functions that provide Power BI time calculations like a year to date, quarter to date, and month to date. These calculations help us understand the performance of a certain metric with respect to a previous point or period in time and allows us to identify key points that will lead to better results.

He is a prolific author, with over 100 articles published on various technical blogs, including his own blog, and a frequent contributor to different technical forums.
In his leisure time, he enjoys amateur photography mostly street imagery and still life. Some glimpses of his work can be found on Instagram. You can also find him on LinkedIn
View all posts by Aveek Das
- Getting started with PostgreSQL on Docker - August 12, 2022
- Getting started with Spatial Data in PostgreSQL - January 13, 2022
- An overview of Power BI Incremental Refresh - December 6, 2021