
SQL Server Profiler
SQL Server Profiler is a monitoring tool that you can use to create and manage SQL Server traces for monitoring SQL Server instance activity. These trace files can later be analyzed and replayed. Profiler has a graphical interface, which makes it easy to use
Besides auditing actions that happened on a SQL Server instance, it is useful for SQL Server performance troubleshooting, as it can track stored procedure and query execution and show the slow ones, capture statements and events that caused performance degradation, replay the specific set of events in another environment for testing purposes, etc.
To start SQL Server Profiler:
- Open Start, All Programs (Windows + C for Windows 8)
- Select SQL Server Profiler
Or
- Open SQL Server Management Studio
- From the Tools menu, select SQL Server Profiler
Or
- Open Command Prompt
- Type profiler
- Press Enter
Now, you should create traces that will collect the information you need in order to monitor and troubleshoot SQL Server performance
To create a new trace:
- In SQL Server Profiler, open File in the menu
- Select New Trace
- Select a SQL Server instance, Authentication Mode, and provide credentials
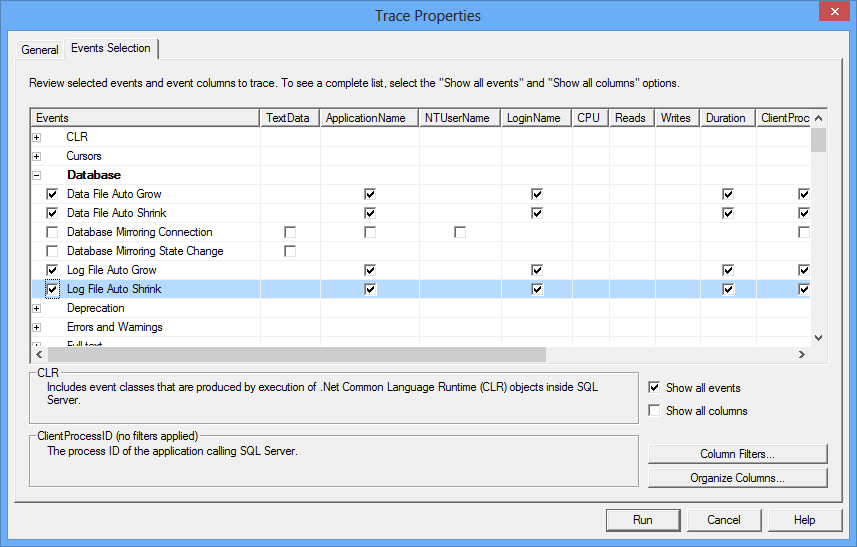
- In the Event selection tab, click Show all events
-
Select the events and event columns you want to trace
To capture information about events that occur on a database, e.g. data and log files auto-grow and auto-shrink events, select these events in Database event type

To trace various errors, such as CPU threshold exceeded, select this event in the Errors and Warnings EVENT type
- In the General tab, select whether to save the trace to a file or to a table
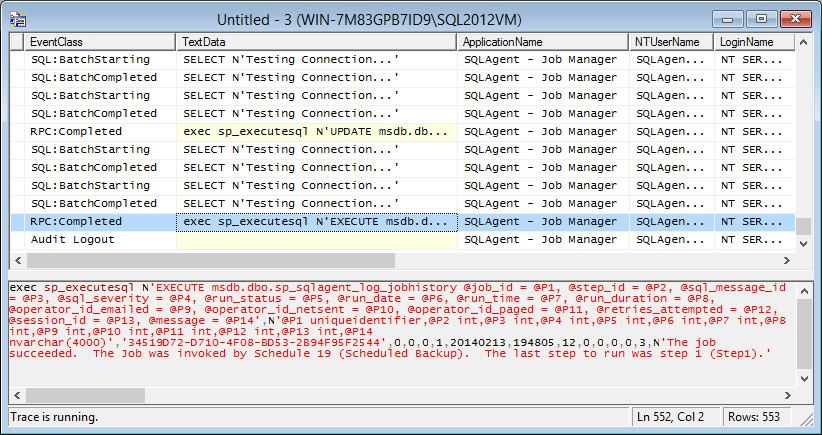
- Click Run
All events that belong to the event types selected for tracing will be captured
Although SQL Server Profiler provides a lot of useful information, some DBAs avoid using it on a production server, as it can add significant overhead. Also, if you haven’t configured SQL Server trace collection property to collect just the information you really need for analysis, there will be plenty of collected data which might be difficult to analyze
Windows Performance Monitor
Windows Performance Monitor is a monitoring tool shipped with Windows. It tracks various performance counters and monitors overall system and application performance. The counter values are shown in real-time graphs and can be saved in log files and used for later analysis
Windows Performance Monitor provides a wide range of counters. Monitoring too many counters will affect system performance and make analysis difficult, so it’s necessary to determine monitoring goals first, and then select the counters to monitor. A well-selected set of counters provides enough information for useful conclusions, quick diagnosis, and finding the problem origin, therefore efficient problem solving. Capturing too little or wrong counters will not provide enough information for useful conclusions, might be misleading and induce wrong conclusions
When it comes to selecting the counters, it’s necessary to understand what they represent, what are acceptable values, whether there is a threshold, or the value determined based on a trend line
To open Windows Performance Monitor:
- Open Start, Run (Windows + R for Windows 8), type perfmon, and press Enter
- Open Control Panel, System and Security, Administrative Tools, and click Performance Monitor
To add a counter:
- Select Add Counters in the context menu, or click the Add icon in the menu
- Select the computer you want to monitor
In the list of available counters, select the counter group e.g. MSSQL$2012:Buffer Manager and then Lazy writes/sec
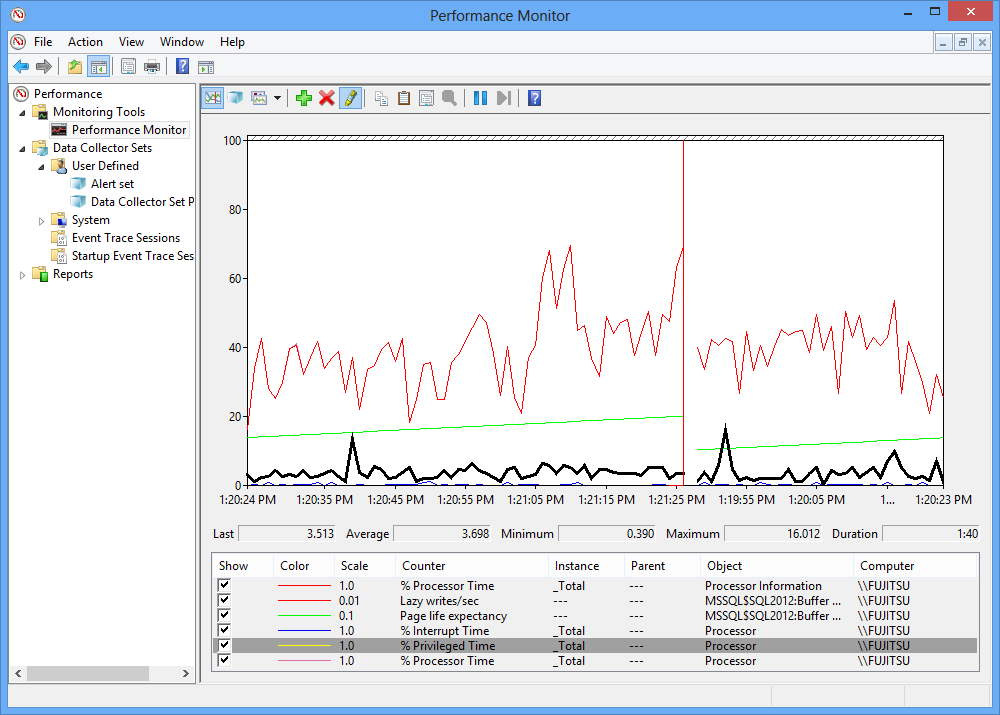
Windows Performance Monitor shows useful information in comprehensive real-time graphs and can save historical data for a long time, so it can be used for later analysis. Its disadvantages are that it cannot provide sufficient information for deep analysis nor show a trend line or a threshold in the graph
SQL Server Activity Monitor
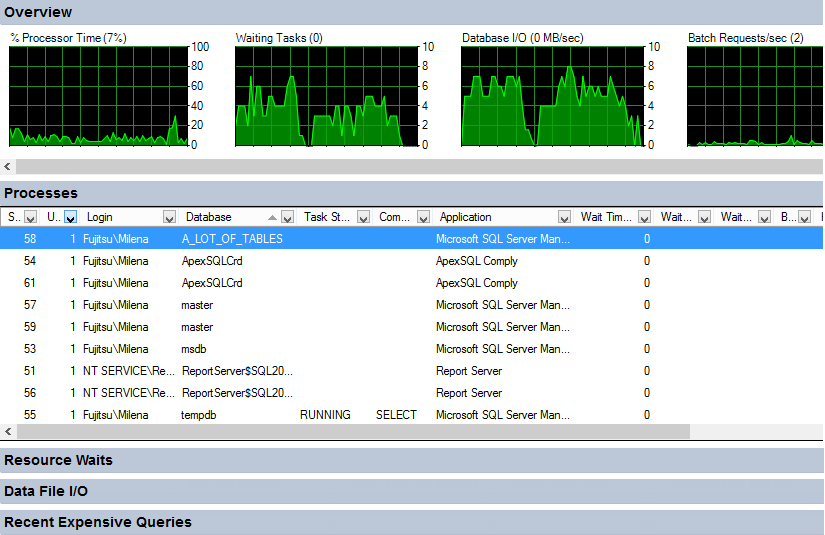
SQL Server Activity Monitor is a feature available in SQL Server Management Studio, useful for quick and basic SQL Server activity monitoring. It shows only information about the SQL Server processes and their effect on SQL Server performance
It shows % Processor Time, Waiting Tasks, Database I/O, and Batch Requests/sec in the Overview pane; the list of currently running processes on the SQL database in the Processes pane; the information about waits for resources in the Resource Waits pane; a list of all databases on the SQL Server instance along with information about the database files, their paths, and names in the Data File I/O pane, and the list of the queries recently executed that use most of memory, disk, and network resources in the Recent Expensive Queries pane
To start Activity Monitor, right-click the SQL Server instance in Object Explorer and select Activity Monitor
Activity Monitor cannot provide data for deep investigation, store historical records for later analysis, nor can additional parameters be monitored
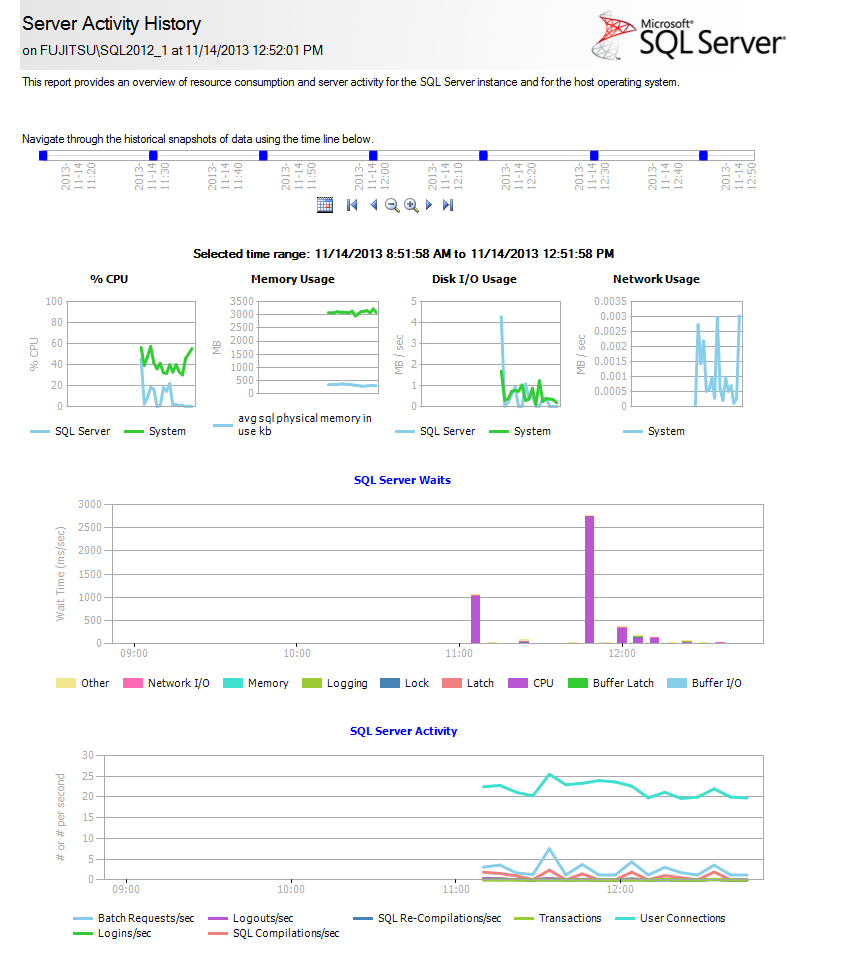
SQL Server Data Collector
SQL Server Data Collector is another SQL Server Management Studio feature that can be used for SQL Server performance monitoring and troubleshooting. It’s available in SQL Server 2008 and later. Data Collector can collect performance metrics on multiple SQL Server instances and store them in a single repository. Data is collected based on the specification used. There are three built-in specifications that provide automatic collection of the most common performance metrics – disk usage, query statistics, and server activity. Custom data collector specifications can be created, but it requires coding. Data collection is possible only if SQL Server Agent is running and Management Data Warehouse is configured
To open Data Collection reports
- In SQL Server Management Studio Object Explorer, expand Management
- Right-click Data Collection and select Reports
Select any of the available reports – Server Activity History, Query Statistics History, or Disk Usage Summary
Dynamic Management Views (DMVs)
Besides the monitoring utilities available in Windows and SQL Server Management Studio, Dynamic Management Views (DMVs) can also be used to monitor SQL Server performance and troubleshoot issues. These views are: sys.dm_exec_sessions, sys.dm_os_performance_counters, sys.dm_os_memory_brokers, sys.dm_os_memory_nodes, sys.dm_exec_procedure_stats, sys._dm_os_sys_info, sys.dm_exec_requests, sys.dm_exec_requests, and many more
We’ll present only a few commonly used views for SQL Server performance monitoring in this article
sys.dm_exec_sessions – returns a row for every session on the queried SQL Server instance, along with details such as the name of the program that initiated the session, session status, SQL Server login, various time counters, and more
sys.dm_exec_requests – returns a row for every user and system request being executed on the SQL Server instance. To find the blocked requests, search for the requests where the status column value is ‘suspended’
sys.dm_exec_query_stats – returns a row for every query statement in a cached query plan. It provides information about average, minimal, maximal, and total processor time used by the plan, along with other useful information for performance analysis
sys.dm_os_performance_counters – returns a row for each SQL Server performance counter. It provides a quick way to find out current performance counter values. However, there are five counter types, and to be sure you’re interpreting the returned values correctly, you have to know how to calculate a value for each counter type. It’s easiest with the counter type 65792, as no calculation is needed. Counter types 1073874176, 537003264, and 272696576 require additional calculation in order to provide the metric current value
If the values are not properly calculated, they can be confusing, misleading, and lead to wrong conclusions
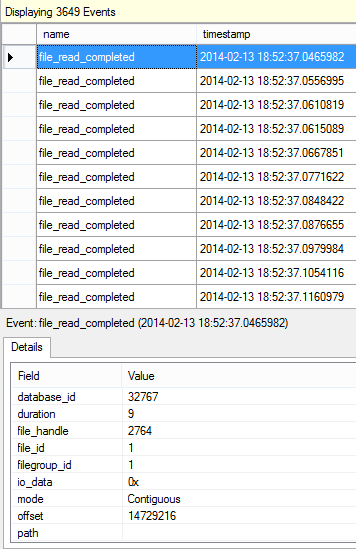
SQL Server Extended Events
SQL Server Extended Events allow collecting information useful for troubleshooting SQL Server performance issues. They enable finding the most expensive queries, latch, deadlock, and blocking causes, troubleshooting excessive processor usage, and more
To use Extended Events for performance monitoring, determine which events you want to monitor, and create a session using SQL Server Management Studio options, or T-SQL
To create the ReadWriteActivity session to capture event data for completed file reads and writes, and write it from the log cache file to the physical log file:
|
1 2 3 4 5 6 7 8 9 |
CREATE EVENT SESSION ReadWriteActivity ON SERVER ADD EVENT sqlserver.file_read_completed, ADD EVENT sqlserver.file_write_completed ADD TARGET package0.asynchronous_file_target (SET filename = 'c:\PerfLogs\ExtELog.xel', metadatafile = 'c:\PerfLogs\ExtELog.xem') |
After the session is created, to start it:
- Expand Management in Object Explorer
- Expand Extended Events
- Expand Sessions
- Find the Event Session, right-click it and select Start
To see the live event data with its details, select Watch Live Data from the event context menu in Object Explorer
There is also the built-in system_health session started automatically at SQL Server service start up, which provides useful information for performance troubleshooting
In this article, we presented the SQL Server performance monitoring utilities available in Windows and SQL Server. The information they provide and knowledge required to use them varies. Some of them, like Activity Monitor, are easy to use and require no coding, but at the same time provide only basic information useful just to get the general picture. On the other hand, Extended Events can monitor and handle various run-time errors, resource bottlenecks, blocking, etc. But to get the most of them, coding is required
Table of contents
| A DBA guide to SQL Server performance troubleshooting – Part 1 – Problems and performance metrics |
| A DBA guide to SQL Server performance troubleshooting – Part 2 – Monitoring utilities |

She has been working with SQL Server since 2005 and has experience with SQL 2000 through SQL 2014.
Her favorite SQL Server topics are SQL Server disaster recovery, auditing, and performance monitoring.
View all posts by Milena "Millie" Petrovic
- Using custom reports to improve performance reporting in SQL Server 2014 – running and modifying the reports - September 12, 2014
- Using custom reports to improve performance reporting in SQL Server 2014 – the basics - September 8, 2014
- Performance Dashboard Reports in SQL Server 2014 - July 29, 2014