

This article will drive you through the way to create alerts on an Azure Synapse instance to receive notifications based on various monitoring criteria that are met.
Introduction
Data repositories usually have continuous activity in terms of transactions, data loads, data reads, data optimization, etc. Administrators typically need to monitor the state and health of data repositories by analyzing metrics. While administrators monitor data repositories on schedule, the usual practice is to set up notifications for critical metrics so that when they cross a certain threshold, the response group is notified of the event immediately so that they can take corrective actions. Azure Synapse is Microsoft’s data warehouse offering on the Azure cloud. Like any other data warehousing system, it is expected to host and service large volumes of data, which translates to lots of data activity on the data warehouse. Azure Synapse supports monitoring metrics, data logs, and settings up alerts to monitor different metrics. In this article, we will learn how to create alerts on the Synapse instance to receive notifications when certain metrics cross a threshold or when certain monitoring criteria are met.
Pre-requisites
Before we start the actual exercise of creating an alert in Azure Synapse, we need a few basic things in place. Firstly, we need to have an instance of Azure Synapse workspace created. Once the workspace is in place, open the Azure Synapse Studio and create at least one dedicated SQL pool with some sample data in it. This would emulate the situation of hosting data and having activity on this data which would result in the generation of some metrics. Once this is in place, we have sufficient pre-requisites to create an alert with enough metrics that can be used as the criteria for generating an alert.
Creating Alerts in Azure Synapse
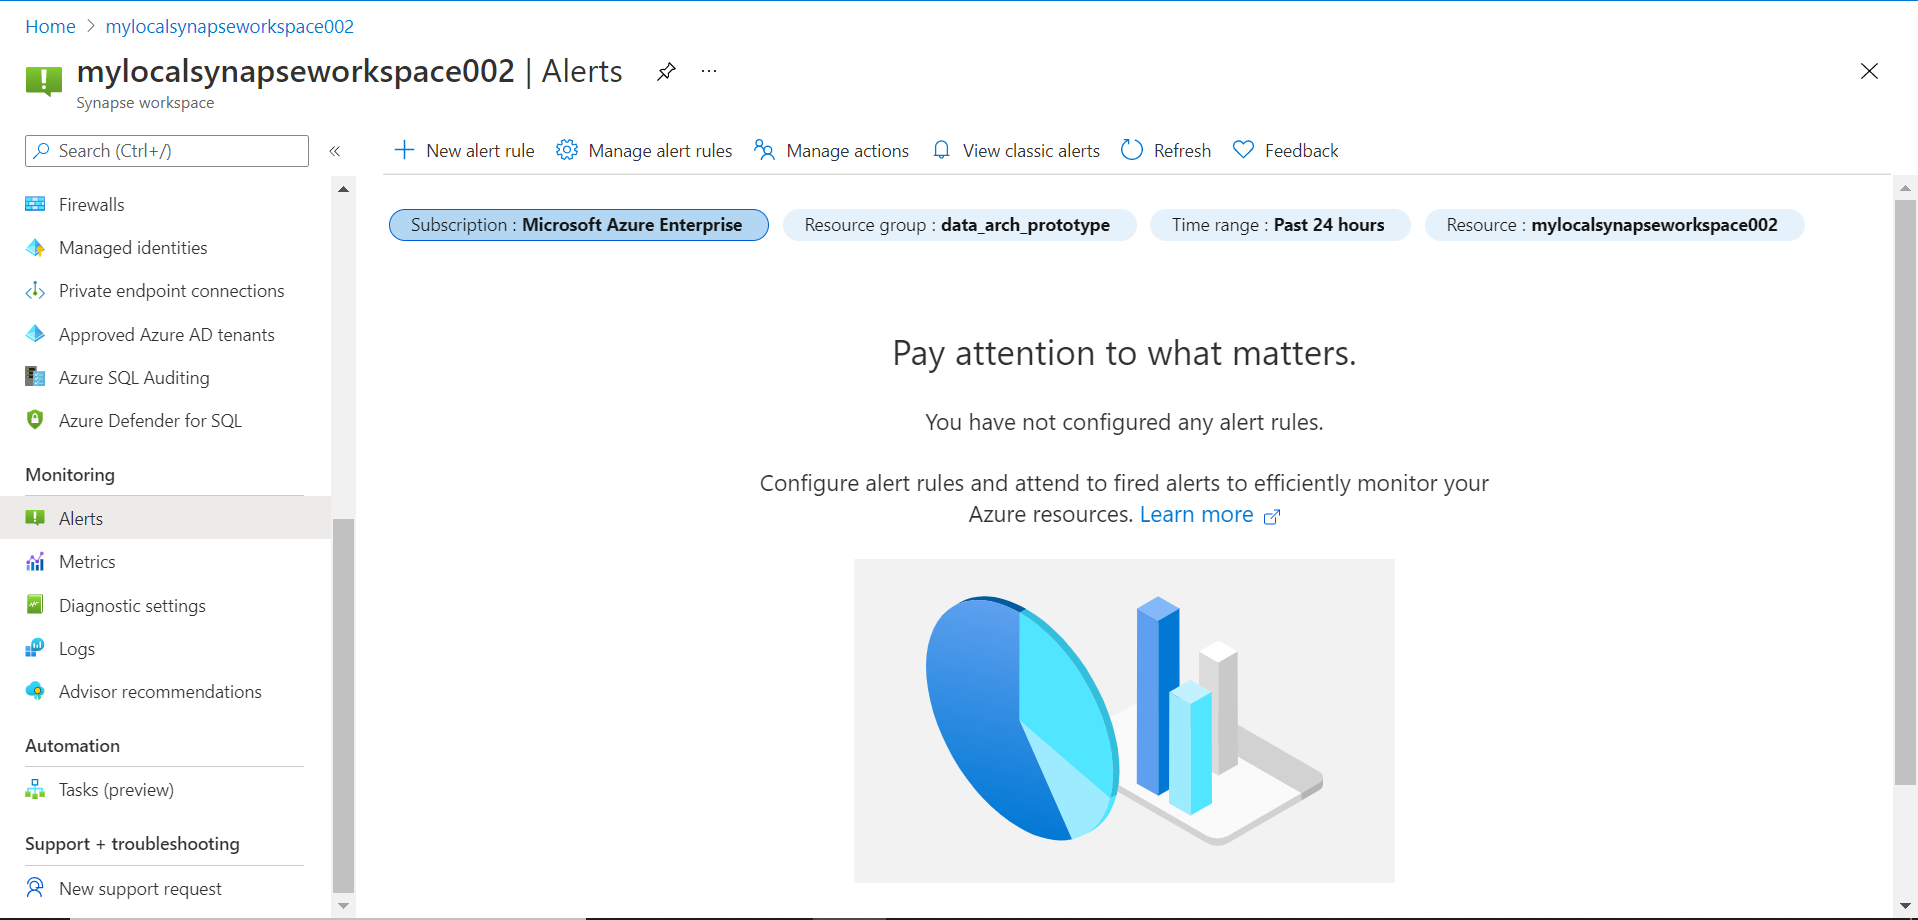
Assuming that the above setup is in place, navigate to Azure Synapse Studio and click on the Alert menu item under the Monitoring section as shown below. By default, there are no alerts created so we would see a blank screen as shown below.
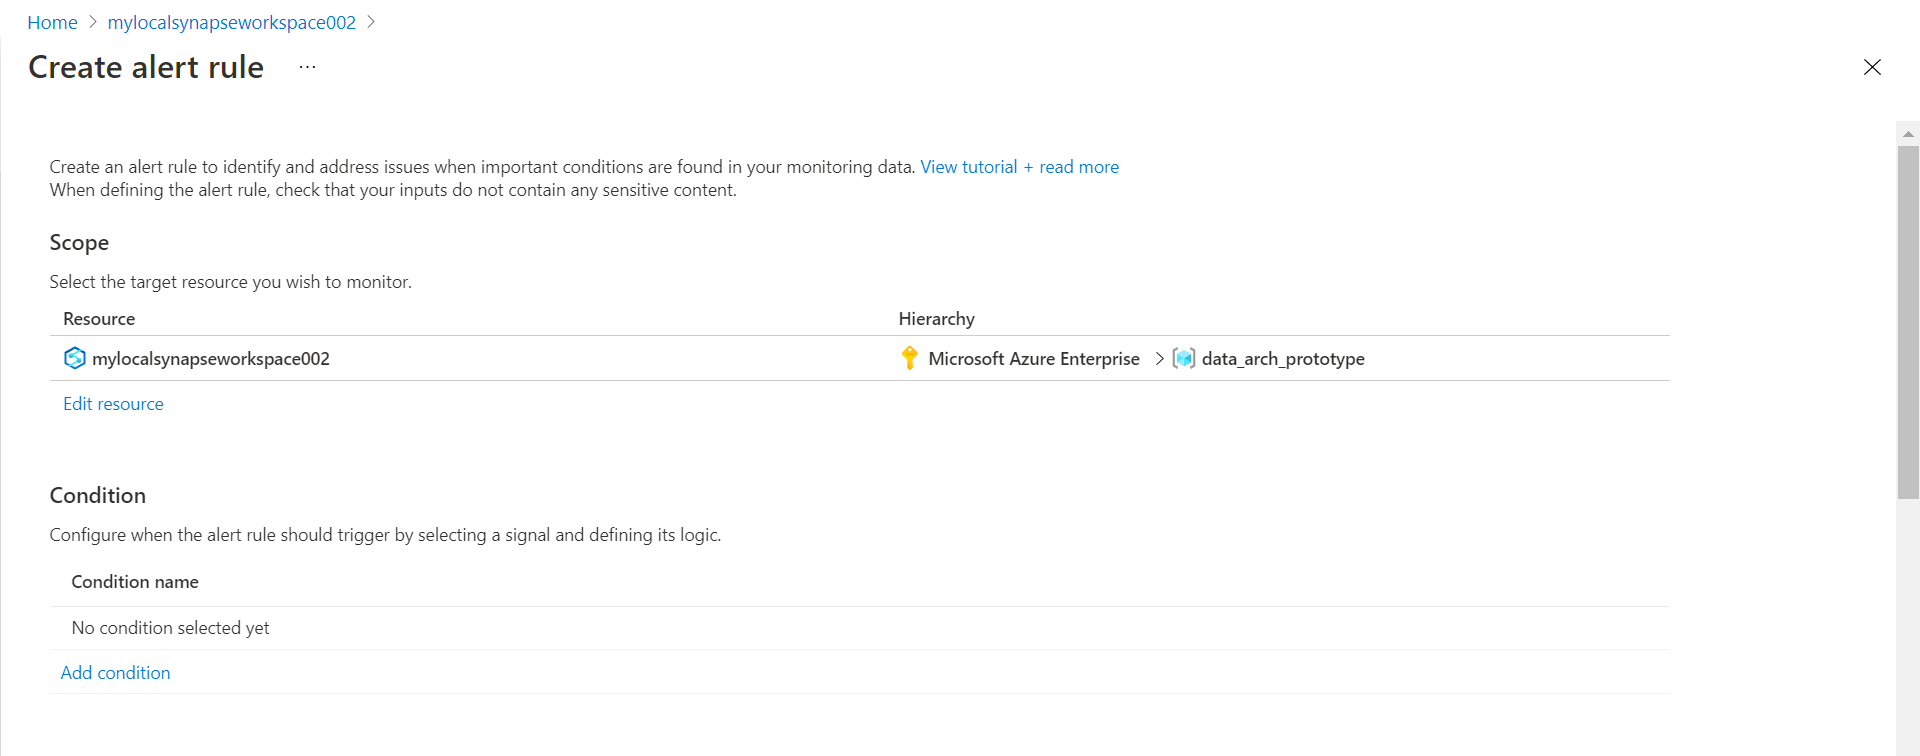
We can start creating an alert by clicking on the New alert rule button. It will open a new page with the details shown below. The scope of the alert here is limited to the workspace for which the alert is being created. It also shows the hierarchy of resource groups in which the workspace is located. We have the option to change it as well and navigate to another workspace if we intend to create an alert for another one. For now, we will continue with the default values for the scope.
The next step is to create a condition when the alert should be raised. No conditions are selected or created by default, so we can click on the Add condition button to create a new criterion for the alert. Once we click this button, it will pop-up a list of metrics and log values which are known as signals in the Azure diagnostics terminology. We can select one or more signals from this list.
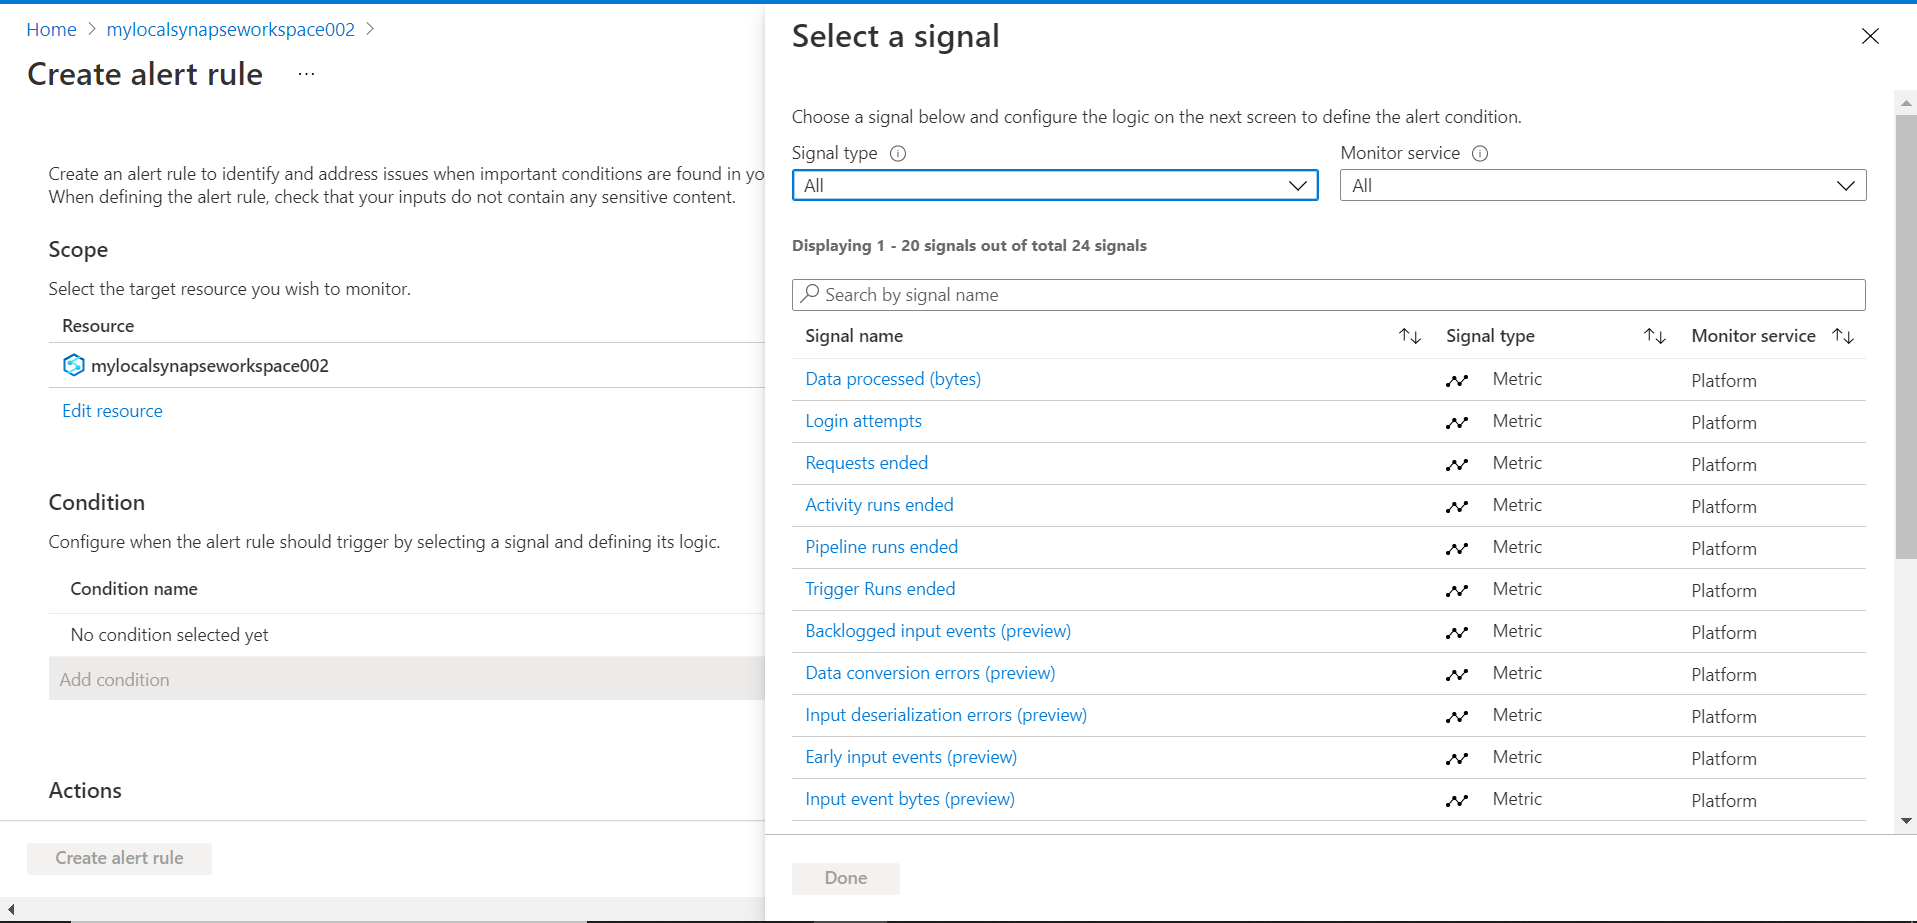
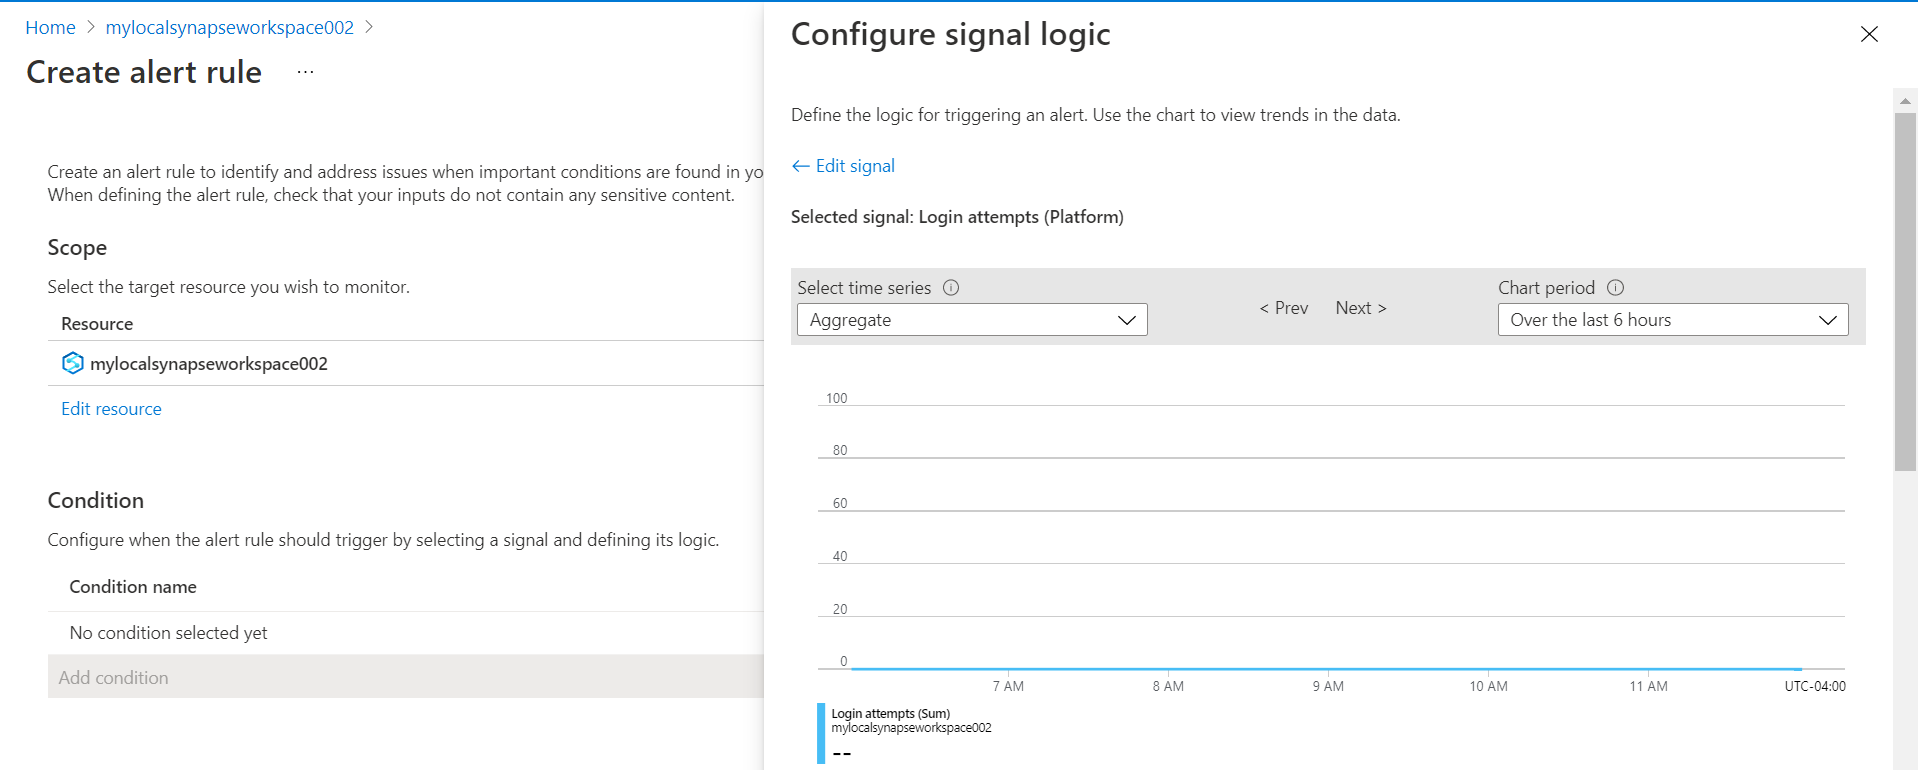
Let’s say we intend to get an alert whenever someone logs on to the Azure Synapse instance. For this, we can use the Login attempts signal. Click on this signal and it will provide options to configure the signal as shown below. Here it shows the number of login attempts in the past 6 hours by default. This dashboard provides some insight into the threshold value one may want to set for the given signal.
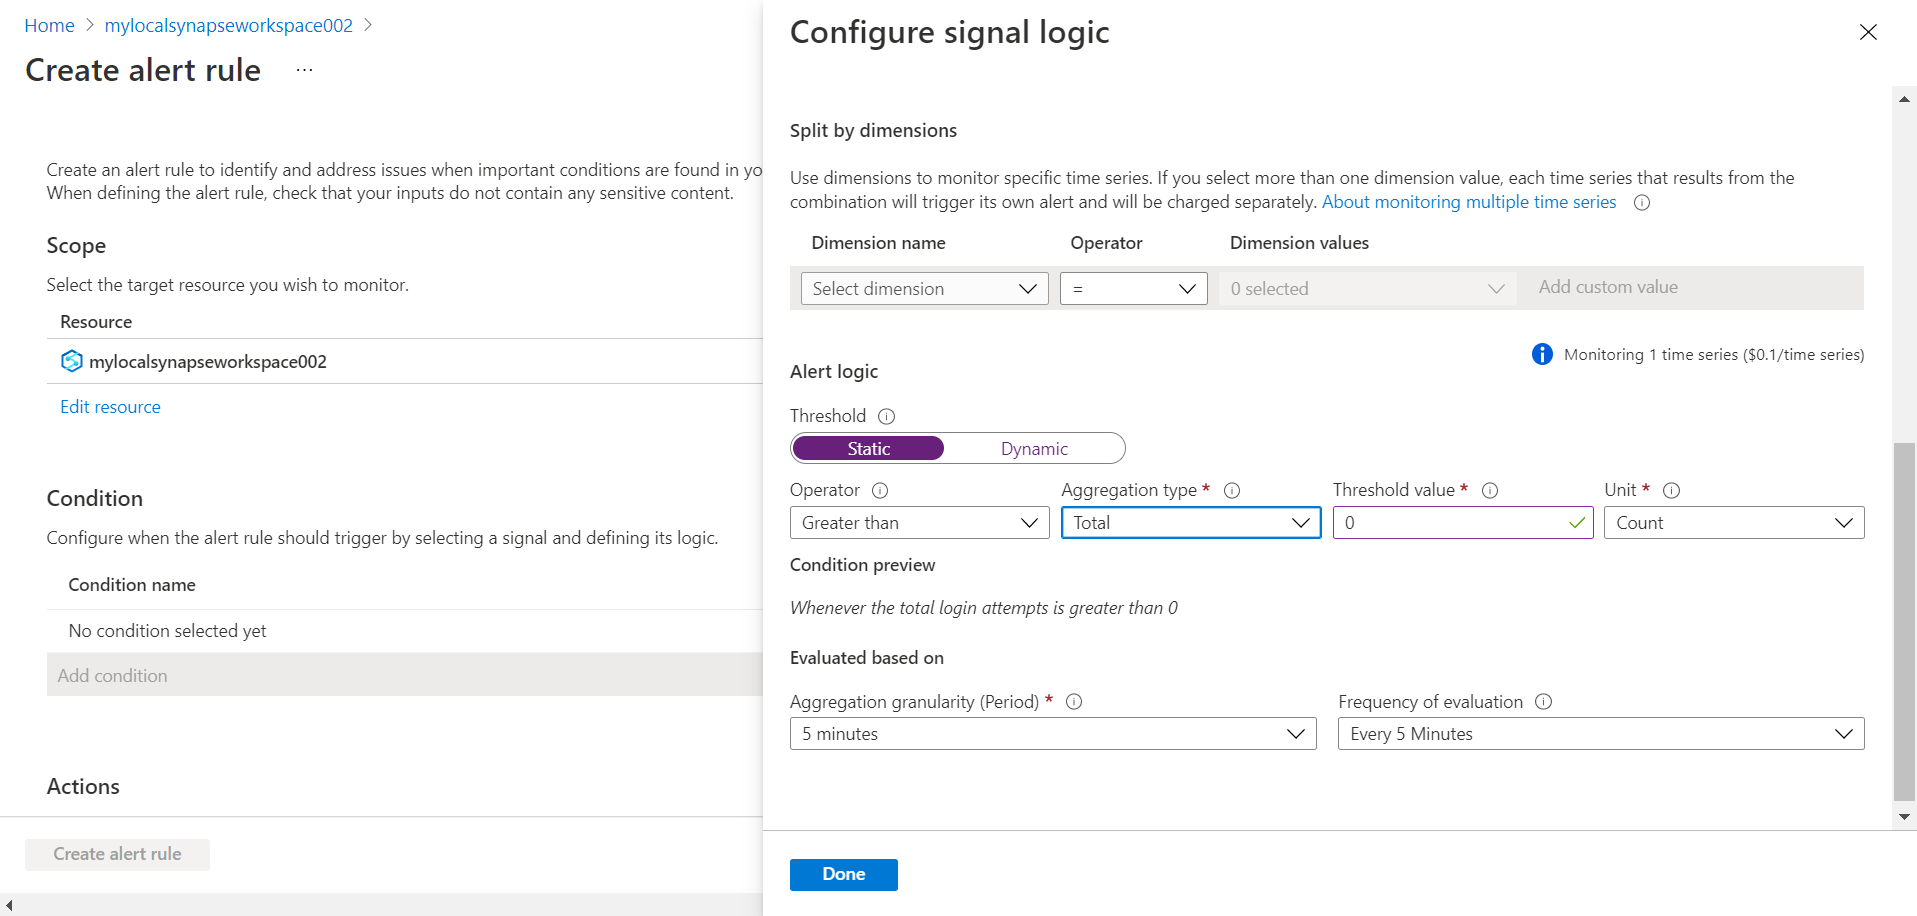
Scroll down and you would find the interface to configure the criteria. We have the option to select a specific dimension to monitor signals by specific time series. But it should be kept in view that each of these would cost extra as shown below. We can set the alert logic to static as well as a dynamic value by clicking on the static and dynamic tabs. For now, we would focus on setting a threshold using a static value. Let’s say we intend to receive an alert whenever any login attempt is made, we can set the threshold value to be greater than zero as shown below. So, in this case, we can expect to receive an alert for every login attempt. Once the configuration is done, we can click on the Done button and the criteria will be saved.
Once the alert rule has been created and added, you would be able to see it as shown below. Also, keep in view that this alert rule would cost $0.10 per month. While this cost is trivial, having too many alerts may result in cost and may have some impact on performance as well.
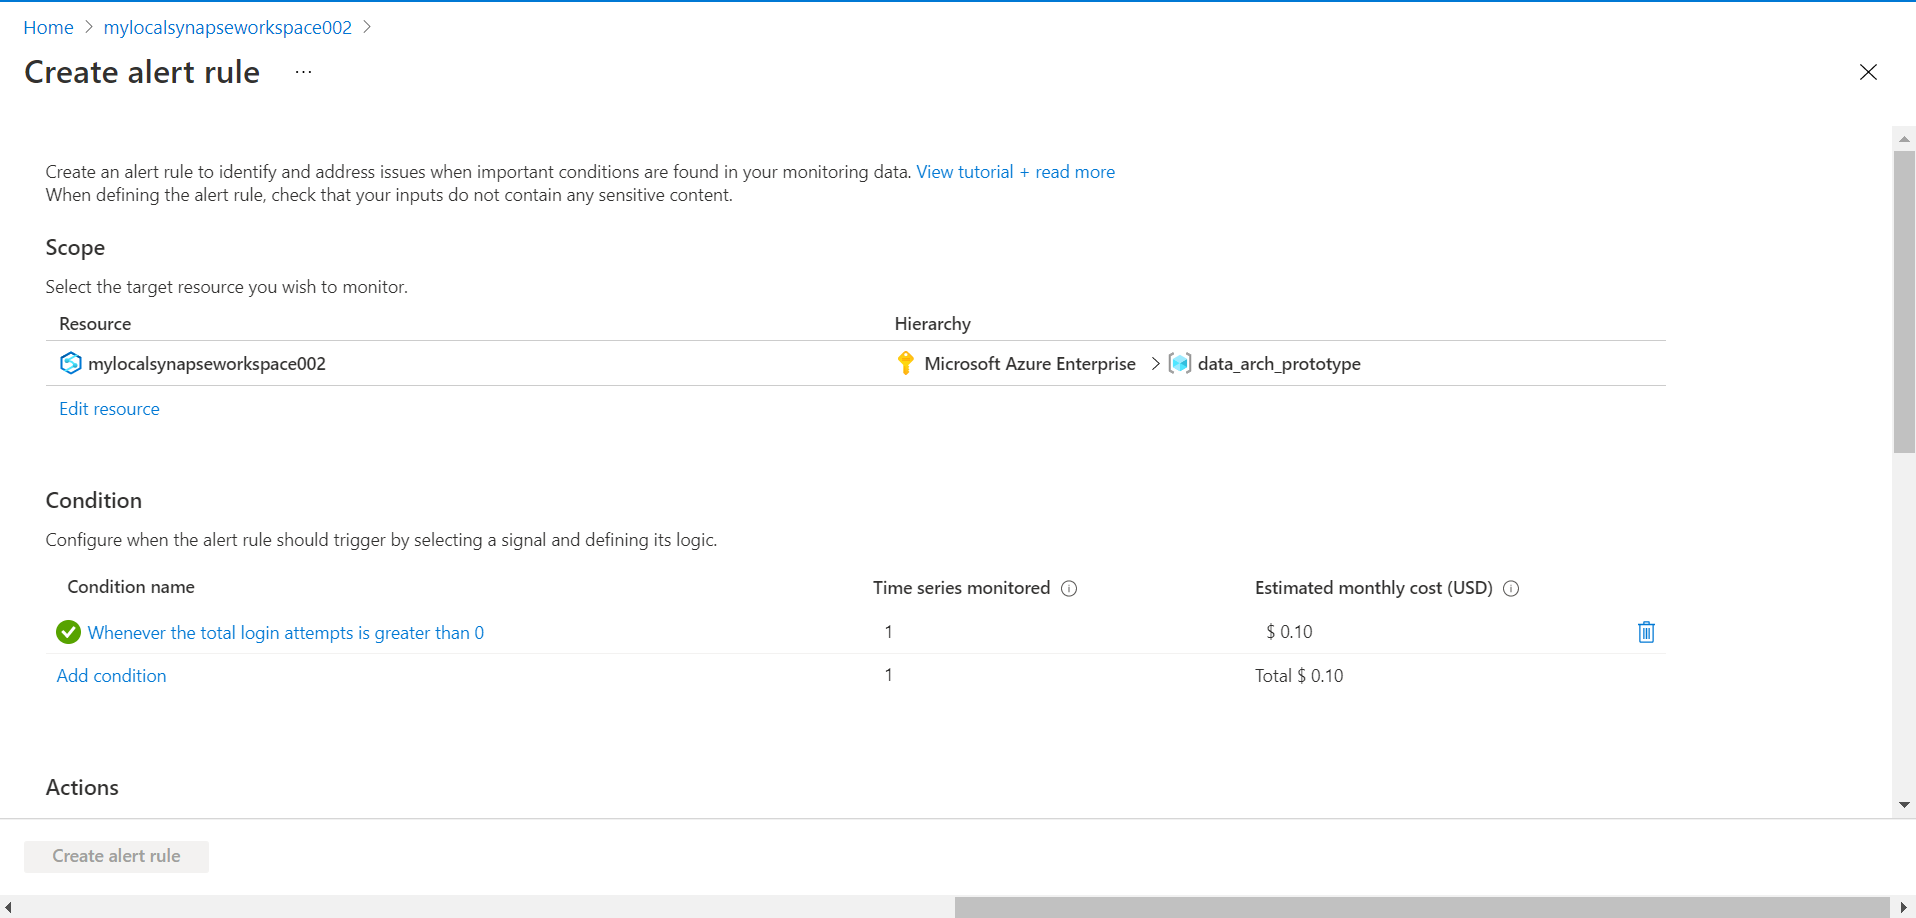
Scroll down and you would see that the next step toward the creation of the alert is the creation of an action group. We can select any existing action group and create a new one and select the same. For now, we would assume that there is no action group that we can use so we will create a new one. Click on the Add action groups to start creating a new one.
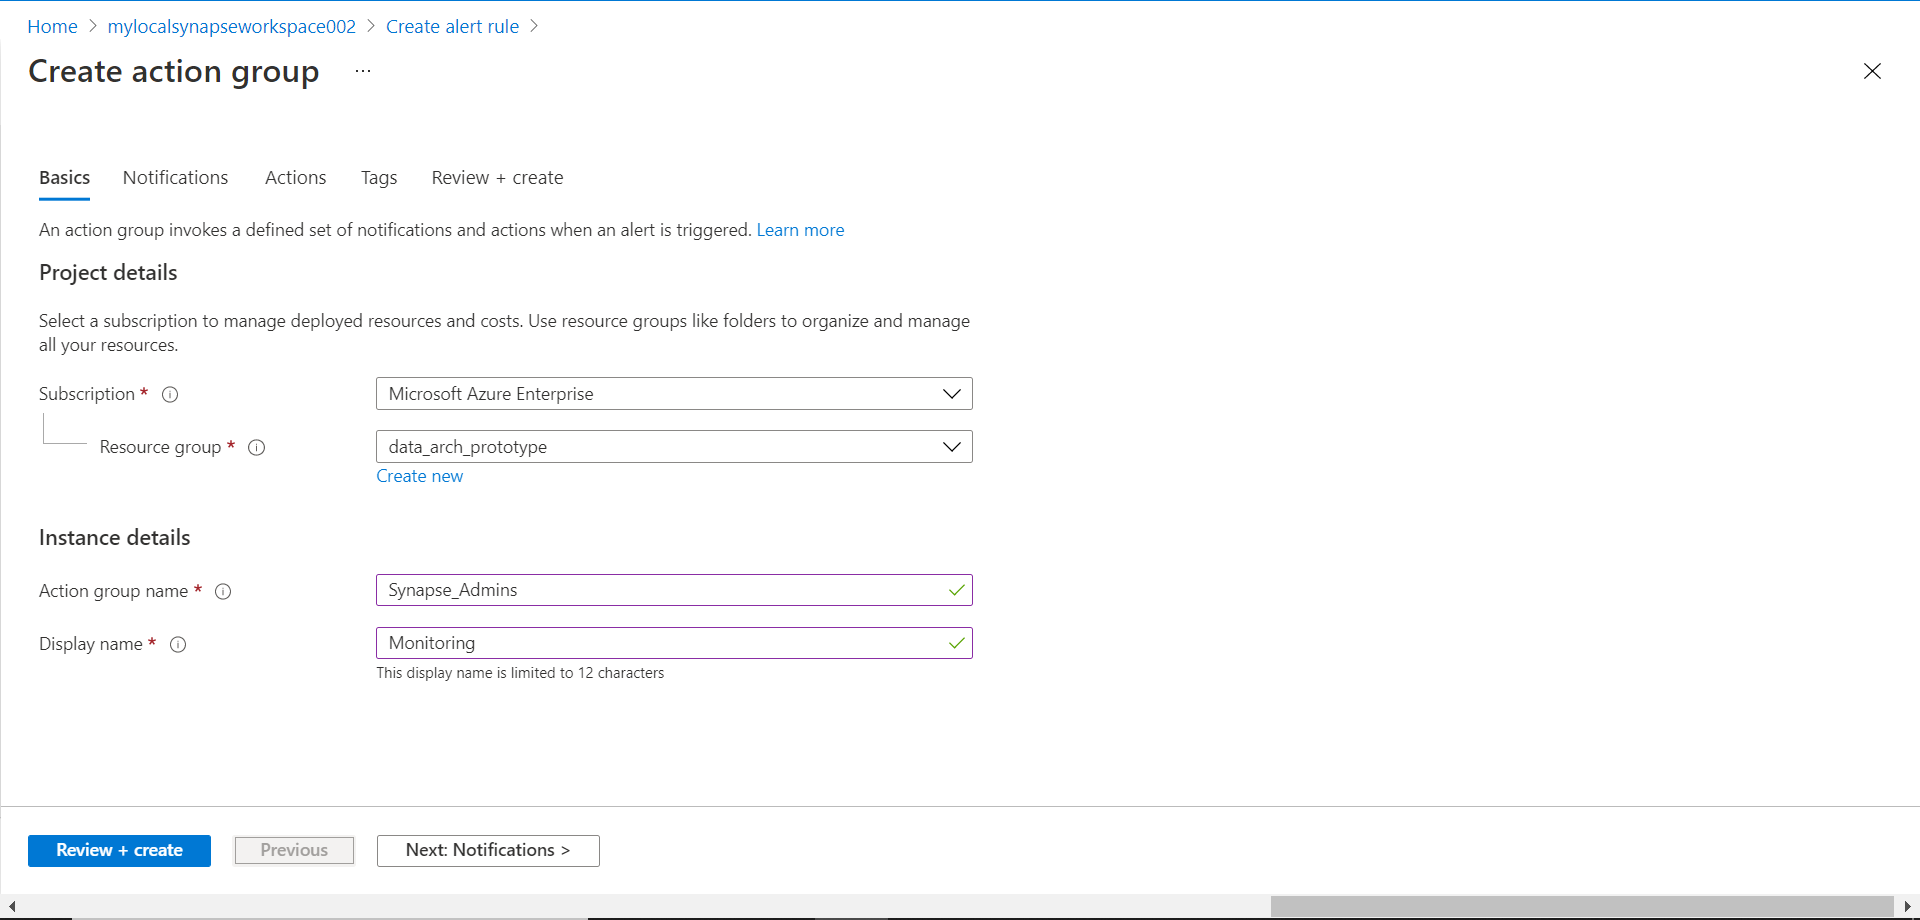
Click on Create action group button to start the action group creation wizard. Once the wizard opens; the page would look as shown below. Provide relevant details as requested on this page which are the Subscription name, Resource group, Action group name and the Display name i.e., a friendly name for the action group.
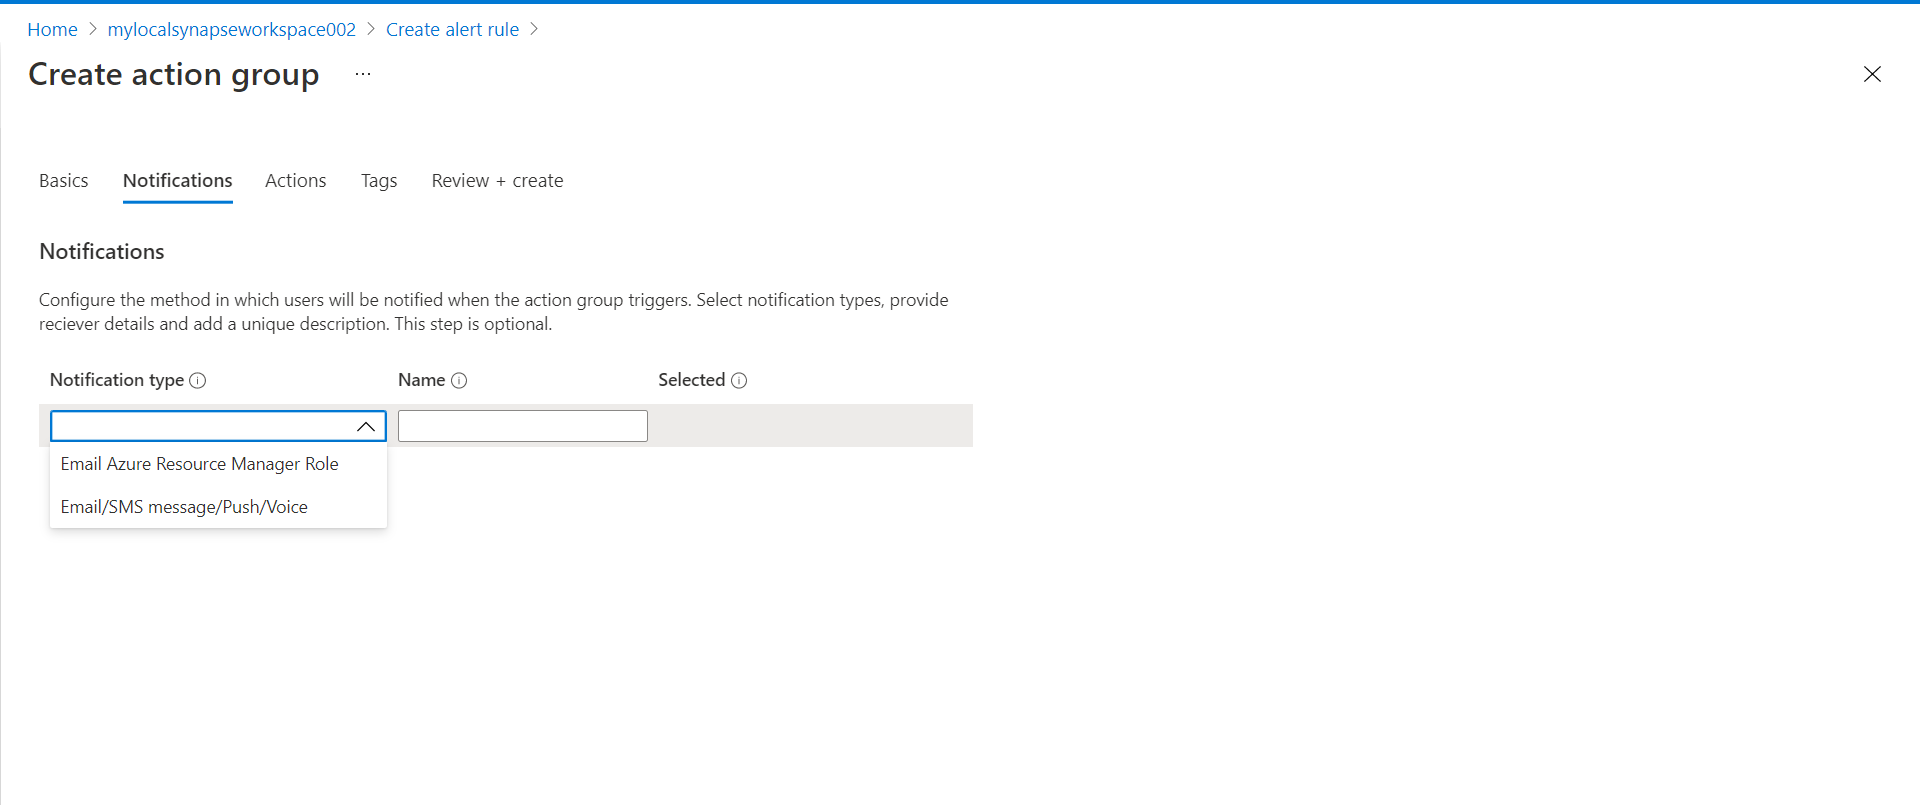
In the next step, we need to configure the notifications section. We can select from the notification types shown below. Let’s say we intend to receive a notification by Email or SMS, so we would select the relevant option from the list.
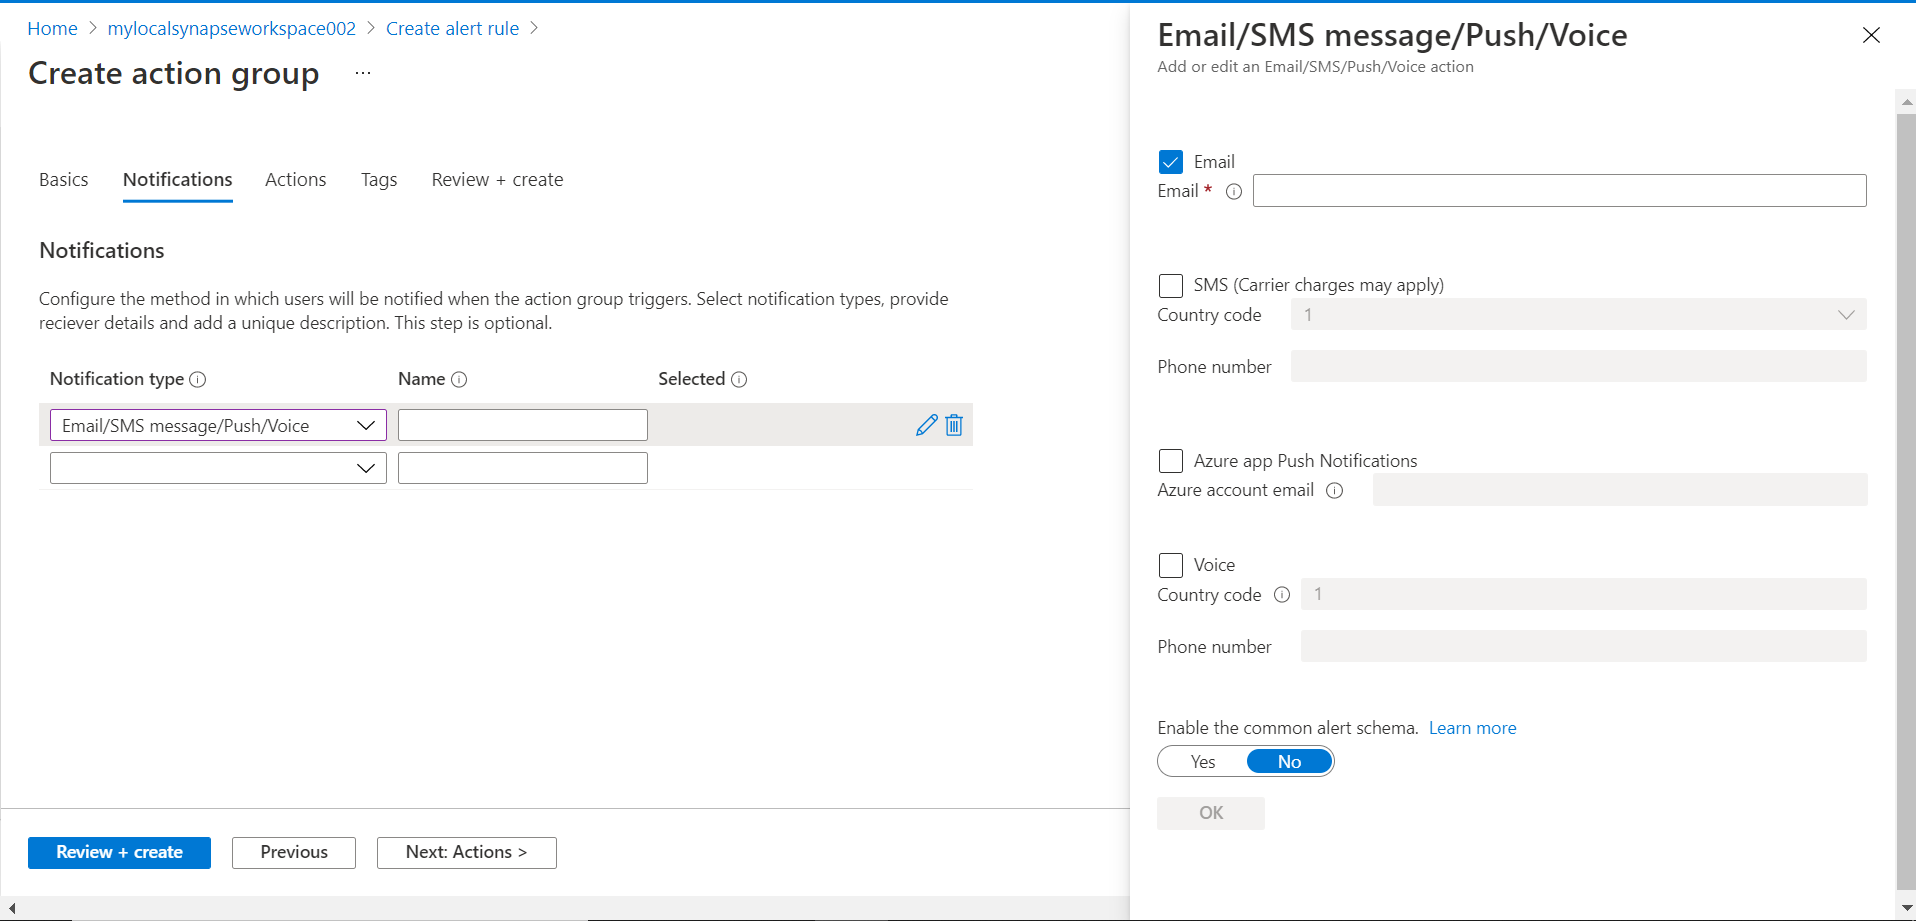
Based on our selection, now we need to provide a relevant phone number or email id on which we intend to receive the alert. Select one or more relevant options and provide details as shown below.
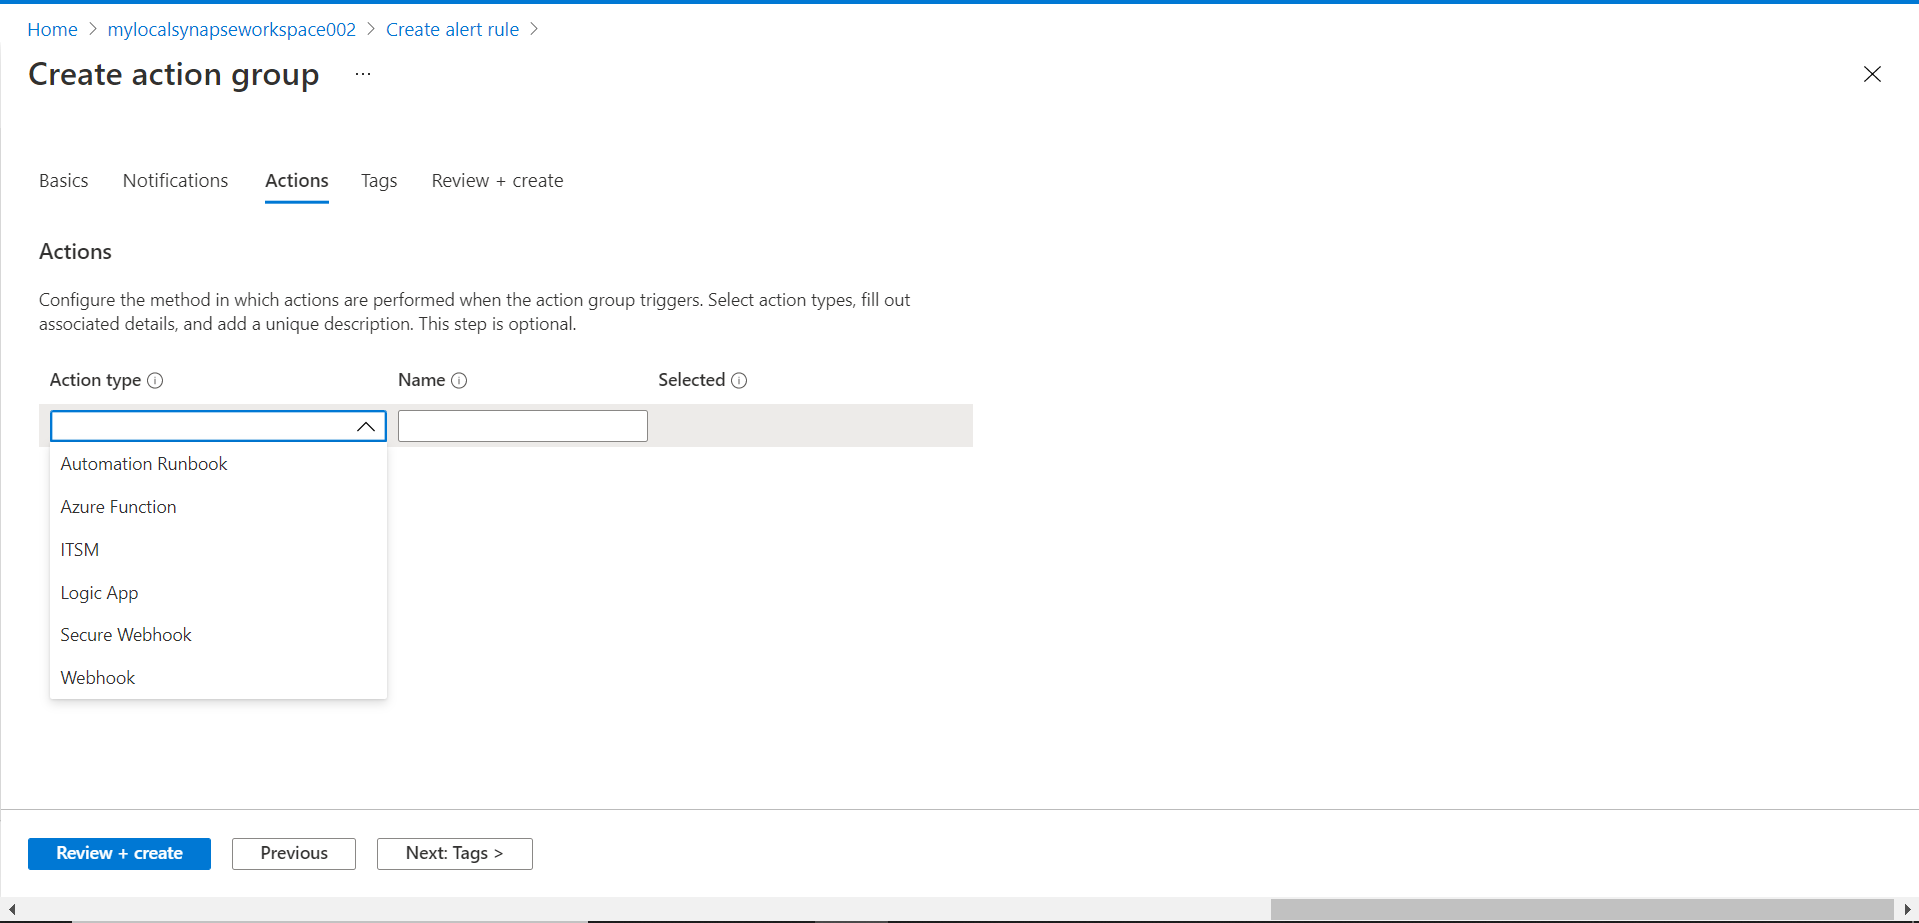
In the next step, we need to configure actions that need to be taken when the criteria are met along with the order in which actions should be performed. The type of actions that can be taken is as shown below. While one would want to typically perform actions to automate the response to certain thresholds, but it is not mandatory to act. We can bypass configuring actions for now and move to the next step.
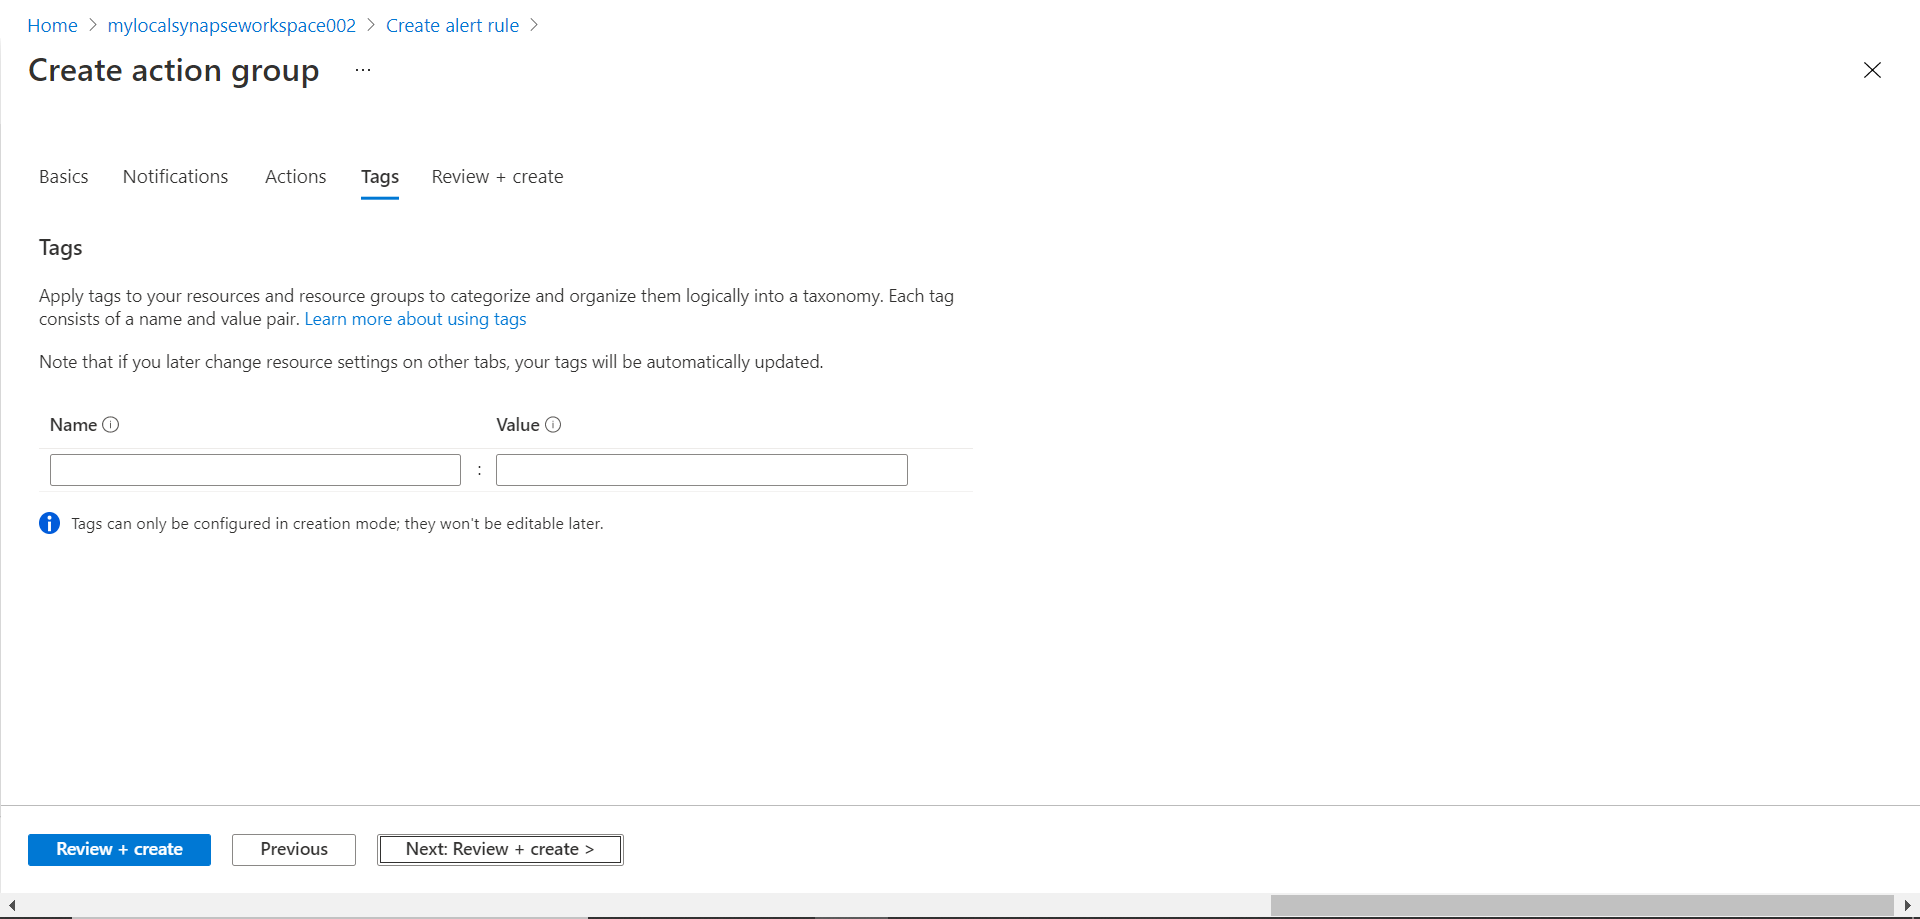
We can optionally configure tags as shown below. While it’s not mandatory to configure tags but it’s recommended to add at least some description of the purpose of the group using tags.
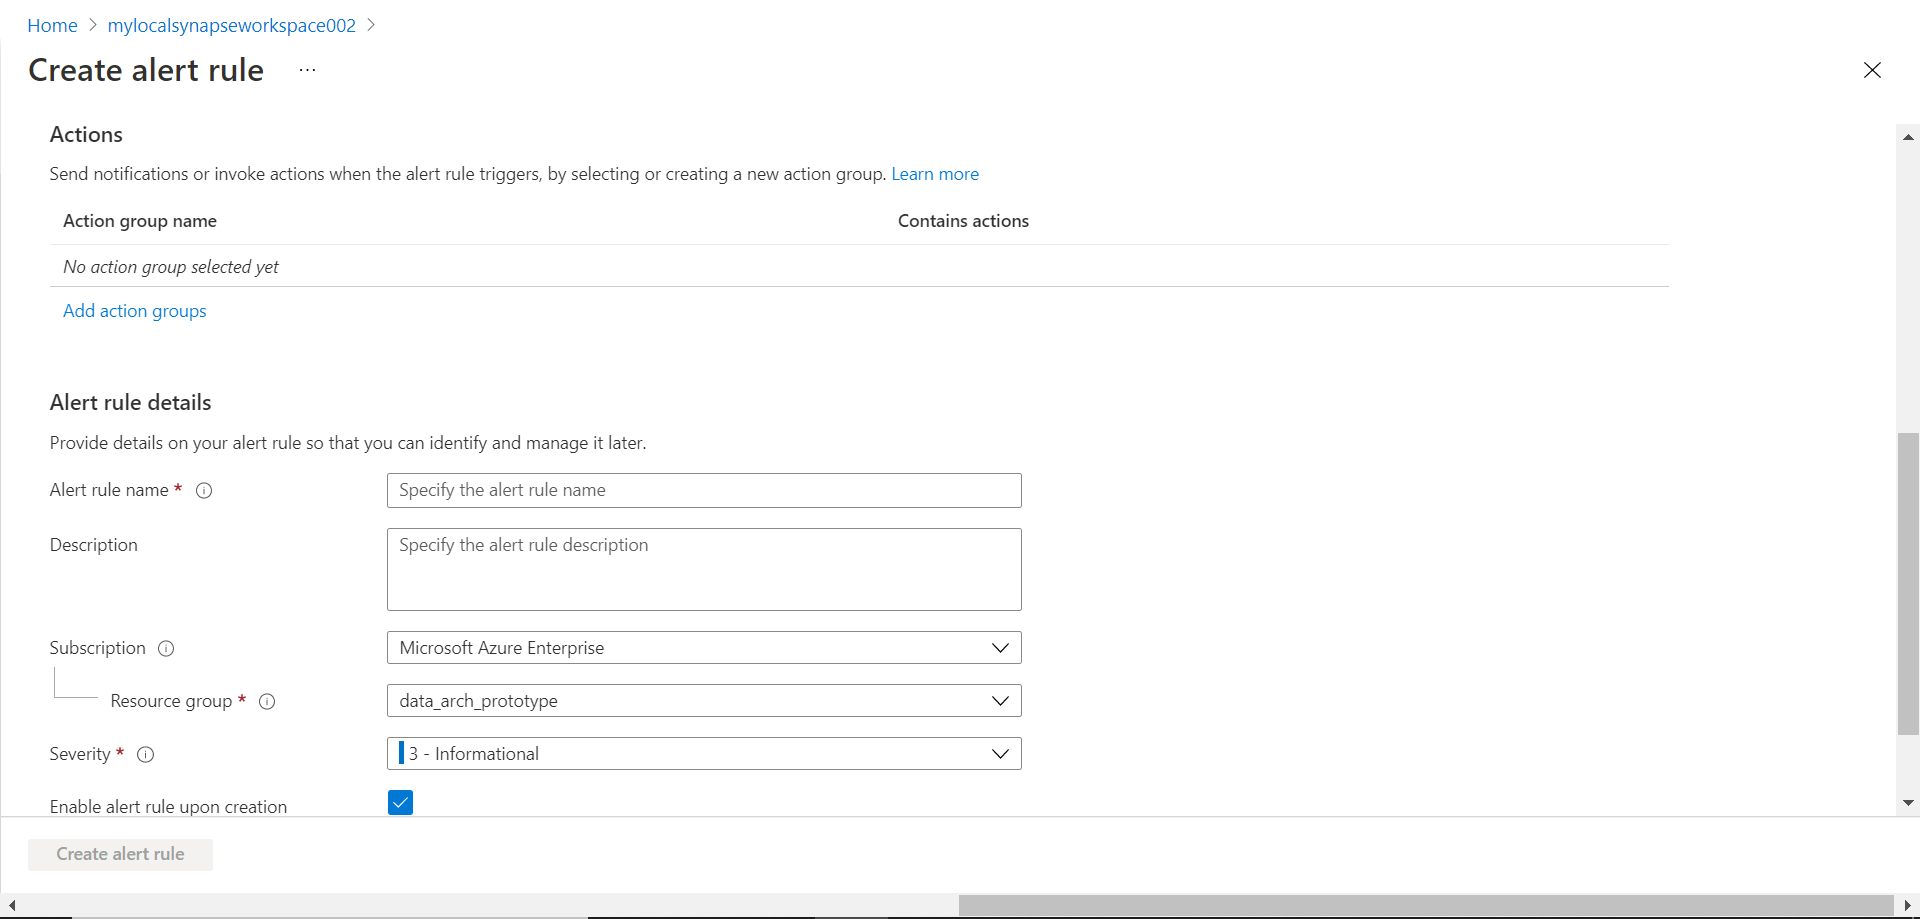
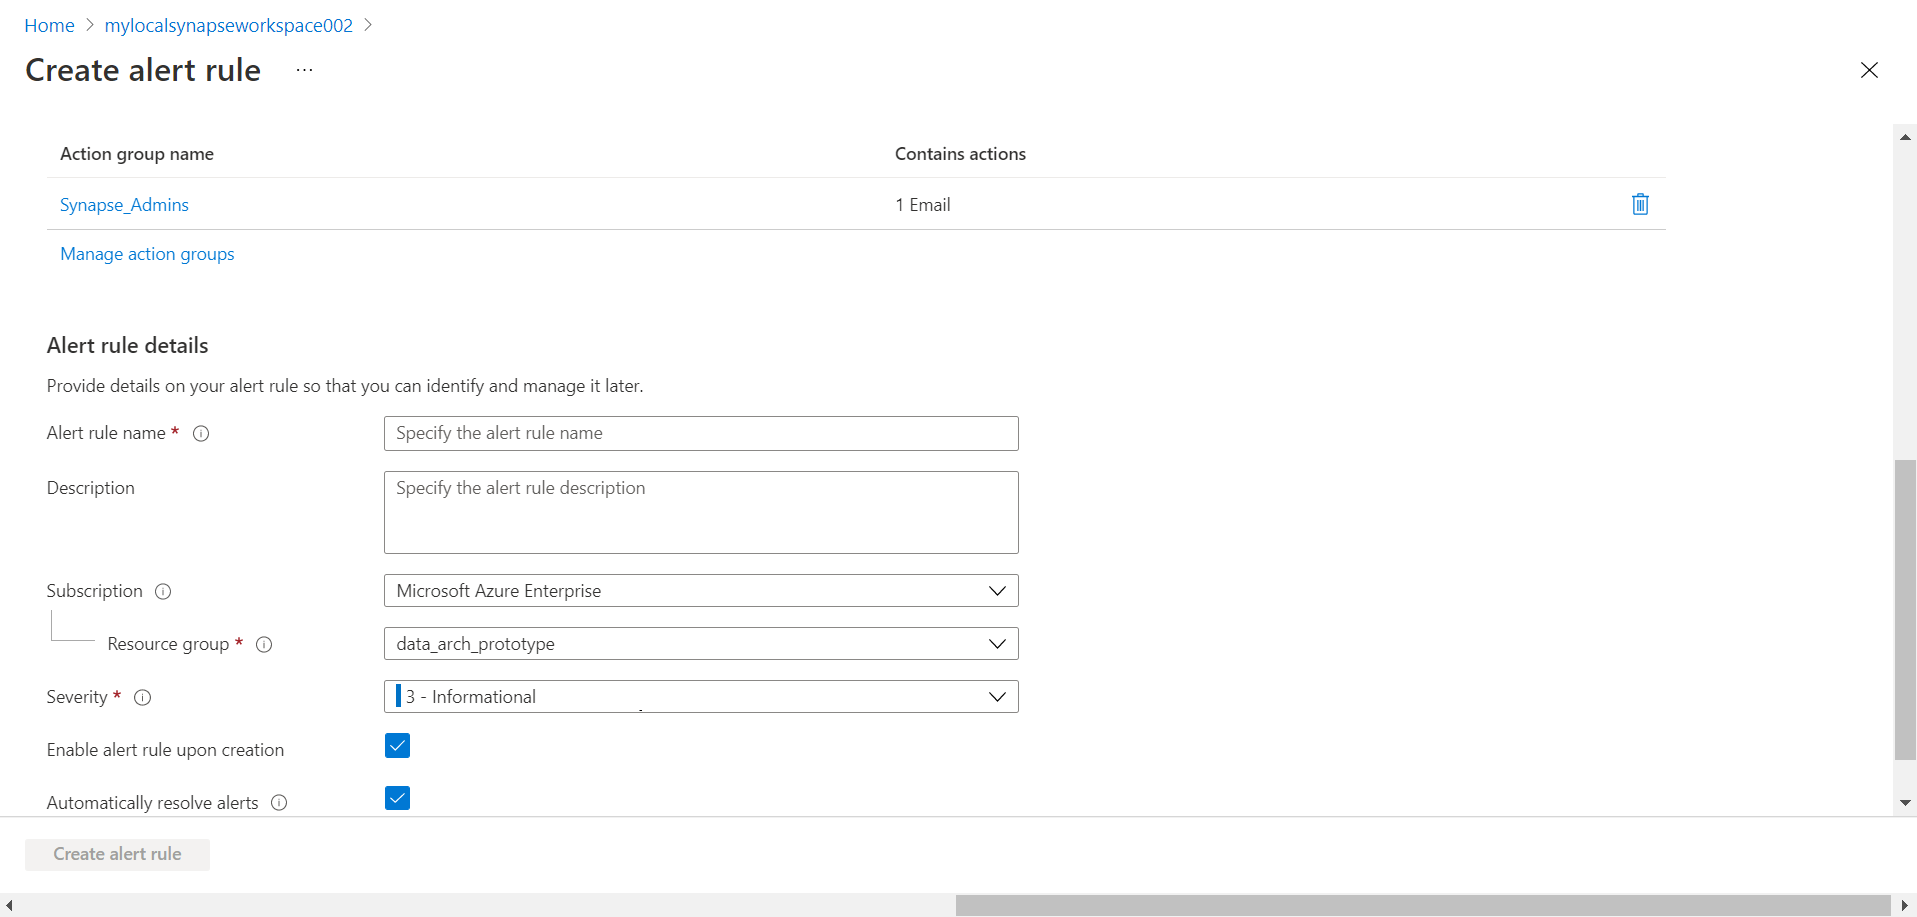
Finally, move to the next step, review the details that we have configured so far and click on the Create button to create the notification group. Once created, it will get added to the rule configuration as shown below. The final step is to provide alert rule details like the Alert rule name, subscription, resource group, severity and other basic details shown below. Once done click on the Create button to create the rule.
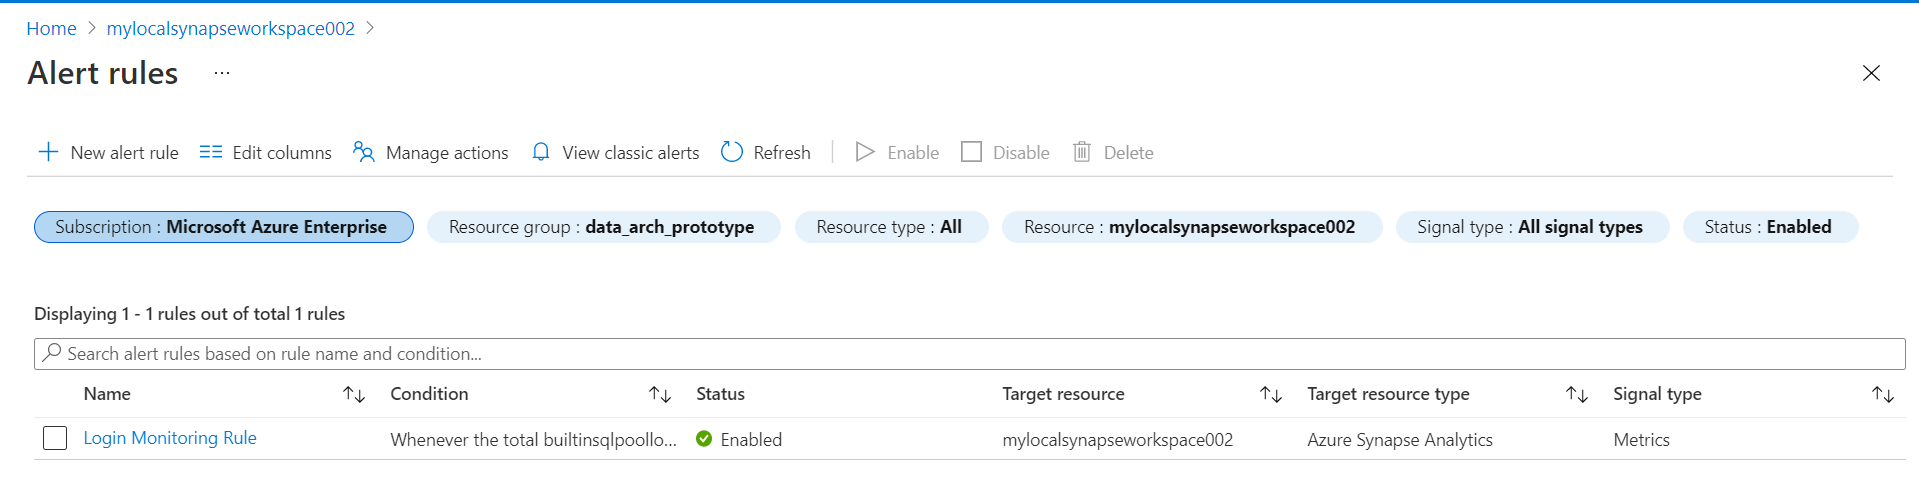
Once the rule has been created, it can be viewed by clicking the Managed alert rules button from the dashboard as shown below.
Once the alert rule is created and active, one can just perform the action that triggers the rule and that would trigger the alert, which would result in configured notification being sent out and corresponding action being taken. In this way, we can create alerts in Azure Synapse and monitor the activity as well as metrics related to Azure Synapse Analytics.
Conclusion
In this article, we learned how to create alert rules as well as notification groups in Azure Synapse. We learned the different configuration options that are available while configuring alerts as well as we saw the different signals available for monitoring using alert rules.

She has a deep experience in designing data and analytics solutions and ensuring its stability, reliability, and performance. She is also certified in SQL Server and have passed certifications like 70-463: Implementing Data Warehouses with Microsoft SQL Server.
View all posts by Gauri Mahajan
- Oracle Substring function overview with examples - June 19, 2024
- Introduction to the SQL Standard Deviation function - April 21, 2023
- A quick overview of MySQL foreign key with examples - February 7, 2023