
SCRUM is a great way to manage all sorts of tasks including sprints, but you don’t have to purchase expensive software packages to burn one. Excel is a great tool for rolling your own sprint burn down graph or you can just take mine. In this article, I’ll walk you through a burn down spreadsheet I created, show you how to modify it and at the end you can download it for yourself and kick the tires.
There are many examples of how to create simple-burn down charts in Excel but
- They usually have a straight line for estimated progress, when this isn’t realistic. Sprint progress is never a straight, linear process so measuring against this will give a distorted picture of whether the sprint is ahead or behind schedule until the last day. The planned/estimated/projected line will usually accelerate and decelerate at certain points in the sprint so the estimated progress line should to.
- They require a lot of tedious booking of hours, units etc
- They aren’t flexible enough to easily add tasks, remove them
My goals in create this were …
- to make something simple, yet sophisticated enough to handle sprints with a reasonably large number of PBIs with varying weights, in terms of effort or value.
- to make it easy enough to use so that all you have to do is enter in some data in red colored cells (aka inputs)
- to make updating the sheet as simply as indicate the day a particular task was completed and nothing else
- to be robust enough to not throw errors unless outside of most normal usage scenarios
- to abstract the user from complexity, noise and just present inputs and outputs, as much as possible
And here it is …
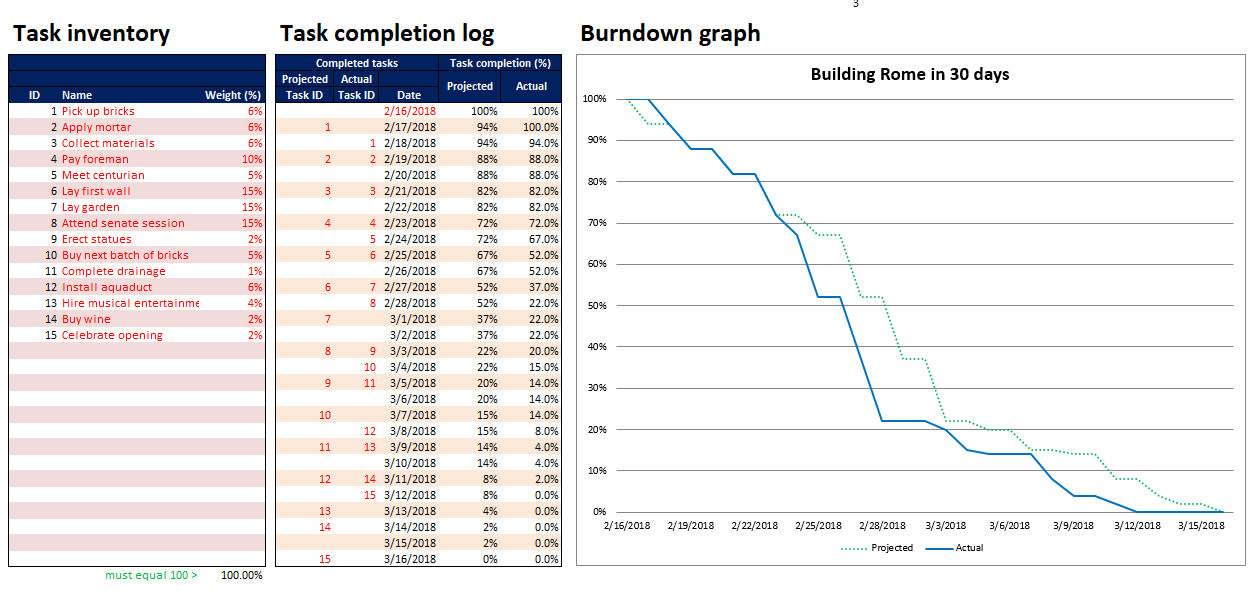
The basic premise
This burn down assumes that you have a series of tasks in your sprint of various effort weightings (the weight may be on effort or value), so some might take more time than others, but the sum of the weightings must equal 100%. You can easily convert Effort points you have into a percent, by just dividing each PBI value by the total. Or you could readily update the spreadsheet to have it use effort points directly.
Each task has a ID e.g. 1, a name and a weighting percentage. Once you have set up all of your tasks in the Task inventory section, you are half-way done setting up your sprint
As the IDs already exist, the “editable” range is highlighted below, and items are colored red in the spreadsheet
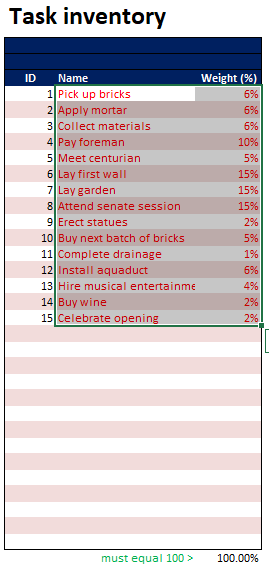
In the above example, you can see 15 tasks of various weights starting at 6%. The weights and names can easily be changed. Most likely you would leave the IDs as is.
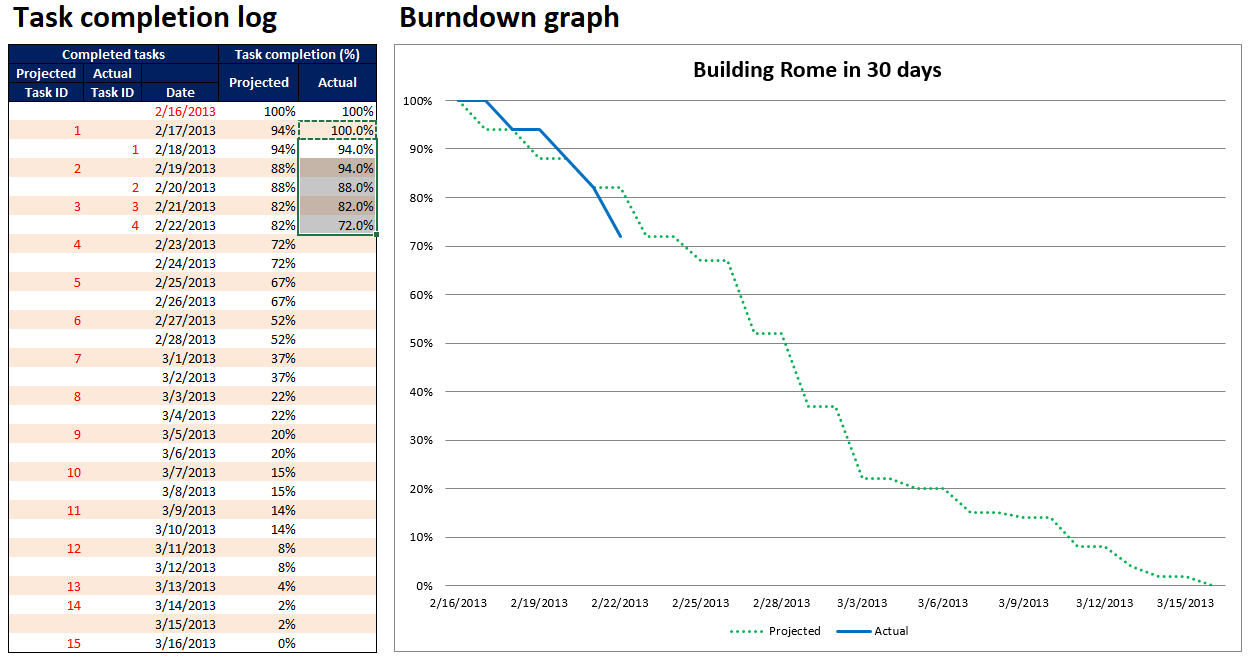
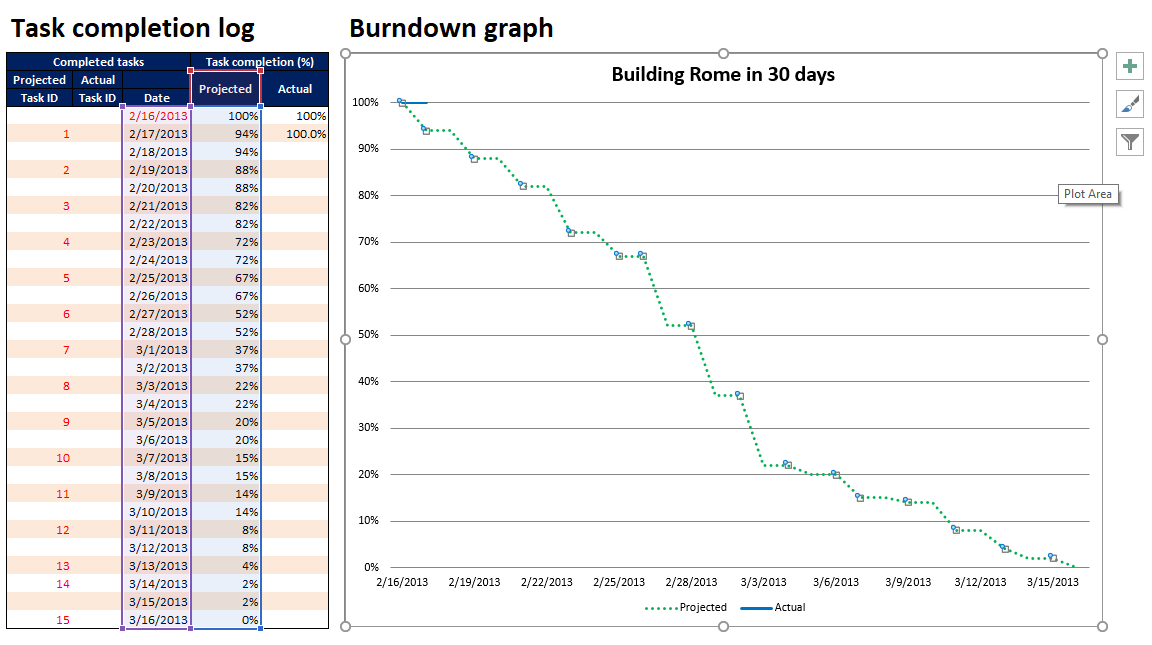
Next move to the Task completion log, and enter in the date of the first day of the sprint, then add in the task ID on the date when you anticipate the task will be done
The aforementioned input items are highlighted below and are highlighted in red in the spreadsheet
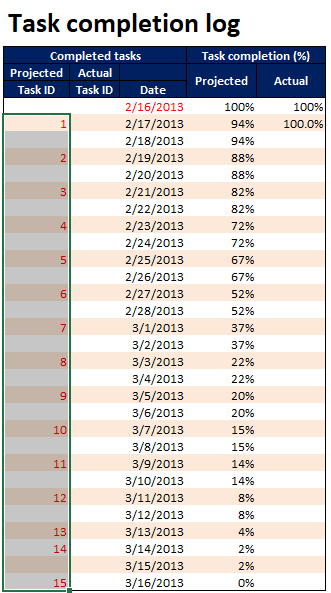
Above we see our anticipated milestones for completed tasks. For example the 1st will be completed on the 17th, the 2nd day of the sprint. There is a pretty even dispersion of completion dates with a couple clustered near the end of the sprint
At this point, your burn down graph will look something like this
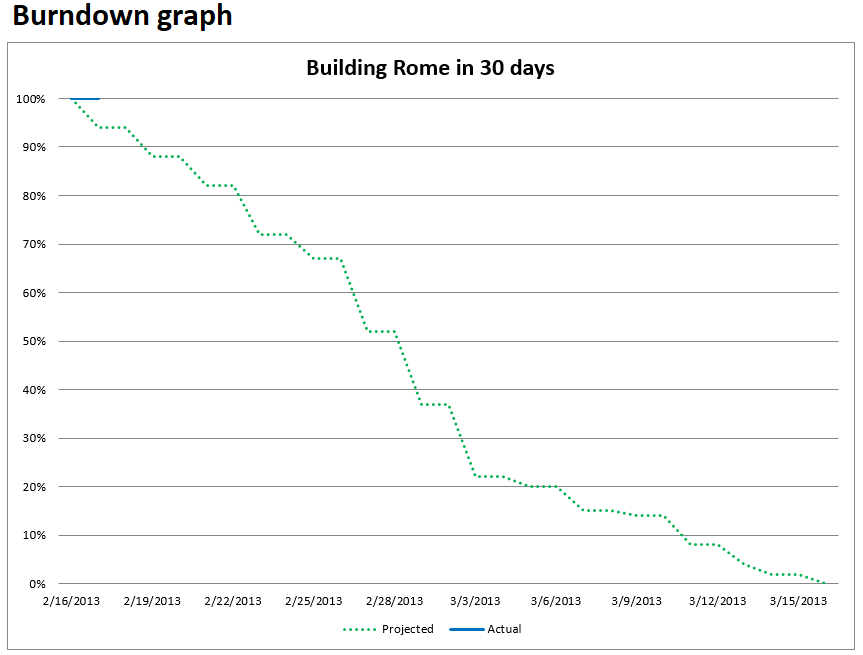
That is it, your setup is complete and you are ready to begin your burn down!
Sprinting
Once you begin your sprint, simply enter the task ID in the “Actual task ID” column when the task is completed. It will automatically update the sprint burn down
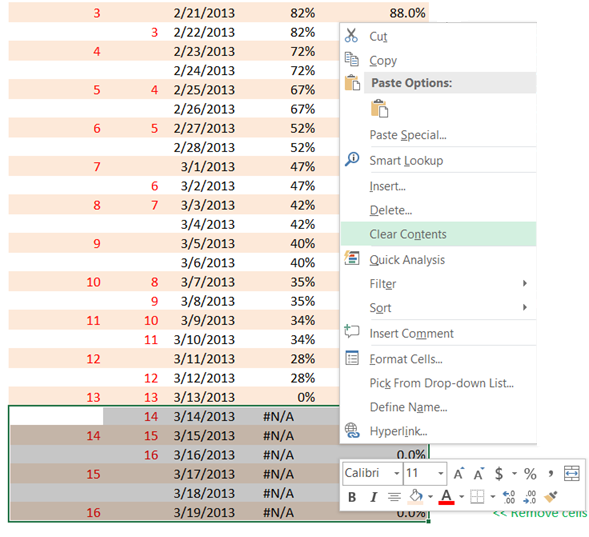
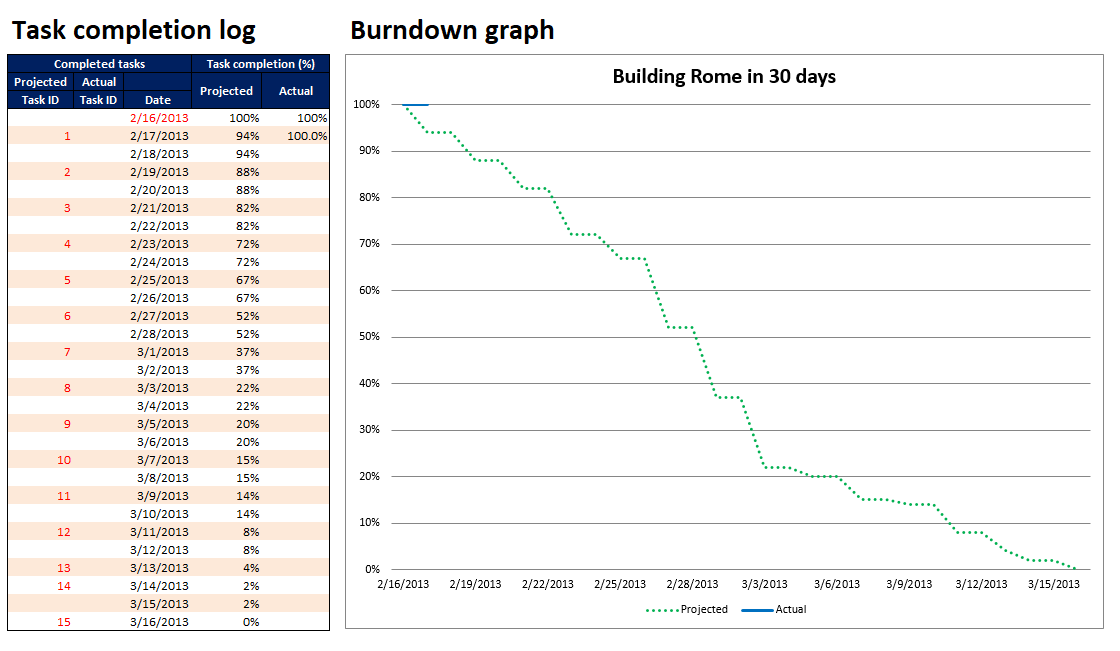
To make the burn down look better, and showing only the line based on progress, not making it extend to the right, delete unnecessary cells in the Task completion (%) grid, and then copy them down, each time you complete a task.
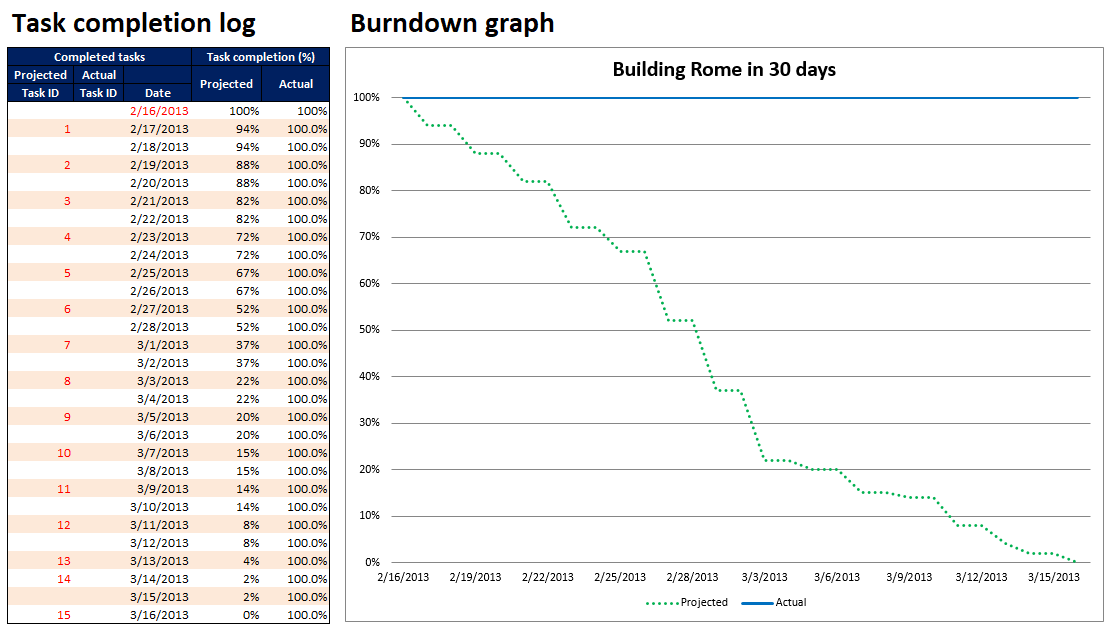
Alternatively, you can just copy all the values down and leave them. That works fine but it does distort the actual graph, which goes flat to the end right of the graph vs being truncated, as in the example below. I’d prefer the quick drag and copy action to ensure a nice looking burn down graph.
Note: With a little macro work or a more extensive formula, I’m sure this could be made to be done automatically
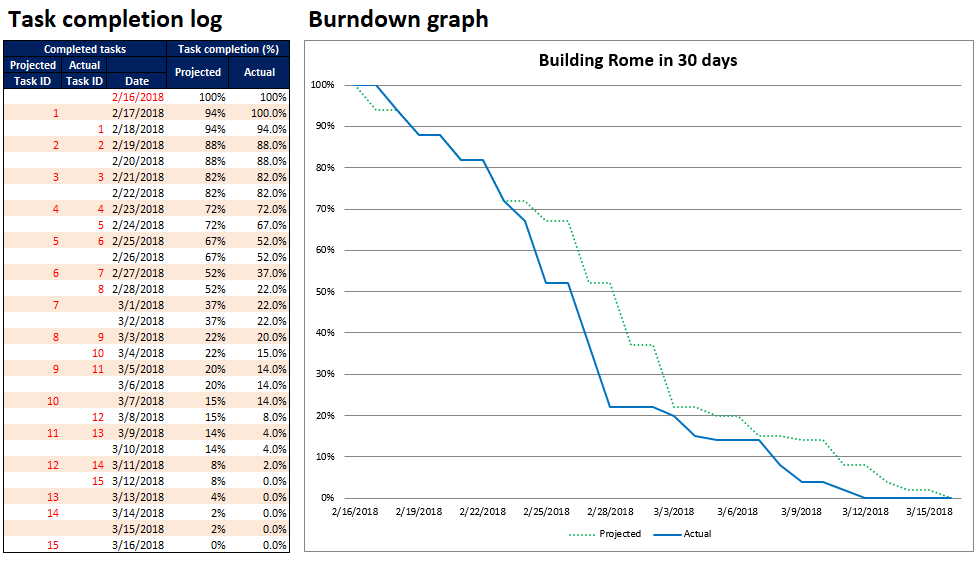
As you can see above, the actual sprint is going a bit better than expected even though it got off to a slow start. With the completion of task 3 on time and 4 early, the actual curve is under the projected which means the sprint is ahead of schedule
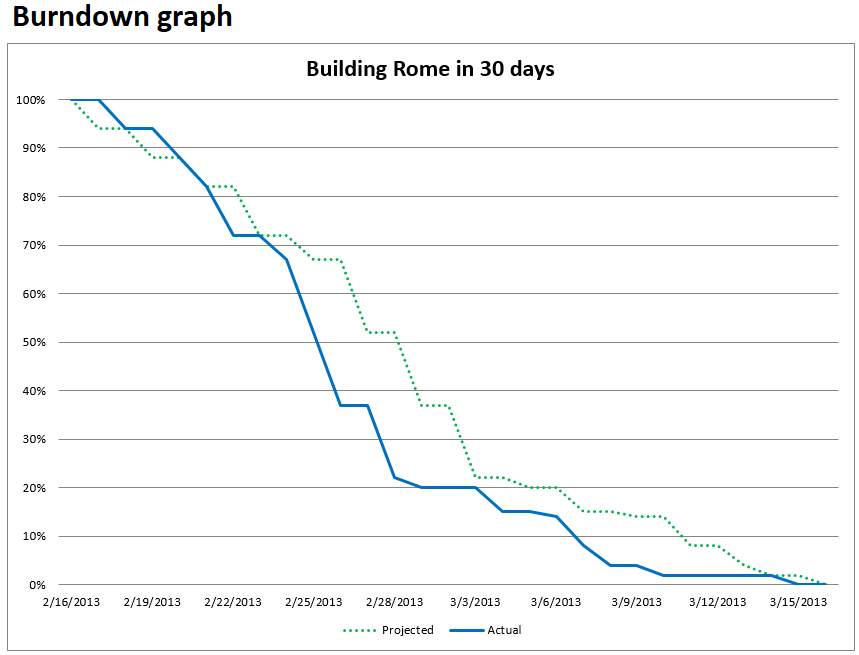
As you complete each task, just update it in the log, and once you have reached the end of your sprint you will have a completed burn down chart, hopefully showing a successful sprint looking something like this
Modifying the spreadsheet
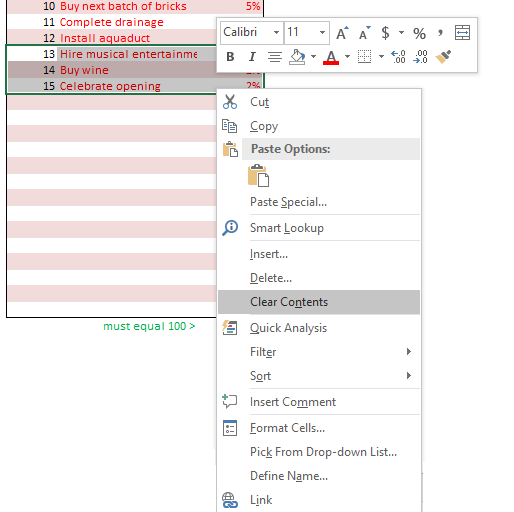
If your sprint has fewer tasks, just remove the tasks from the task inventory section, by highlighting the rows and columns for the tasks you want to remove and clicking “Clear contents”
Then refactor the task weightings until they again add up to 100%
Next, go to the task completion log and do the same there, removing all of the rows above the number of tasks you have allocated to the sprint.
To add tasks, just copy the rows down to in both the Task completion log and Task inventory sections, making sure to refactor to get the Weight to 100%
You will need to update regions in your graph, if you add tasks, otherwise they won’t show up. Fortunately, it is quick and easy to do with the following example
You can see the Projected region has been stretched to cover new data. The Actual one will need to be done next to get an accurate graph
Work sheets
The spreadsheet has three worksheets
New – this is a new sprint with no actual data, and the Actual % formula has been deleted where there are no completed sprints to show a “cleaner” burndown graph
New w actual formula – this is the same as New but the Actual % formula has been copied down, so that the graph will be updated each time you add data, without having to do anything else
Completed – this shows a completed burndown
Misc
The dates have not accounted for weekends, holidays. These can be fixed manually
Summary
I hope you find this spreadsheet useful. Please provide any comments, questions, issues etc in the comment section
Download

- Eating the frog: How to create a daily-deliverable sprint burn down graph in Excel - July 12, 2018
- How to create an advanced sprint burn down chart in Excel - July 10, 2018
- Sharpen your ax - July 4, 2018