
In the first article I wrote on how to create a SCRUM-based, sprint burn down in Excel, How to create an advanced sprint burn down chart in Excel, I showed how to easily set up a conventional burn-down with effort points as a percent, to create a pretty nice looking burn down chart, just by entering the IDs of each completed PBI on the date that it was finished.
In this spreadsheet, though, we’ll look at another kind of sprint. Think of a goal to go to the gym for an hour every day, or to burn 500 calories a day, or to complete your daily deliverable task every day. In this spread sheet, we’ll track adherence to that goal, whether it is a variable amount like 400 or 450 calories or a Boolean, “yes” I completed my task today or “no” I didn’t.
Calorie burn
In the first case, we’ll set up a sprint where you commit yourself to go to the gym and burn off 500 calories a day on the elliptical machine.
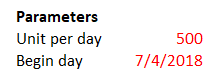
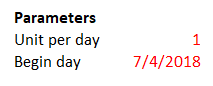
Let’s set some basic parameters of this sprint
- Units per day is the daily goal, in this case 500 calories
- Begin is the day we’ll start the sprint, which will be July 4th
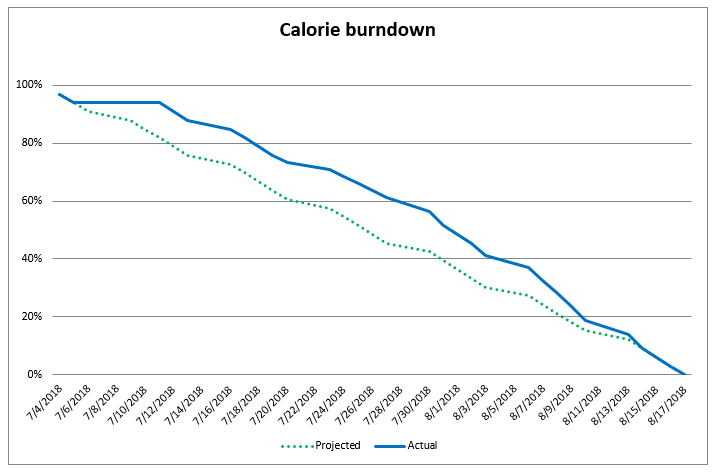
Now, each day enter in the number of calories burned and your progress will be tracked on the burn down graph
With this type of sprint, in theory, you can make up for lost calories by burning more on a subsequent day and try to “catch up” as shown in the graph below
Daily deliverables
Now let’s look at a scenario where you simply want to track if you have done your daily deliverable or not. The unit would be “1”. Then each day, you would enter “1” if you did it and “0” if you didn’t.
A daily deliverable is the one, and only one task, that you need to do every day. It is the frog you must eat
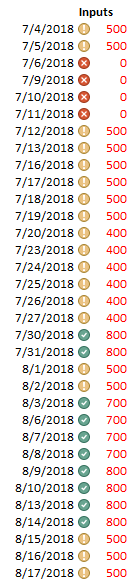
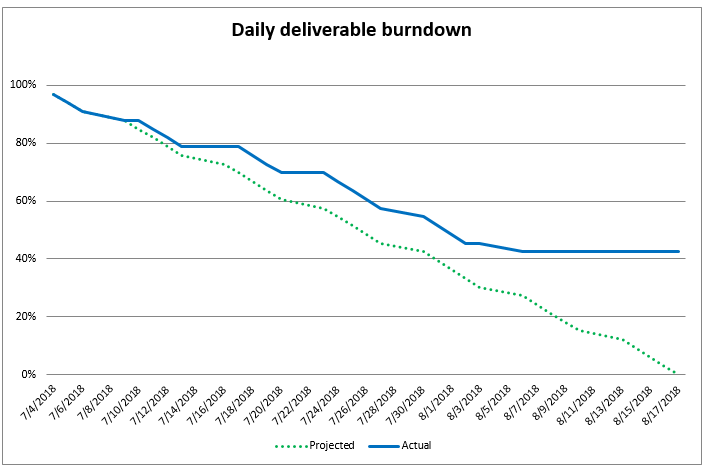
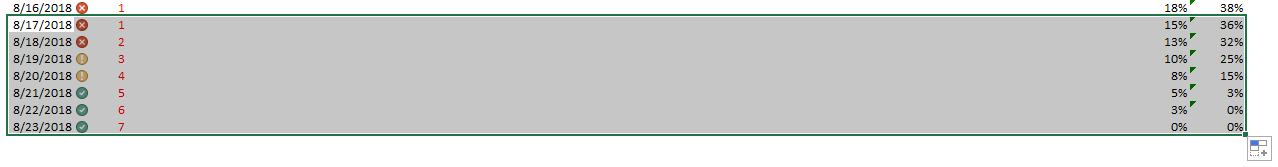
You can “cheat” and do two daily deliverables in a day, if you missed doing one on a previous day, but this isn’t a good practice. The goal is to do one every day. Don’t think you can miss one and then catch up later as they key is consistency. As such, the best you can do is match your projected graph. In this sprint below, we fell a little short. Here is what our input data looks like
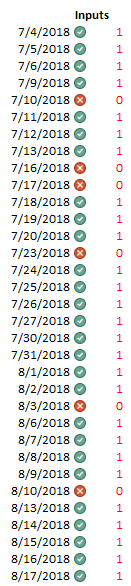
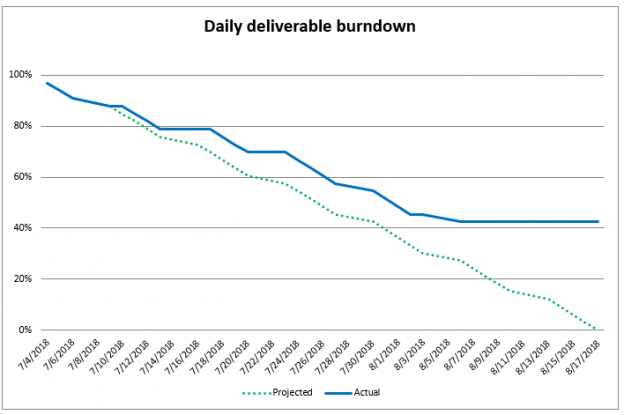
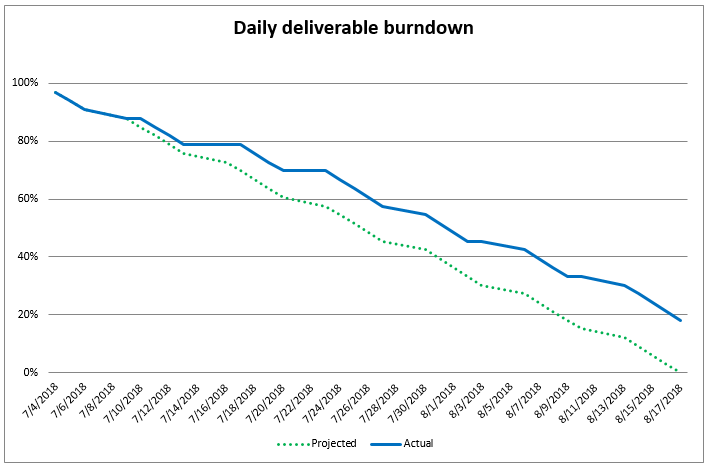
… and here is the burn down graph itself
Weekends
The spreadsheet is smart enough to skip weekends but it does assume you will be doing the activity Monday – Friday. If not, you may need to modify the dates manually
Clean burndown graphs
If you want to have a clean burn-down graph with no flat-lines that go to the end, that looks like this
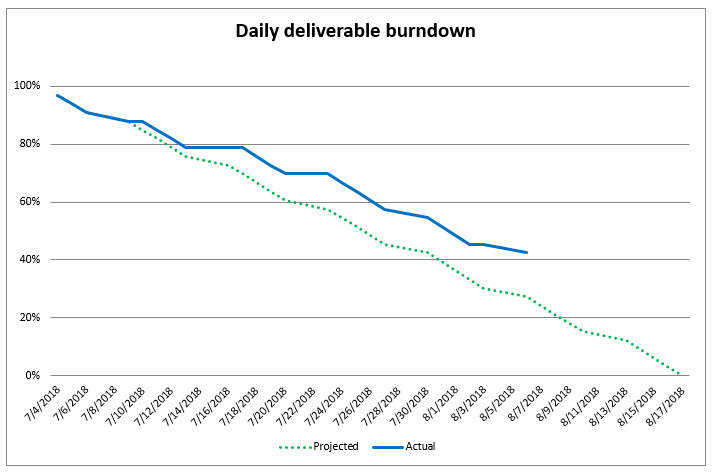
Not this
… you will need to only have data in the actual column for days that have been entered. All other cells should be empty. Each time you enter in a data value, just copy down one cell formula in the “Actual” column. This is an extra step but will make your burndown look nicer

Shortening or lengthening the sprint
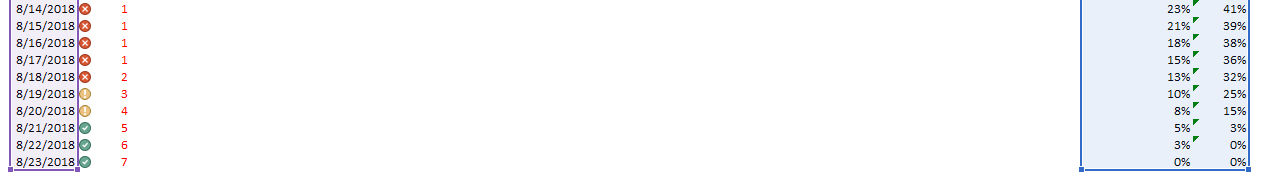
If you want to add days to your sprint, highlight the last full row

Then drag it down to the number of days you want to add
Then click on the graph and all of the data regions will be selected automatically
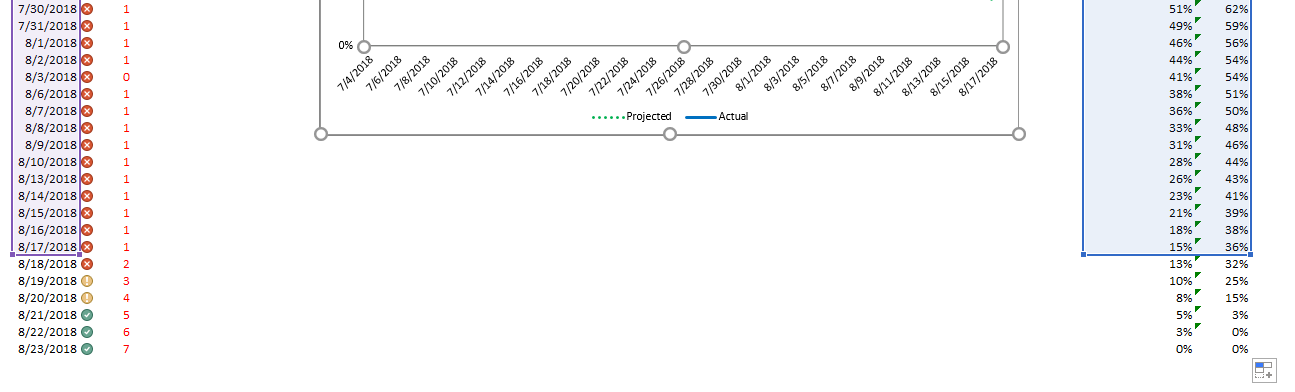
Then drag down the right bottom corner of the right-most region to cover your new data rows
To shorten the sprint, just reverse the process
Summary
I hope you find this spread-sheet useful. I use it on a daily basis to track my personal sprints for exercise and frog eating, and it always keeps me on target
Download

- Eating the frog: How to create a daily-deliverable sprint burn down graph in Excel - July 12, 2018
- How to create an advanced sprint burn down chart in Excel - July 10, 2018
- Sharpen your ax - July 4, 2018