
This article will show how to use Azure SQL Database to classify and tag data with sensitivity labels to generate reports out of it.
Introduction
In an enterprise data ecosystem, data is composed of a variety of data from different parts of the organization. A wide variety and volumes of data are warehoused in a data warehouse or data lakes, the consumption of the data needs to be controlled depending upon the confidentiality of the data. To identify confidentiality, the primary requirement is to classify the data and tag the sensitivity of the data objects and attributes. Azure SQL Database is one of the most popular means of hosting data on the Azure platform. It supports hosting a wide variety and volume of data, and with it comes the need to classify and label the data sensitivity to control its consumption. SQL Server on-premise editions already have these features which we typically operated and accessed using tools like SQL Server Management Studio (SSMS). Azure SQL Database provides out-of-box GUI-based options to classify as well as tag data with sensitivity labels as well as generate reports out of it. In this article, we will learn how to perform the same.
Pre-Requisite
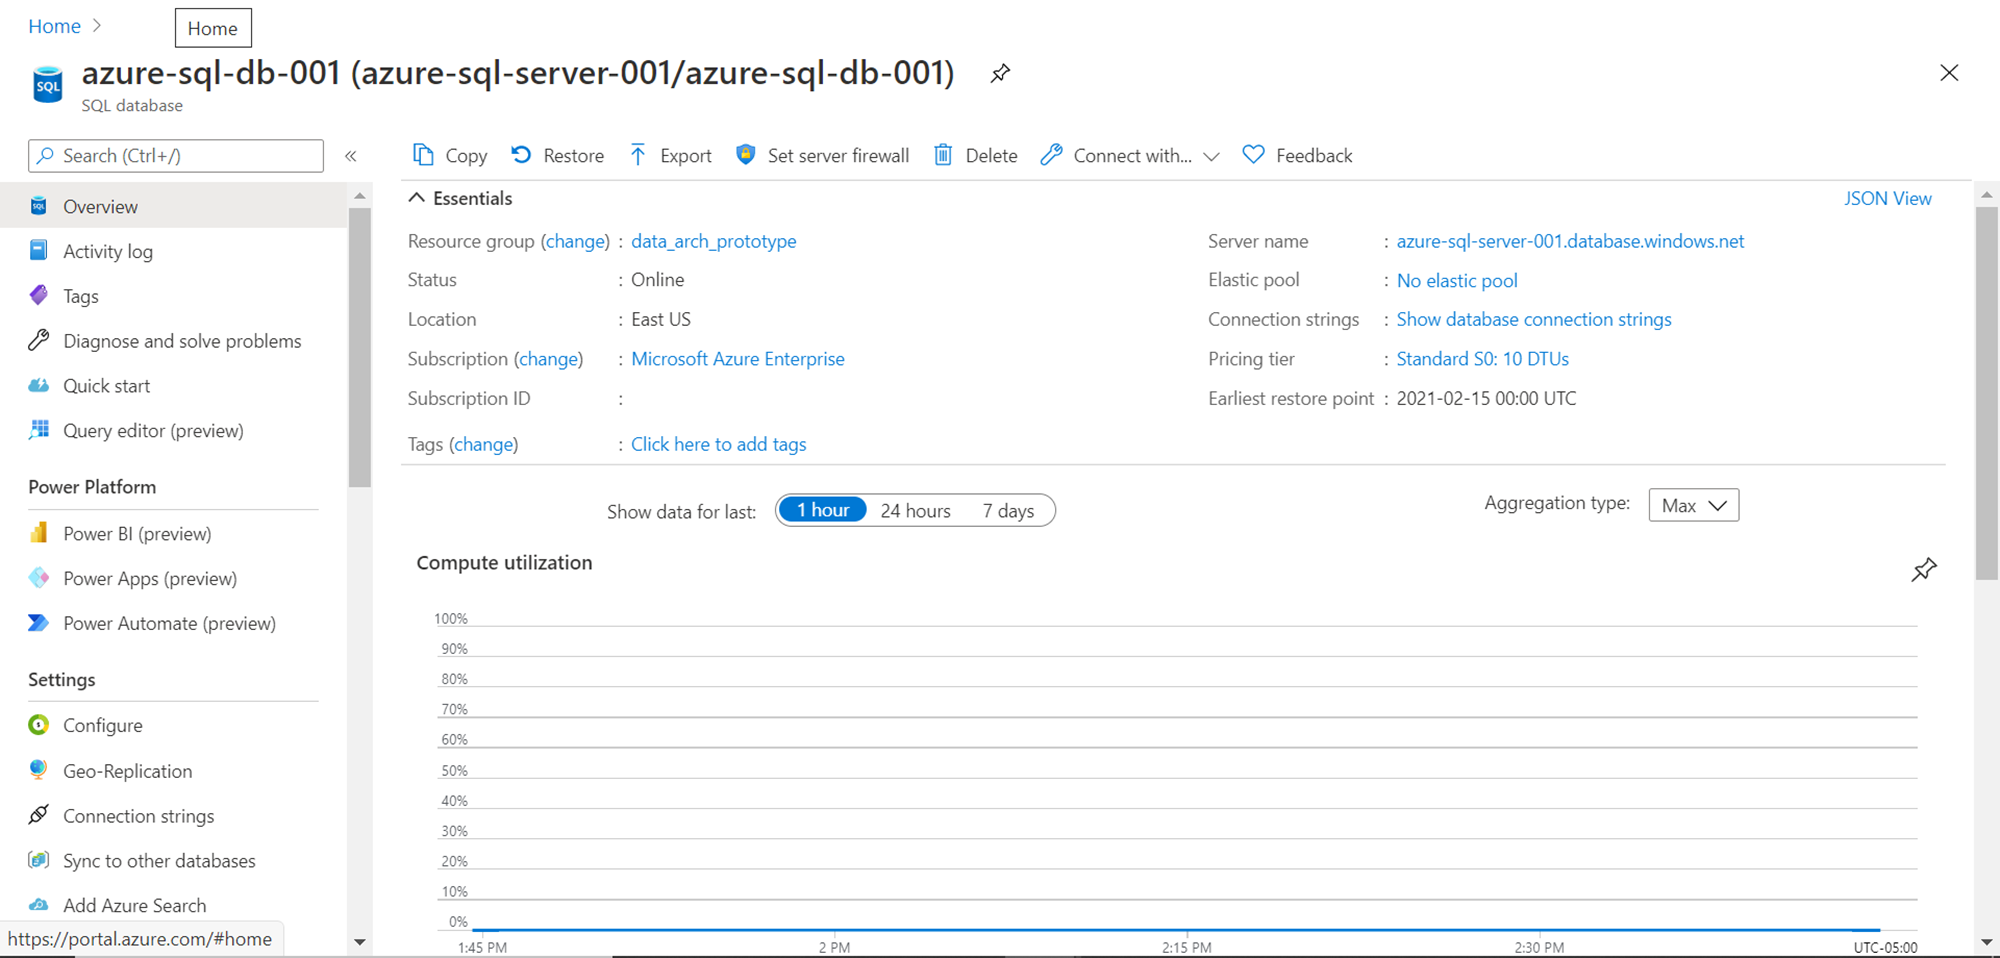
To perform data classification, sensitivity tagging and extracting a report of the same, what we first need is an Azure SQL Database with some sample data loaded into it. Assuming the one has access to an Azure account and has the necessary privileges to administer Azure SQL Server and Azure SQL Database, create a new instance of SQL Server as well as SQL Database. As we would need some sample data loaded into the database, it would be advisable to create the Azure SQL database with the sample data option so that the database instance is pre-loaded with data once it is created. Once the database is created, navigate to the dashboard and it would look as shown below.
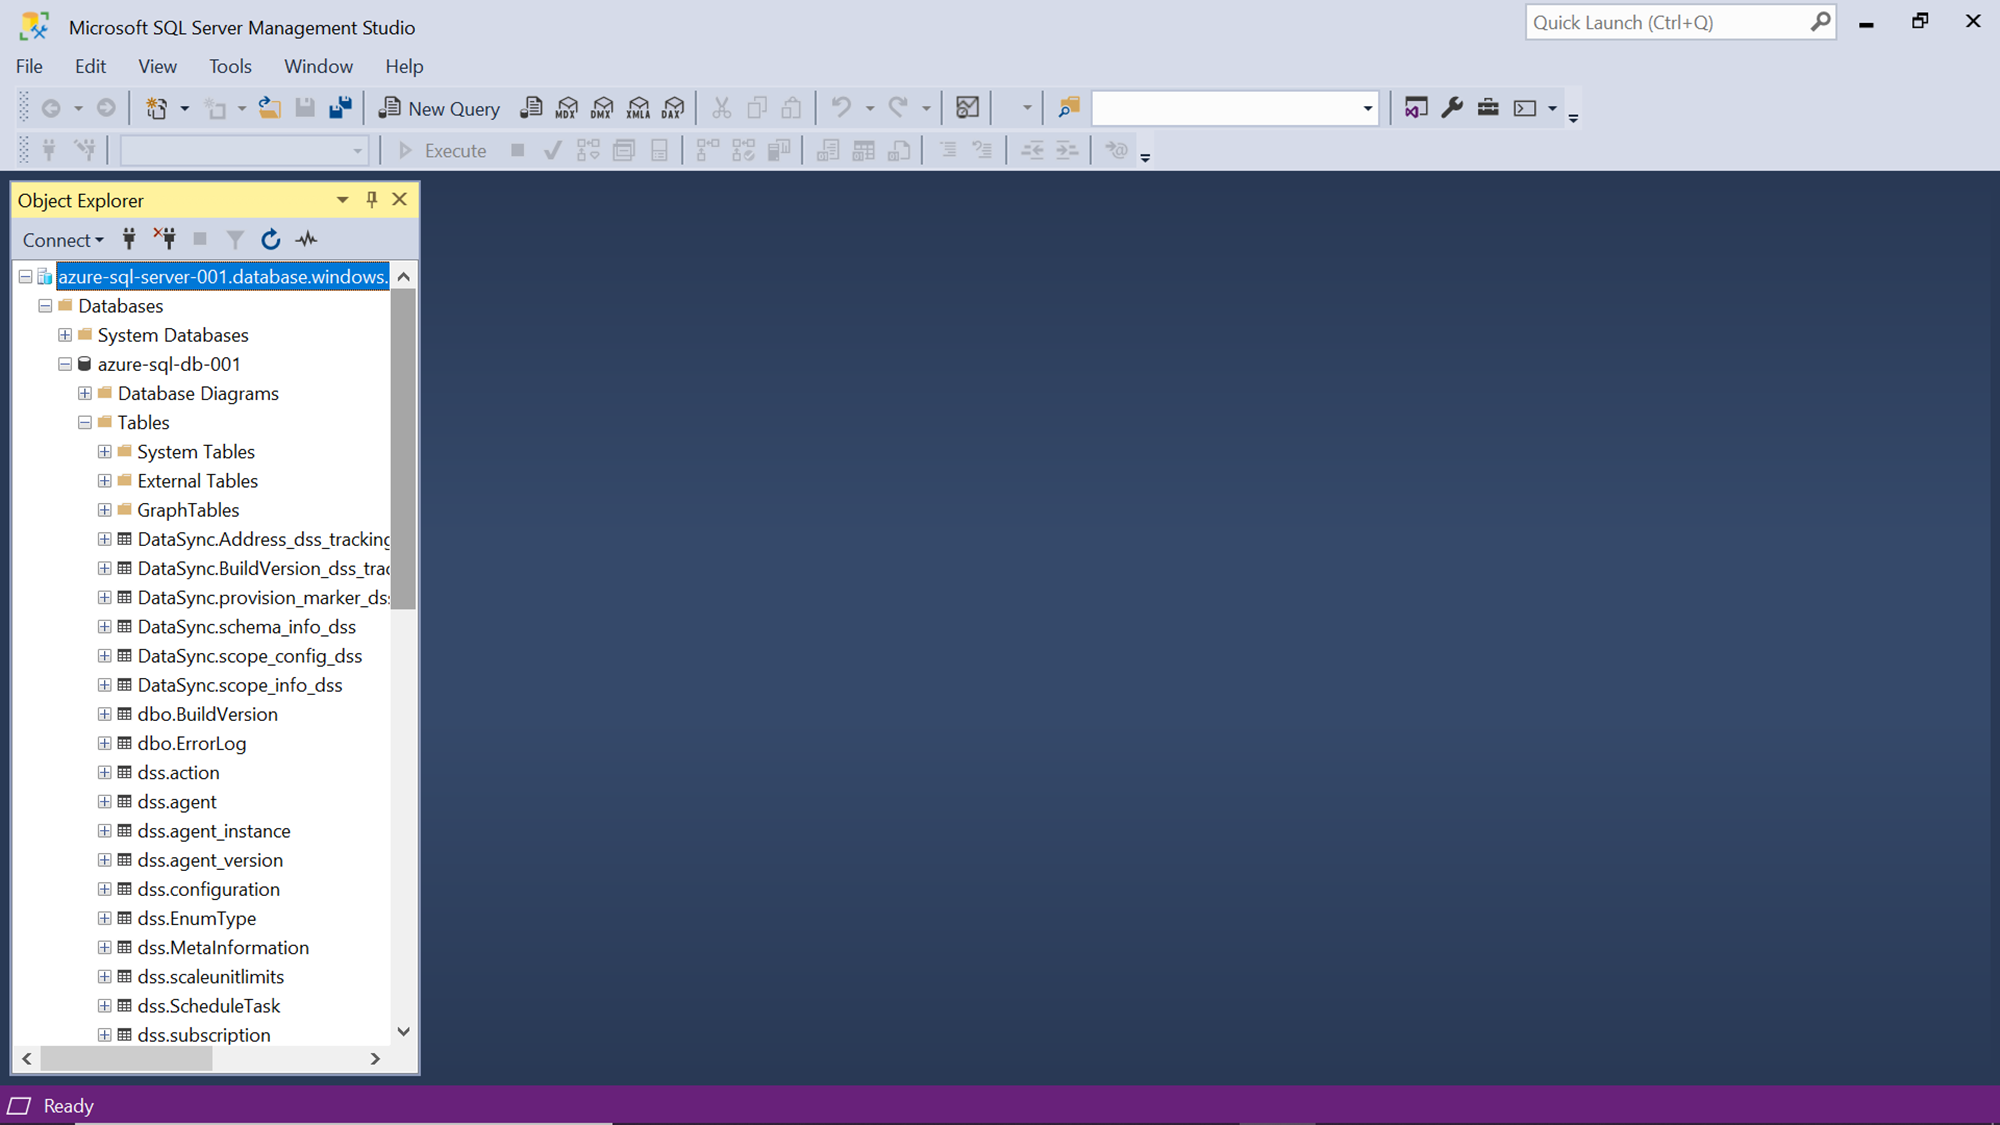
To ensure that the newly created database has sample data in it, connect to the same using SQL Server Management Studio and ascertain that it has some data with the desired variety and volume so that when we perform classification, we should be able to find some results for demonstration.
Data Classification and Sensitivity Labels
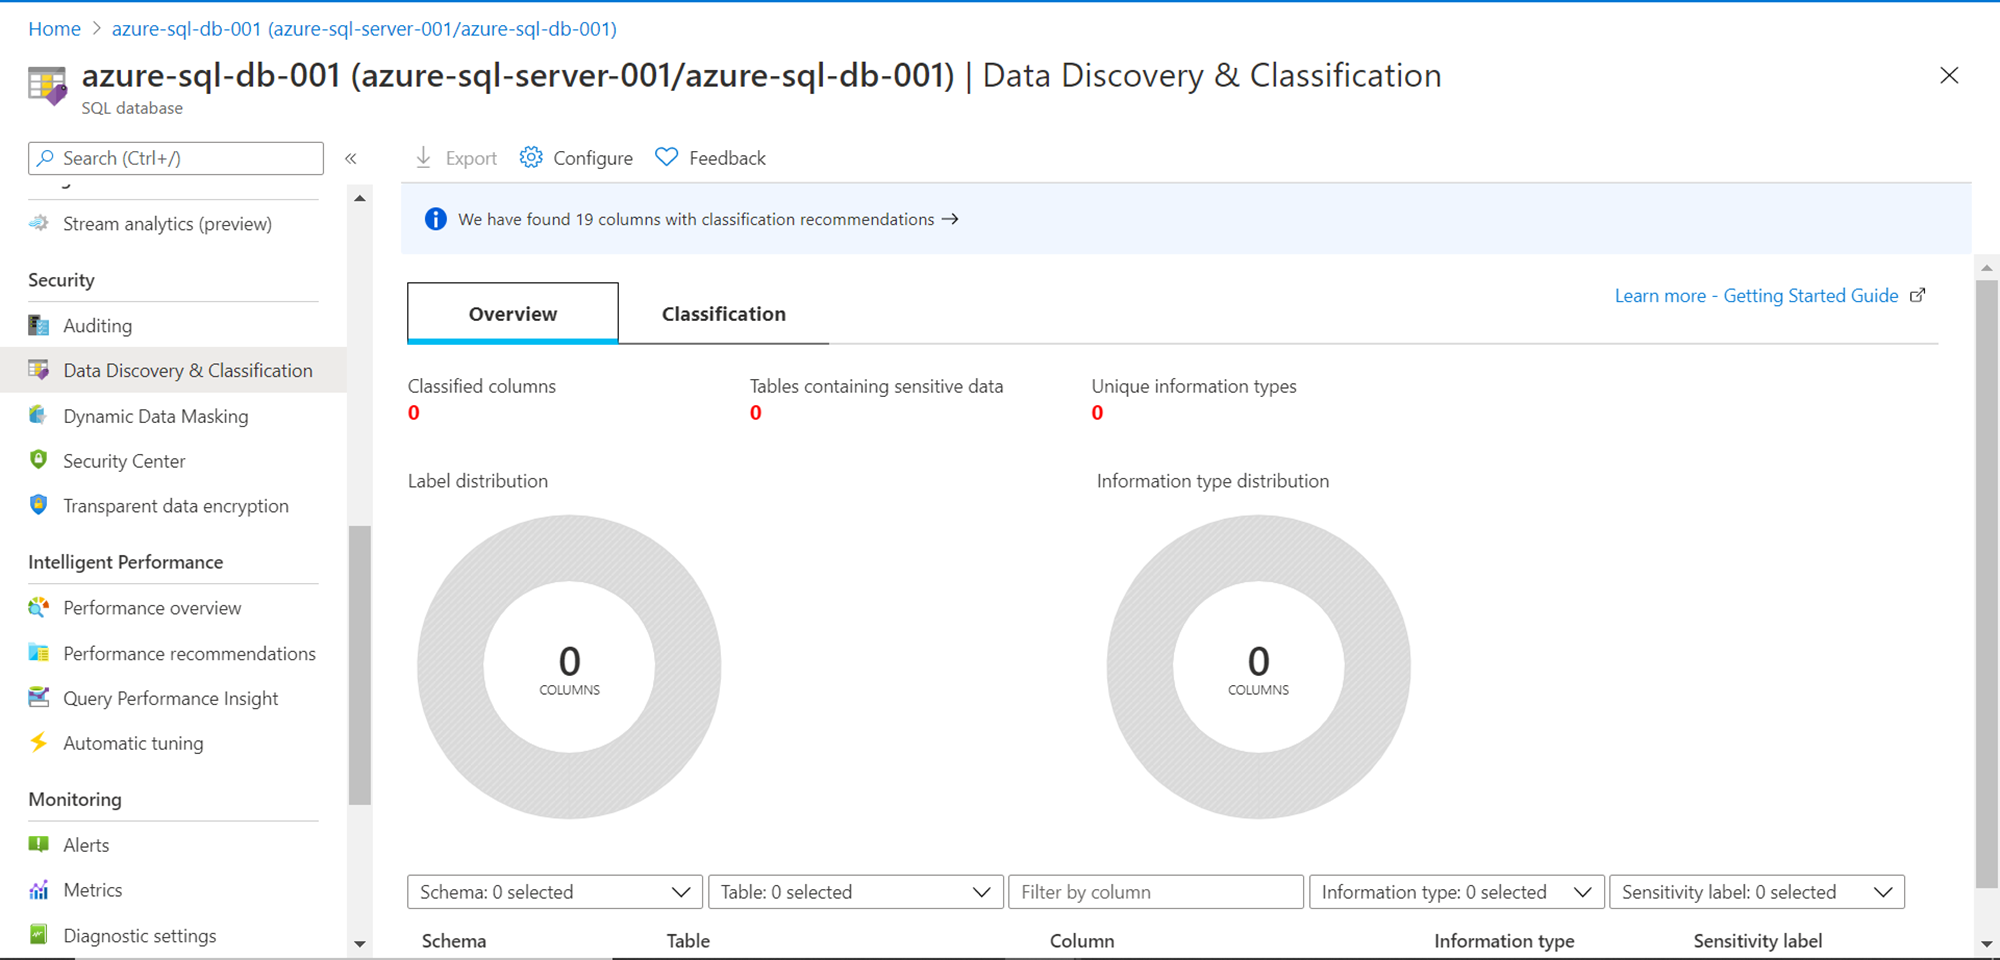
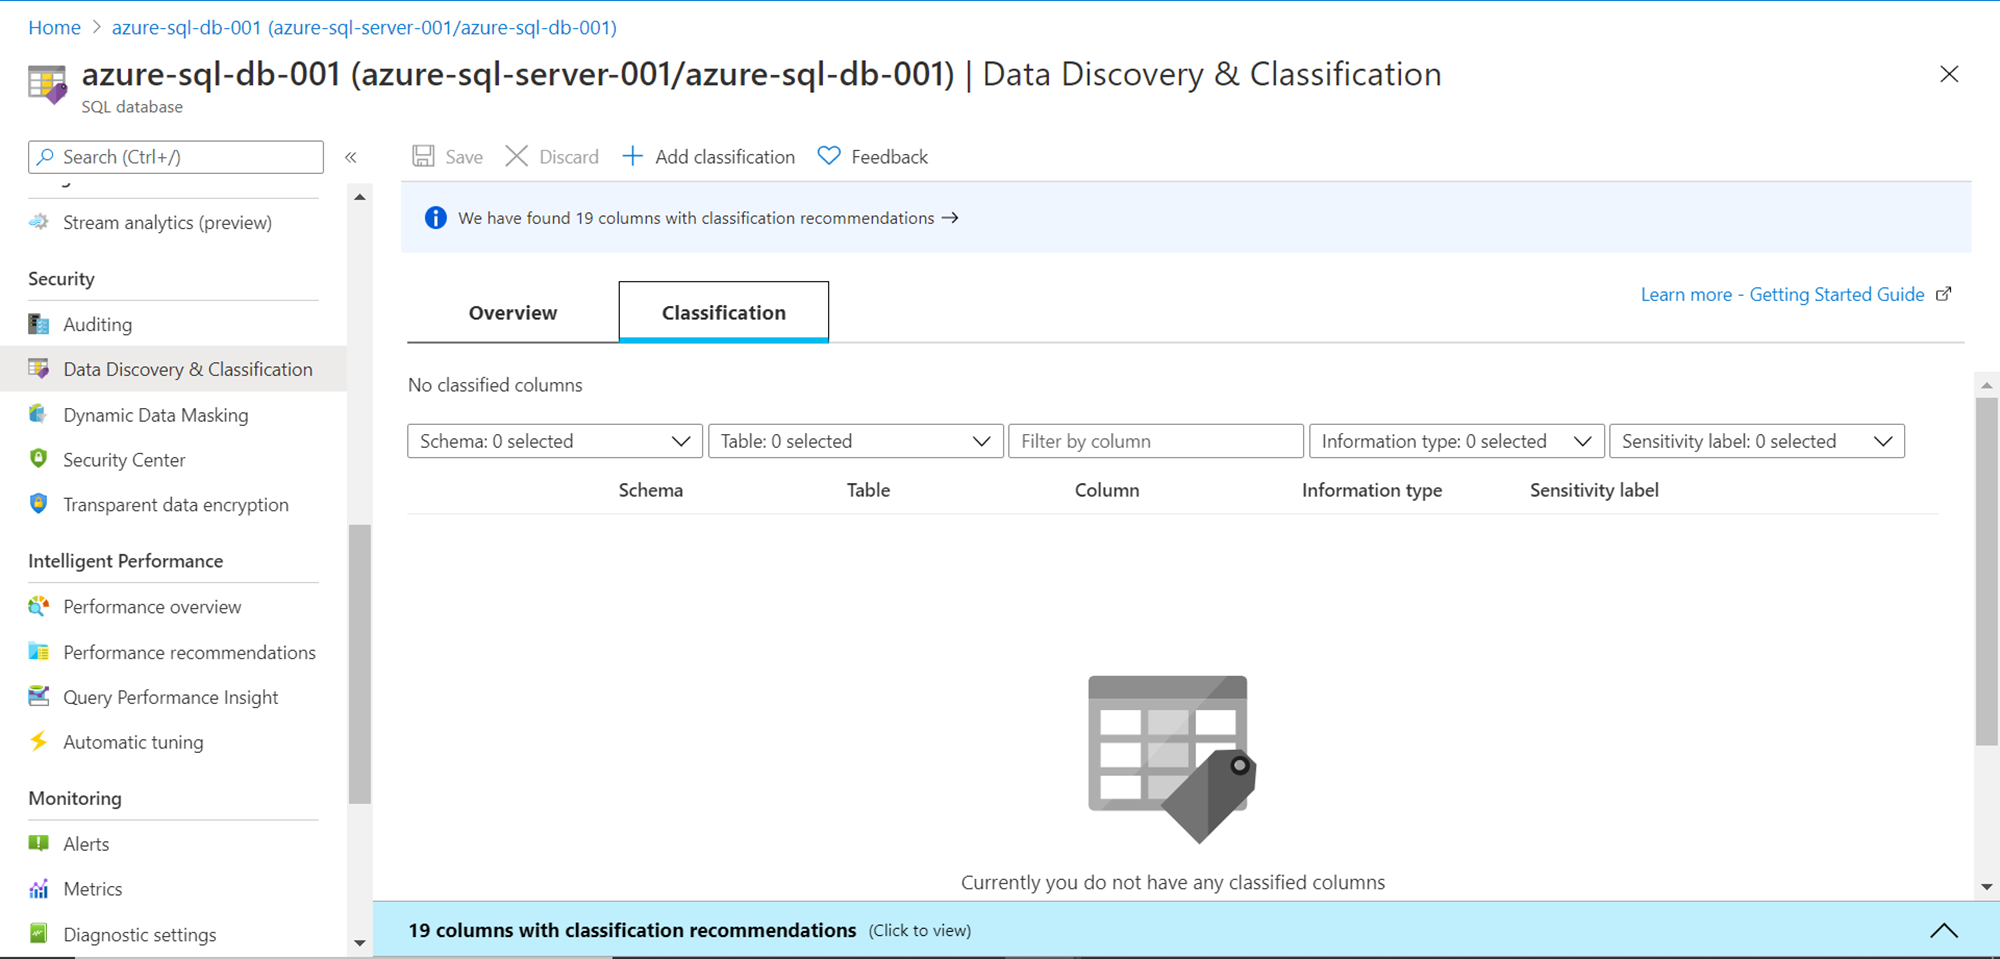
The first step to perform data classification is to learn what types of classifications are already available, assess the same, and add those that are missing. Navigate to the Data Discovery and Classification tab as shown below. By default, the classification is not performed on the data, until and unless actioned by the user. So, you won’t find any results in this tab as shown below.
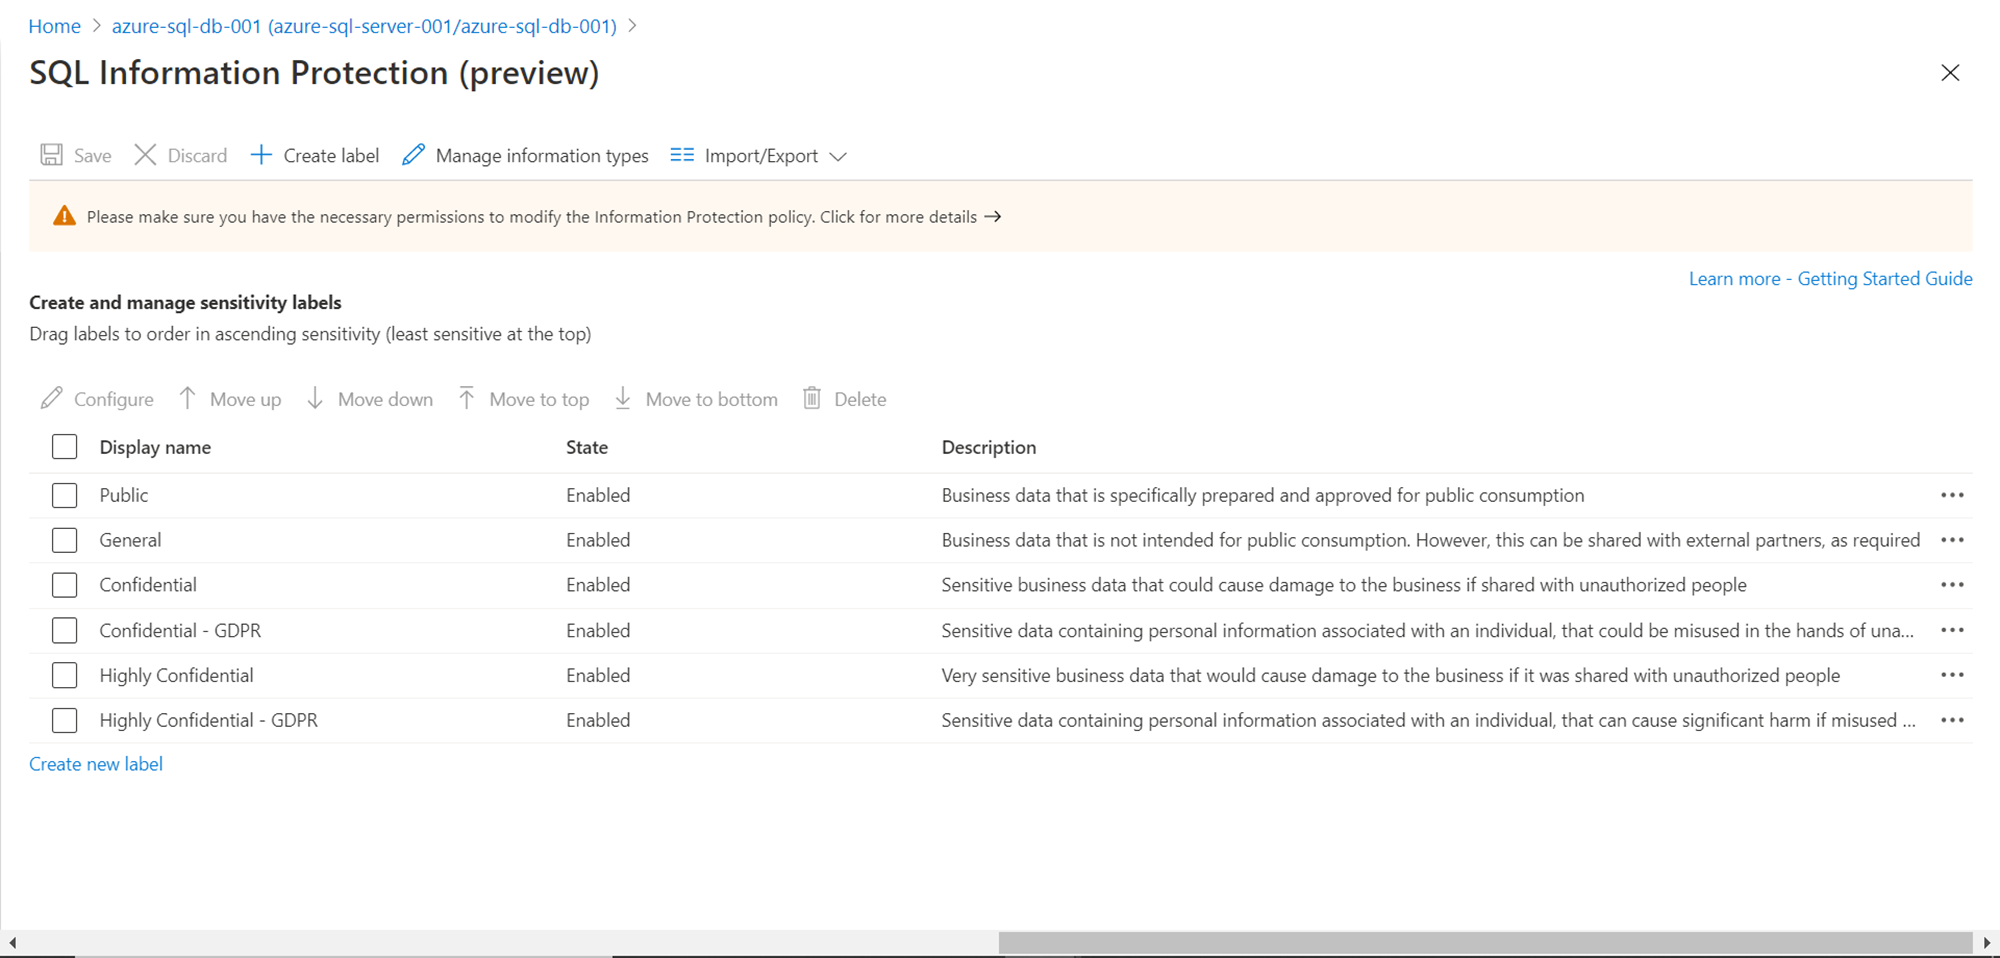
Those who are new to data classification can click on the Learn more link to learn more about the details. To learn more about the data sensitivity labels available out-of-box, click on the Configure button. It would show a list of sensitivity labels like Public, General, Confidential, Confidential-GDPR, Highly Confidential and Highly Confidential – GDPR. Along with these labels, we can also find a description of what this sensitivity classification means. While hosting sensitive data or personally identifiable information (PII) data on Azure SQL Database, these types of sensitivity labeling can be extremely useful for implementing role-based access control to sensitive data. If these out-of-box labels are not sufficient, we can create new labels as well by clicking on the Create new label button.
Now it’s time for us to classify the data. Click on the Classification tab, and you would find that there’s nothing that has been classified yet. But you would already find recommendations on the top, which means that the data has been scanned and identified for classification, but the classification has not been saved or applied yet.
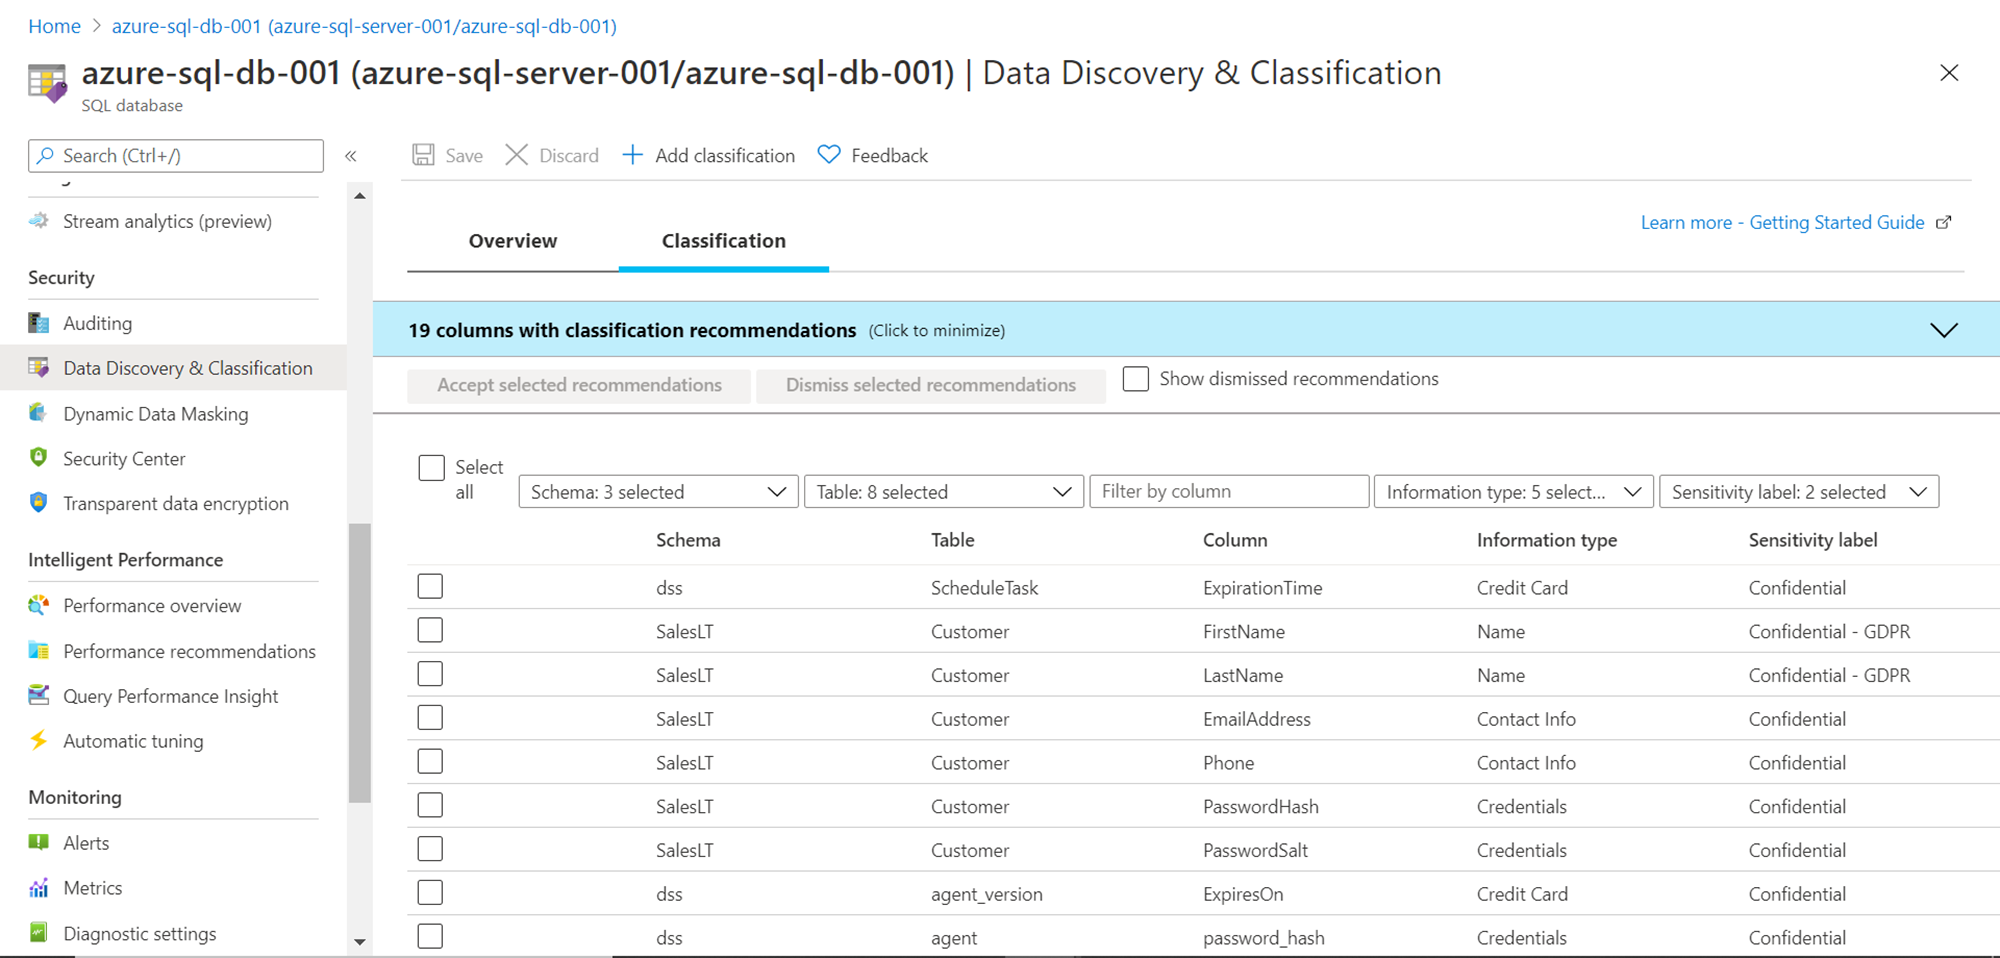
Click on the recommendations link on the top as shown above to view the list of recommended classifications. This would show up the details as shown below. If the data is very large, there can be an overwhelming amount of information here related to classification. To deal with it, we can use the filters to analyze the classified attributes and filter data by schema, tables, column names, information type as well as sensitivity label.
Assume that we want to accept all the classification recommendations, so select all the items in the list. This would activate the Accept and Dismiss buttons on the top as shown below. Here we have the option to accept or reject desired classifications.
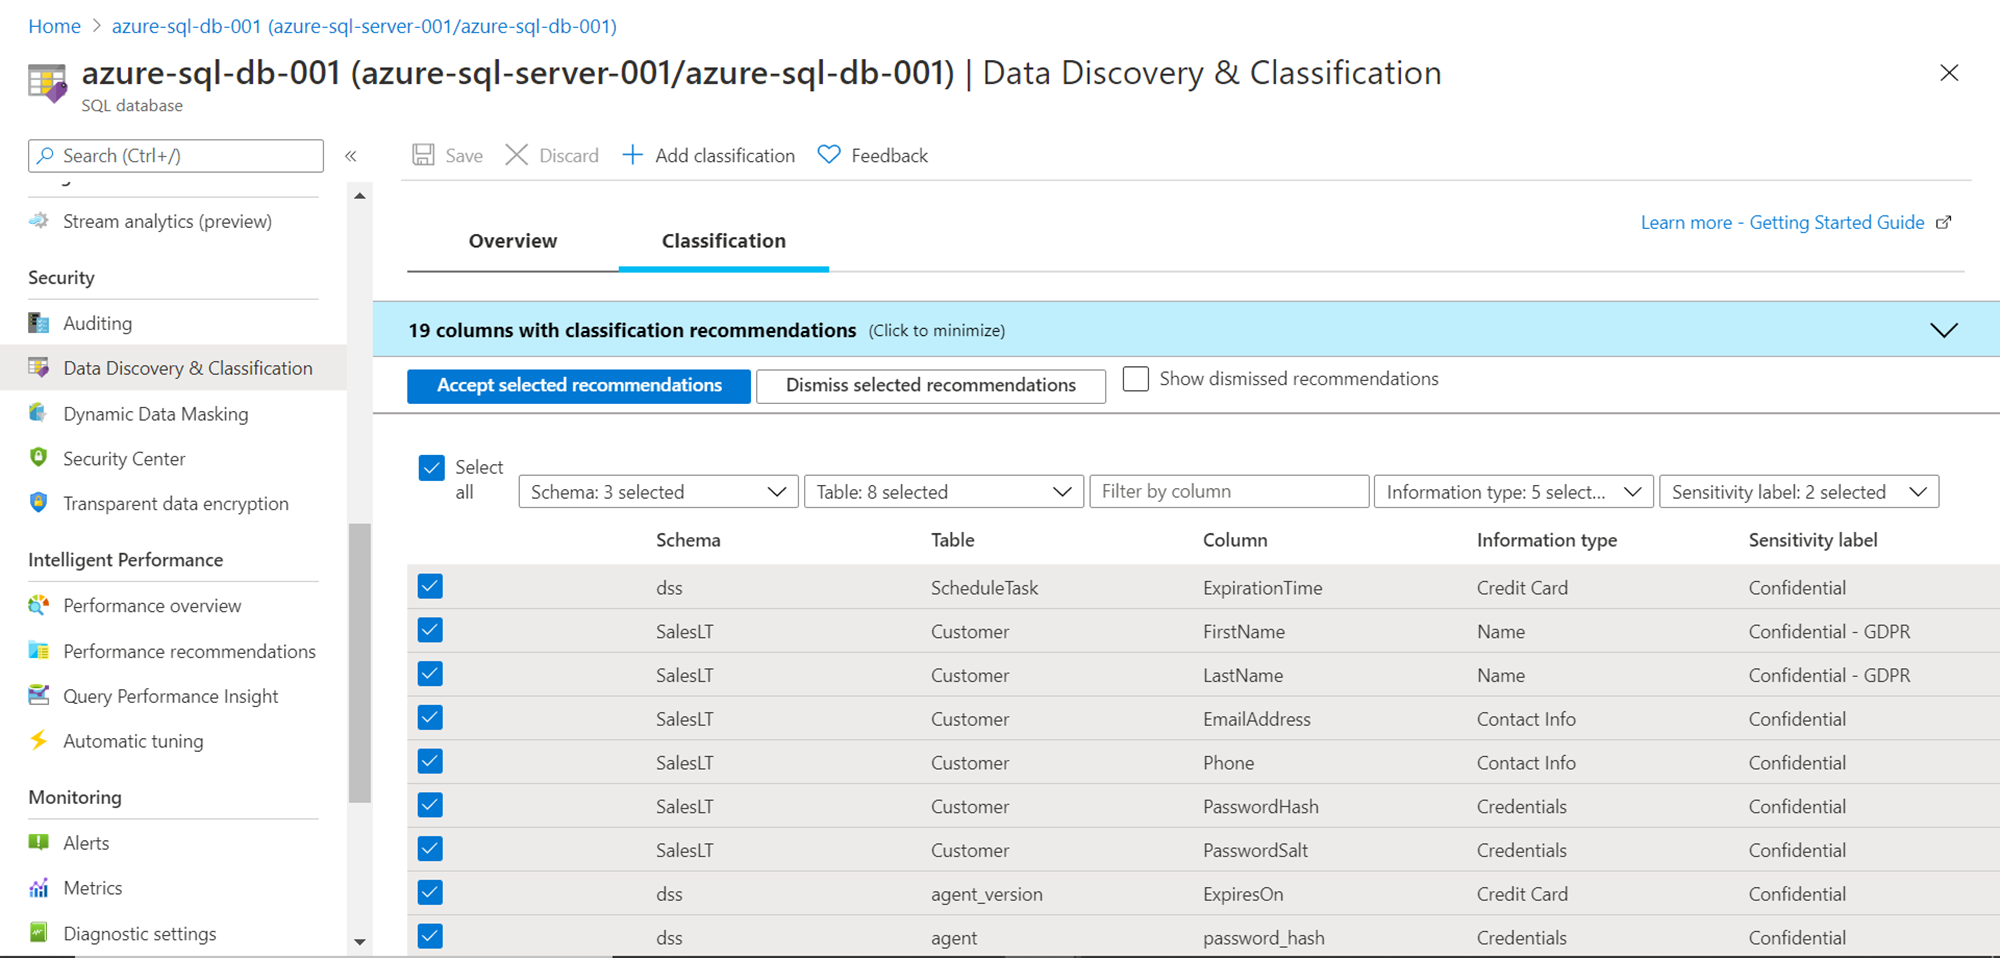
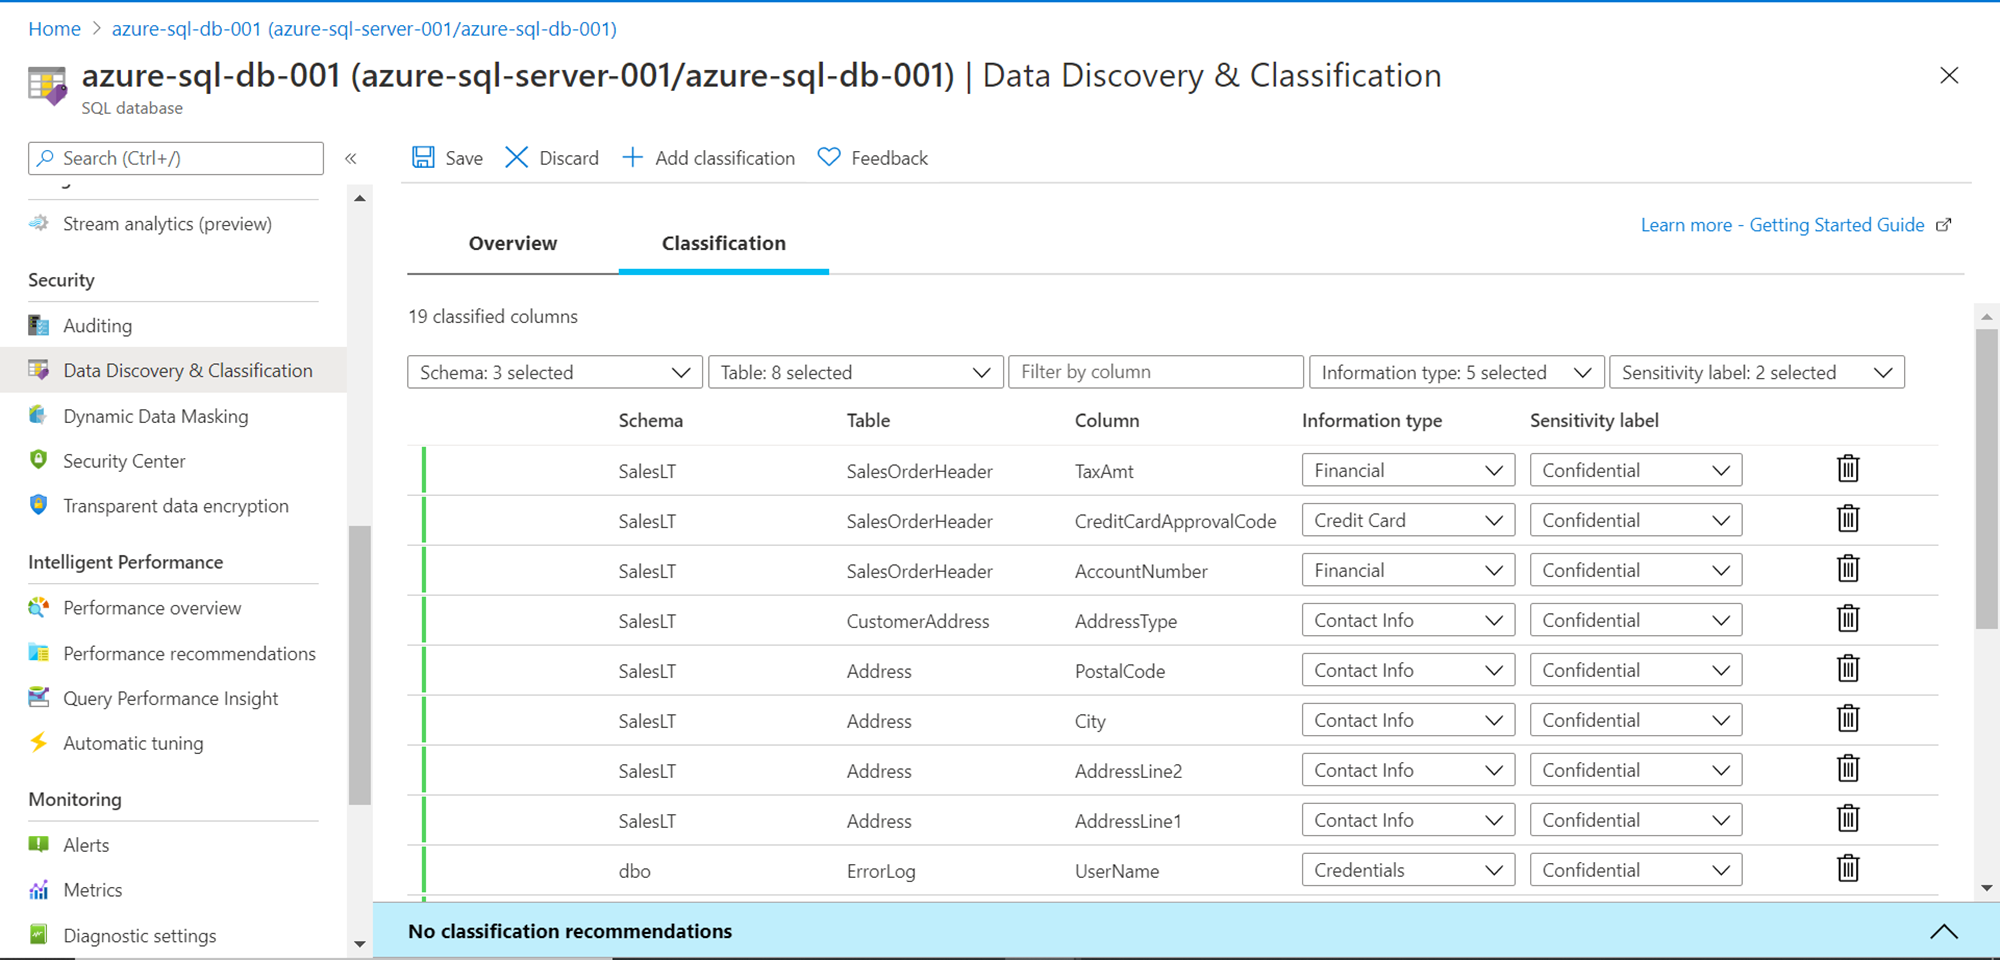
Once you click on Accept classification, you would be able to see a screen like this, and the Information Type, as well as Sensitivity Label, would become editable. Now we have the option to change the information classification as well as Sensitivity Label before finally saving. Once we have finalized the details, click on the Save button on the top to finally add it to the data.
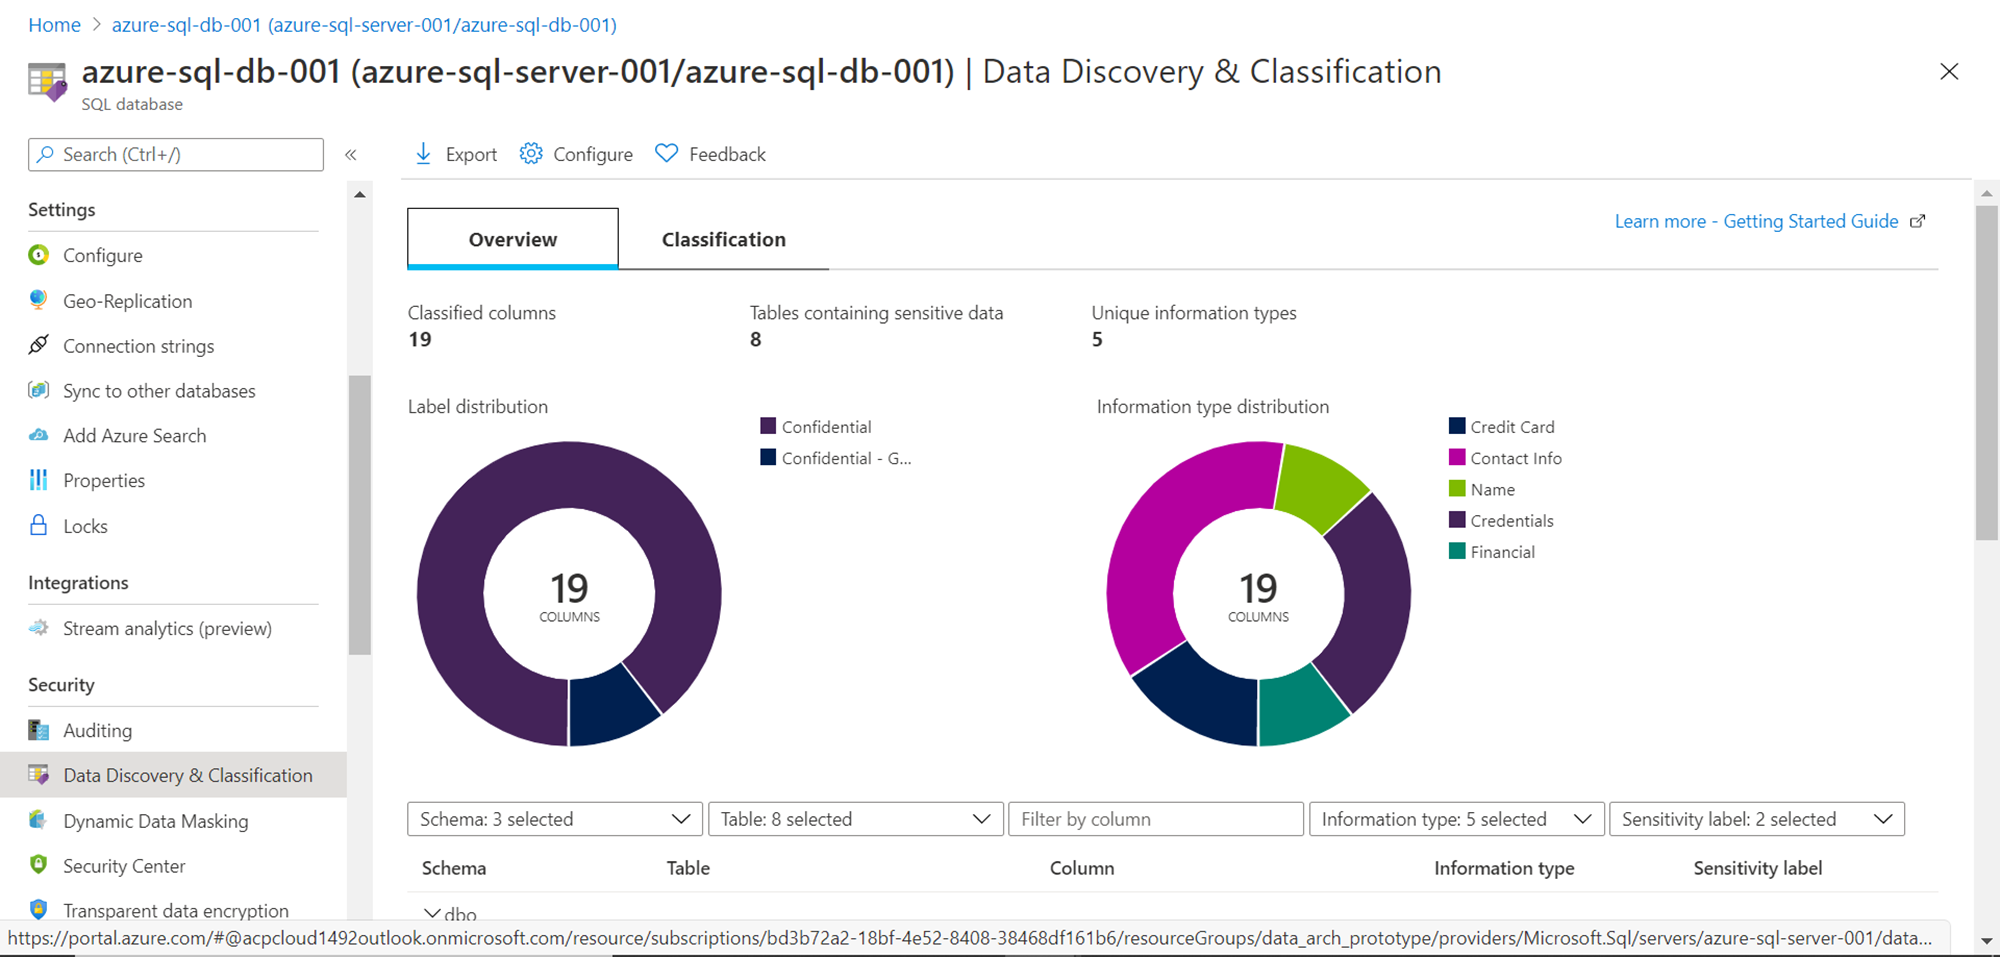
Navigate back to the overview section, and now you should be able to view results on the dashboards with some charts as shown below. This chart shows the distribution of classification as well as label types.
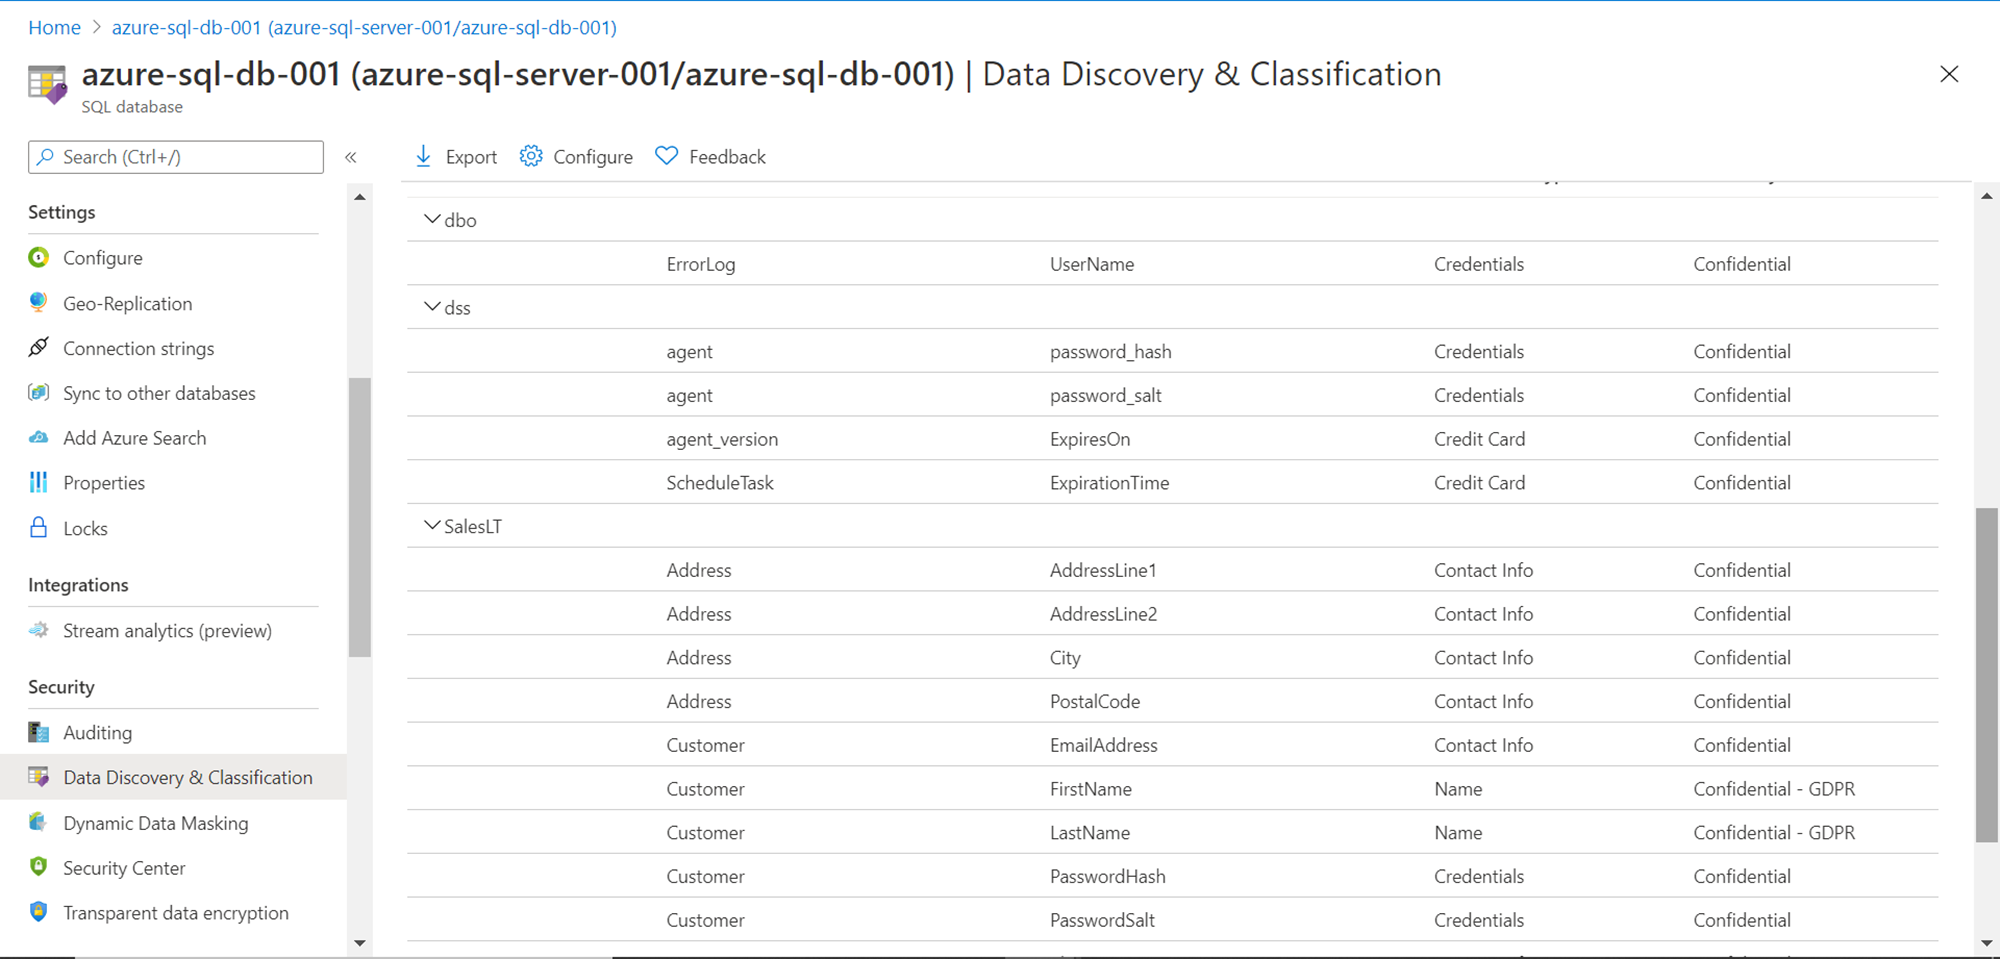
Scroll down further and you would be able to see a detailed list, which would show the same list that we accepted earlier. This list would be grouped by schemas as shown below – dbo, dss, SalesLT etc.
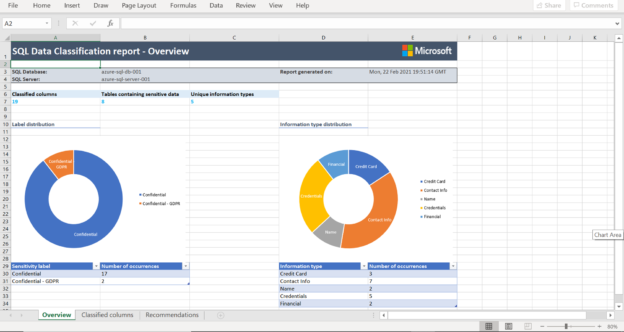
Now that we have the data already classified and sensitivity labels already attached, we may want to extract a report out of it. Power users cannot be expected to navigate to the Azure portal and access this report from here, as this is a typical administrator’s dashboard. An easy way to extract a report is by exporting this detail. Azure provides a convenient way to export it by using the Export button. Once we click on the export button, the report would be exported in Excel format and would be ready for download. Once downloaded, the report would look as shown below.

This report has all the details that we navigated through earlier in the Azure portal. In this way, we can classify the data, tag it with sensitivity labels and generate a report of the same from Azure SQL Database.
Conclusion
In this article, we started with an Azure SQL Server instance as well as Azure SQL Database along with some sample data. We learned how to use the features that let us classify the data, different types of sensitivity labels available out-of-box, administer the classification as well as generate a report of the finalized classification.

She has a deep experience in designing data and analytics solutions and ensuring its stability, reliability, and performance. She is also certified in SQL Server and have passed certifications like 70-463: Implementing Data Warehouses with Microsoft SQL Server.
View all posts by Gauri Mahajan
- Oracle Substring function overview with examples - June 19, 2024
- Introduction to the SQL Standard Deviation function - April 21, 2023
- A quick overview of MySQL foreign key with examples - February 7, 2023