
Azure storage is a core cloud storage service that is used by almost all application or database deployments. We use it in SQL Server for various requirements like for backing up our databases directly to blob storage or some clients prefer to host their databases in Azure blob storage to leverage snapshot backups functionality. Today, I will explore how to monitor and troubleshoot blob storage issues in the Azure cloud by looking into storage metrics and storage logging features of Azure storage. We can configure or enable both configurations to view graphs and visualize their metrics like how storage is performing in the Azure cloud during each transaction. We will be discussing two storage diagnostics features Storage Metrics and Storage Logging which are extensively used to identify a storage problem in the Azure cloud.
- Storage metrics
- Storage logging
Let’s start discussing the first option storage metrics in the below section.
Azure storage metrics
The storage metrics are very useful if you are facing performance issues or any error while uploading your data to Azure storage. It provides a detailed view in a form graph of each transaction of work requested by users or application to the storage. There are 2 types of metrics captured by storage analytics.
- Transactional metrics
- Capacity metrics
Transactional metrics are captured for all types of Azure storage like blob storage, queues, file shares, and tables whereas capacity metrics are captured only for blob storage. The transactional metrics include Availability, Egress, Ingress, Success E2E Latency, Success Server Latency, etc. whereas Capacity metrics include capacity, container count, and object count. The storage metrics can be viewed by accessing the Metrics option under the Monitoring menu page of a storage account on the Azure portal. We can also see it using storage explorer.
I have created a storage account named mdsstorage1 and verified its diagnostic settings by accessing Diagnostic settings (classic) under Monitoring (classic) settings as shown in the below image. We can see Azure storage hourly metrics are by default enabled once we created the storage account. The Status of diagnostics settings is set to On, if you don’t want to collect these storage metrics then you can toggle it to hit Off and then the Save button to apply the changes. Once you set the diagnostic setting to Off, storage analytics will stop collecting its storage metrics. As hour metrics are enabled as we can see this option is already checked so storage metrics will be gathered by storage analytics of Azure cloud.
Analyze Azure storage metrics data using Azure portal
I have created a storage account named mdsstorage1 as I discussed above followed by a new blob container mdblobcontainer and finally uploaded a few blob data in that container. Now, I will check the Azure storage metrics to visualize various parameters for this transaction. You can see the Azure blob container and uploaded blob data in the Azure blob storage account mdsstorage1.
Now, we will analyze its storage metrics. Click at Metrics option given under Monitoring setting from left side pane of storage account mdsstorage1. You will get the below screen to select desired scope, metric namespace, storage metric, and aggregation in the right-side pane as shown in the below image.
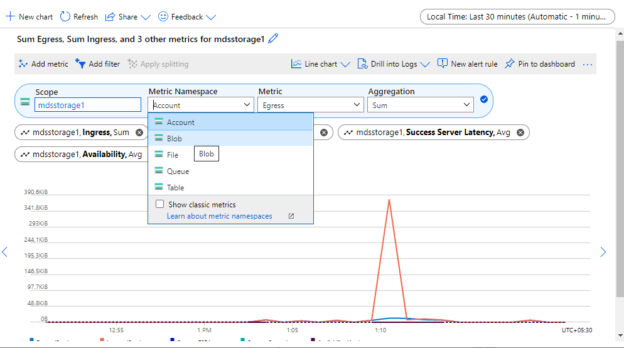
You can see I have chosen scope as newly created storage account mdsstorage1 and metric namespace as Account. You can also choose a specific storage type in a metric namespace like blob, queue, tables, and files. I have chosen to show details for a complete storage account and not a specific storage option.
The next option is Metric under which we will be choosing desired options like Availability, Egress, Ingress, Success E2E Latency, Success Server Latency, etc. as shown in the below image.
I have chosen all storage metrics showing under transactional metric from the above dropdown to display their graph for further analysis. Have a look at their utilization. You can add a new chart by accessing the New chart tab. You can also add or remove these storage metrics by clicking on Add metric from the below image or clicking at the cross button to remove that metric from the below graph.
If you want to see a similar graph for a specific storage type and not for a complete storage account, then you can choose your desired storage type from the Metric Namespace dropdown shown in the below image. The Account option will display the consolidated view of all storage types present in that storage account.
Enable Azure storage minutes level metrics
Above storage, metrics were showing based on the data collected under Hour metrics. We can also configure Azure storage metrics to storage and display minute metrics. We need to enable it by accessing Diagnostic settings (classic) under Monitoring (classic) settings as shown in the below image. Click at the check box given for Minute metrics in the right-side pane that is also highlighted in the dark red rectangle. Once you click on checkboxes, hit the Save button to apply this change to start collecting data for per minute metrics.
Again, uploaded a few blob objects to this blob container to track and analyze the Azure storage metrics.
Once again you can click on the Metric tab given Monitoring in the left side pane of the storage account. You can select various storage metrics from the right-side pane to display its graph and we can see its data in the below image. You can try it on your Azure account to understand it in a better way.
Analyze storage metrics data using storage explorer
We can also analyze storage metrics using Azure storage explorer. Launch storage explorer. Connect to the Azure account which you want to analyze. Expand Tables given under your storage account, you can see a lot of tables which names start with $Metric. These tables store all storage metrics-related data. I have clicked at $MetricsHourPrimaryTransactionsBlob to see hourly metrics data and you can see it in the right-side pane of this table. There are multiple columns there in the right-side pane which you can drag down to understand various parameters. You can also export this report and data for further analysis.
Azure storage logging
Storage logging is a feature to capture all transactions happening to a storage account. The storage logging feature is not enabled by default like storage metrics when you create a storage account. You need to manually enable it by accessing Diagnostic settings (classic) under Monitoring (classic) settings.
When we create a blob container, Azure creates a blob container named $logs under that storage account as shown in the below image. You can see when I created a storage account mdsstorage1, $logs blob container is also created but it is not saving any data until you enable storage logging from diagnostic settings.
You can see $logs container doesn’t have any logs data when we check it from storage explorer in the above image and through the Azure portal in the below image.
Now, let’s enable the storage logging to capture all storage logs for a storage account in the next section.
Enable Azure storage logging
Log in to the Azure portal. Access your storage account. Click on Diagnostic settings (classic) given under Monitoring (classic) settings as shown in the below image. You can see the Logging configuration in the right-side pane which I have highlighted in the dark red rectangle.
There are 2 versions of Logging, 1.0 and 2.0. I have chosen the 2.0 logging version from its dropdown and clicked at the checkboxes given under Logging and finally hit the save button to apply this change on this storage account.
Now, let me go ahead and upload some blob objects to this storage account to see whether Azure is capturing these logs in the log file or not post enabling its settings in the above steps. Below is the screenshot of all files started with IMG* which I have uploaded to this blob container.
Analyze storage logs using storage explorer
Let’s analyze the storage logging using storage explorer. Launch storage explorer and connect to your Azure account under which the target storage account is created. I have connected to the Azure subscription under which my target storage account is created. I expanded the storage account mdsstorage1 and then its blob container mdblobcontainer to verify all blob objects are visible using storage explorer or not. We can see all blob objects which we had uploaded in the above steps in the right-side pane of this blob container.
The next step is to see the $logs container which is showing just above our blob container under which we have uploaded all objects. We can see a bob folder in the right-side pane when we click on the $logs container. Note, there was no folder in the right-side pane when we had accessed this $logs container before enabling storage logging of this storage account.
Double click on the above folder, you will get another folder named 2021, keep double clicking on all folders until you get the log file 00000.log as shown in the below image. You will notice log file is saved under multiple folder structures because each folder is created for year, month, date, and time. Various options are showing in the right side pane like upload, download, open, etc. If you want to download this log file then you can click on the Download button, it will give you another window to locate your target location where you want to save this file.
I have downloaded the above log file in the below location Downloads\bloblogs under which the log file is showing. You can open it to read its log files. I have opened and can see the log entries for each image we have uploaded on that storage account. If you are facing any issues or errors, then all those details will also be captured in this file.
Analyze storage logs using Azure portal
We can also access this Azure storage logging details using the Azure portal. You need to open your Azure storage account then click on Containers from the left side pane and finally click on the $logs container showing in the right side pane of the below image.
You can see the details of this log file in the below image. The folder structure is the same as it was shown in the storage explorer. You can also download this log file using the Download button shown in the dark red rectangle. There are various other properties of this log container that can be accessed using below the page.
Conclusion
Today I have explained two Azure storage diagnostics using which we can monitor and troubleshoot storage transactions in case of any issue on their performance. These are storage metrics and storage logging. Both storage diagnostics are very useful in understanding and addressing any storage issues. Keep accessing them in case you have any storage issues in the Azure cloud.

He loves to talk and write about database technologies. He has lead and delivered many projects from designing to deployments on Migrations to the cloud, heterogeneous migrations, Database consolidations, upgrades, heterogeneous replication, HA / DR solutions, automation, and major performance tuning projects.
You can also find him on LinkedIn
View all posts by Manvendra Singh
- Configure backup storage redundancy for Azure Cosmos DB account - May 15, 2024
- Difference between SQL SELECT UNIQUE and SELECT DISTINCT - January 16, 2024
- How to do a group by clause - April 12, 2023