
Setting alternate row colors in SSRS (SQL Server Reporting Services) is an important visualization configuration for end-users so that they can easily view their reports. However, setting alternate colors in SSRS is not a click of a button configuration like in the Microsoft Excel.
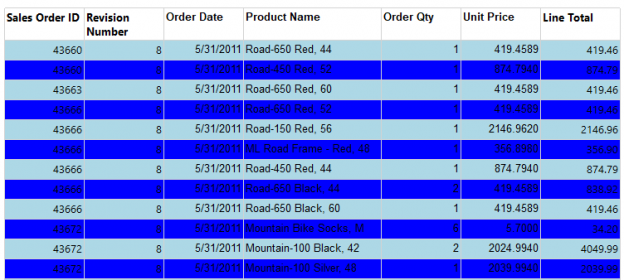
The following screenshot shows the output in Microsoft Excel when the Alternate row color is set for a table.
However, in SSRS this is not straight forward as in Microsoft Excel shown in the above screenshot.
Let us configure a report in SSRS.
SSRS Sample Report
Following is the SSRS project solution.
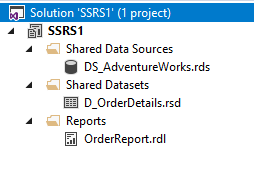
First, the data source is created for the AdventureWorks sample database in any SQL Server instance. After the data source creation, the next step is to create a data set with the following t-SQL code.
|
1 2 3 4 5 6 7 8 9 10 11 12 13 14 15 16 17 18 19 |
SELECT SO.SalesOrderID ,SO.RevisionNumber ,SO.OrderDate ,P.NAME AS ProductName ,SOD.OrderQty ,SOD.UnitPrice ,SOD.LineTotal FROM Sales.SalesOrderDetail AS SOD INNER JOIN Sales.SalesOrderHeader AS SO ON SOD.SalesOrderID = SO.SalesOrderID INNER JOIN Production.Product AS P ON SOD.ProductID = P.ProductID WHERE SOD.SalesOrderID IN ( 43660 ,43663 ,43666 ,43672 ,43682 ,43685 ) ORDER BY SO.SalesOrderID |
Please note that only six orders are used for demonstration purposes. Also, the data set is sorted by the order by OrderID for the demonstration purposes.
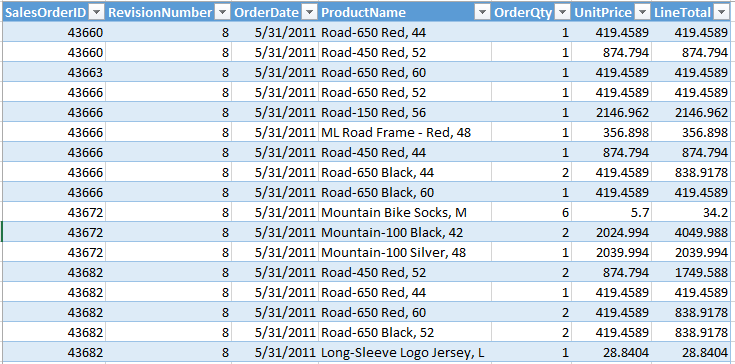
Next is to create a table in the SSRS report and link with the data set and you will see the following report.
No major formatting was done to the report except for the rounding the Line total to the two decimal points.
Alternate Row Colors in SSRS for Table
The next task is to set alternate row colors in SSRS in the above SSRS Report.
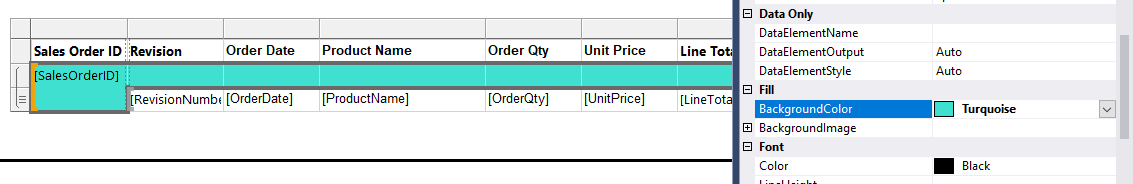
Right-click the data row as shown in the below screenshot, click F4 or properties window in the View menu.
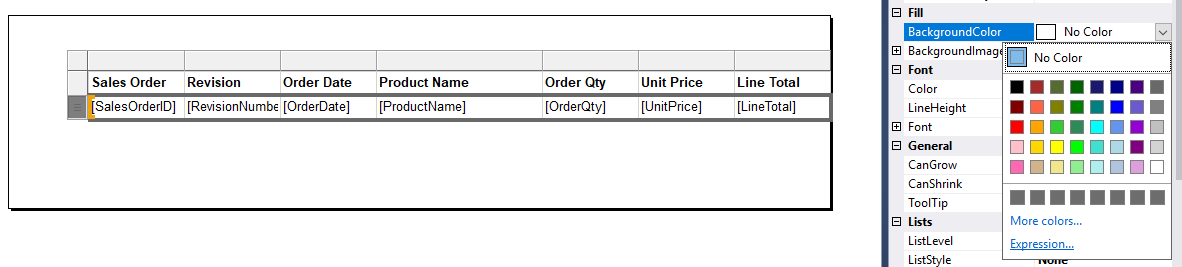
When selecting this, you will see the BackgroundColor option. By default, it is No Color, which means that there is no color for the background and use can select any colors. However, those options will provide a report with the same colors for all rows, not for alternate row colors in SSRS Report as required.
You can select the Expression… option in the listed options which will give you a screen when you can enter an expression.
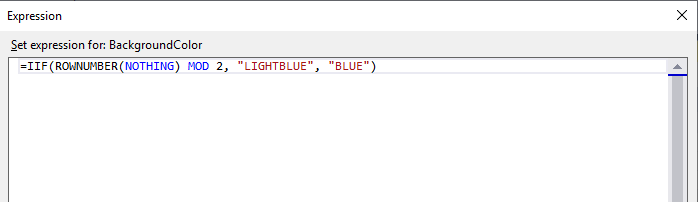
In the expression, ROWNUMBER function is used. ROWNUMBER will be the row number for the row. The method used in this case is that the odd row numbers are light blue while the even row numbers are blue. Odd rows are found by for the rows which has reminder 1 when the row number is divided by 2 and similarly, the even rows are the rows which will be the reminder 0 when the row number is divided by 2. This entire logic is used with the IIF and ROWNUMBER functions as shown in the above screenshot.
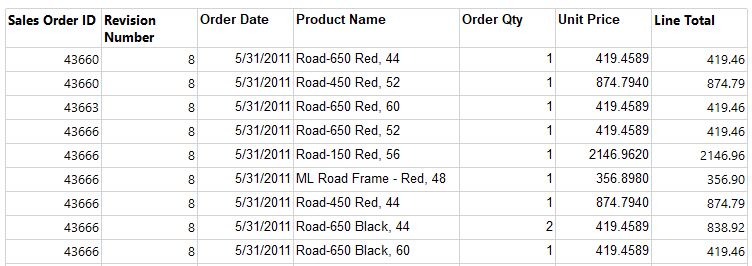
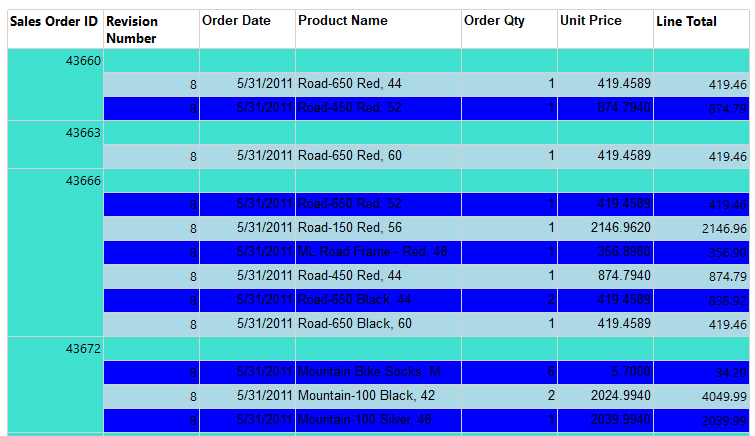
Then the SSRS report is shown as following which has alternate row colors.
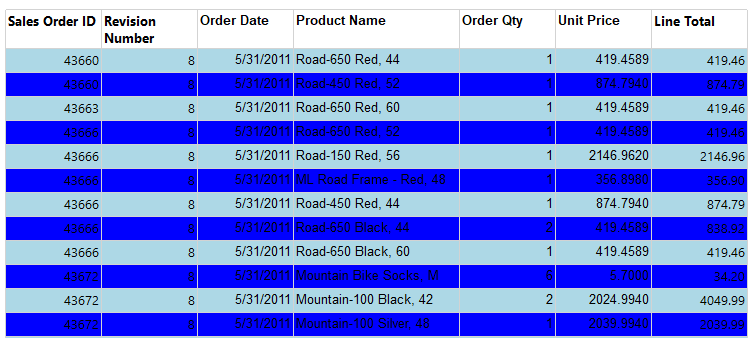
Now this will be same as what you get in Microsoft Excel.
Alternate Row Colors in SSRS When Grouping
In SSRS, typically you add groups to the detail records. For example, in the above report, the Sales Order ID is repeated in the above data set. This means that the report can be grouped by the Sales Order ID and when the grouping is done, the report will be looked like the following screenshot.
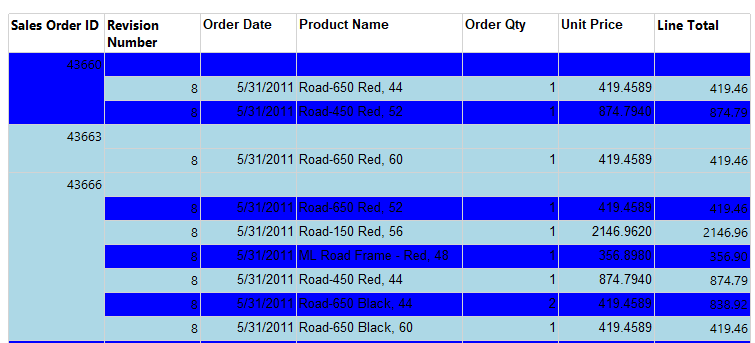
You will observe that background color has gone wrong for the grouping rows. This is because an additional row is introduced to the grouping column. To avoid this, the background color of the grouping row should be modified accordingly.
Then the report will look like the following screenshot.
Alternate Row Colors in SSRS Matrix Control
Matrix is an SSRS control from which you can have dynamic columns and rows. This means that unlike in the previous example of tables, in the matrix control, columns will grow.
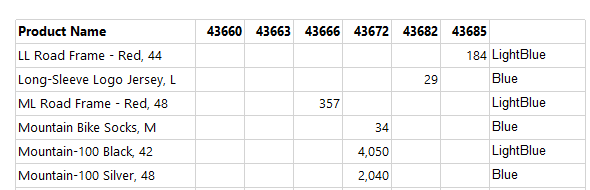
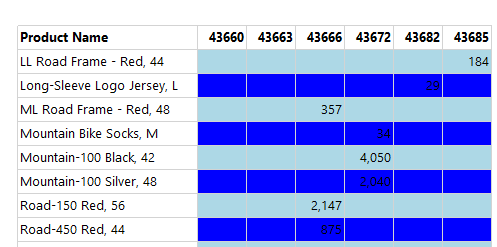
In the following report, order numbers are in the columns while the product names are in the rows. In case you get a new order number that will appear in the next column.
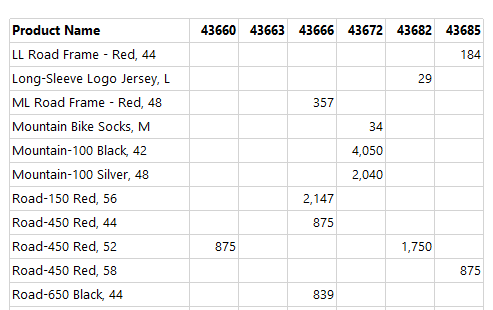
Due to this dynamic nature of the report, the previous simple rule will not work for matrix. If you apply the same rule, the alternate color will occur not at the row level but for every value in the matrix.
This means we need a new approach for the reports with matrix control.
-
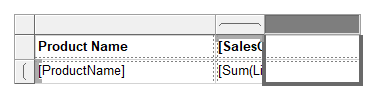
Add a column outside the dynamic columns which are shown in the following screenshot and highlighted column is the newly added column

-
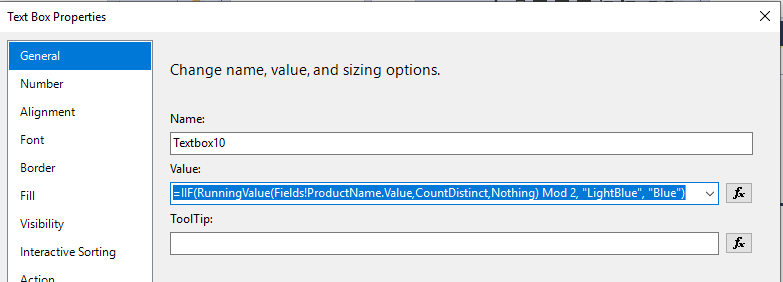
Then add an expression to the newly added column as shown in the below screenshot. This column is Textbox10
Expression is : =IIF(RUNNINGVALUE (Fields!ProductName.Value,CountDistinct,Nothing) Mod 2, “LightBlue”, “Blue”)
It is similar to the previous expression, but only thing is, RUNNINGVALUE for the grouped column which is the Product Name is used.
Now you will get the color into the text value as shown in the below screenshot:
-
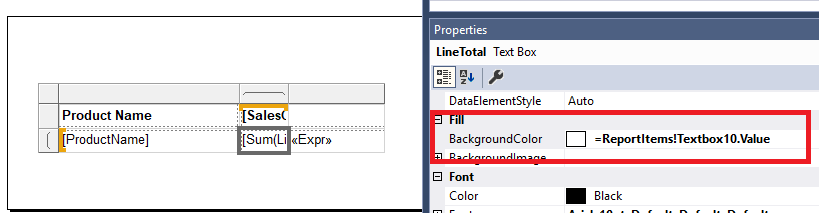
Next step is to get the background color from the value of the newly added column. Since the color is available the newly added column, that color can be set to the background of the matrix row
-
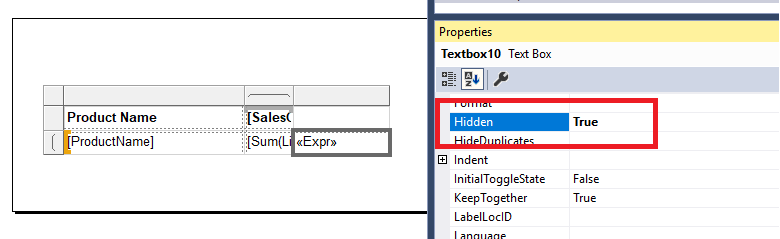
Next is to hide the newly added column since this column is used only as an internal column to the report. This can be done by setting the Hidden option to True
Finally, the report will look like the following screenshot.
In both the modes, a new the column is added, and it will automatically get the necessary background color so that it does not need any additional configurations. Also, instead of the name of the color, you can use the color code which can be taken from the RGB Color Codes Chart

View all posts by Dinesh Asanka
- Testing Type 2 Slowly Changing Dimensions in a Data Warehouse - May 30, 2022
- Incremental Data Extraction for ETL using Database Snapshots - January 10, 2022
- Use Replication to improve the ETL process in SQL Server - November 4, 2021