
Activity Monitor provides values for a pre-defined set of SQL Server performance metrics. These sets cannot be customized, nor additional ones added. Data collection also has pre-defined performance metrics sets, although it enables creating new ones through code. Both features provide only basic performance information, insufficient for any deeper analysis or troubleshooting.
Standards SQL Server Management Studio reports provide basic information about memory consumption, processor time used by queries, SQL Server configuration, settings, etc., commonly needed for performance monitoring and troubleshooting. These are available for different database object types and at different levels. The most numerous are standard reports at SQL Server instance level. Although they provide a wide range of performance related information, the standards reports don’t provide enough details for analysis, issue pinpointing, and troubleshooting.
To help SQL Server DBAs obtain more details about performance metrics, Microsoft has created a set of free performance dashboard reports . These are actually custom reports created to provide frequently required deeper performance monitoring information, not available in the standard reports. As such, they can be additionally modified and tweaked.
If these still don’t provide enough information about performance metrics, you can create a custom report yourself.
What is a custom report?
A custom report is an rdl file created using Report Definition Language (RDL).
It presents the data obtained by T-SQL queries and stored procedures from SQL Server databases in a format you specify. You can use any of the built-in report layouts and tweak it later.
To understand an rdl file, start with opening it in a text editor. It’s an XML file where the first part contains the report layout information (in the ReportItems or ReportParameters tag) and the second contains code used to retrieve the data shown in the report (in the DataSets or DataSources tag).
Custom reports are available in SQL Server 2005 Service Pack 2 and later.
Prerequisites
To create a custom report, you need SQL Server Data Tools (SSDT).
SQL Server Data Tools can be installed using its standalone installer or the SQL Server installer. It is available in all SQL Server 2012 and later editions, except Express and Express with Tools, and is a replacement for Business Intelligence Development Studio (BIDS).
SQL Server Data Tools is contained in the Visual Studio Shell.
How to create a custom report
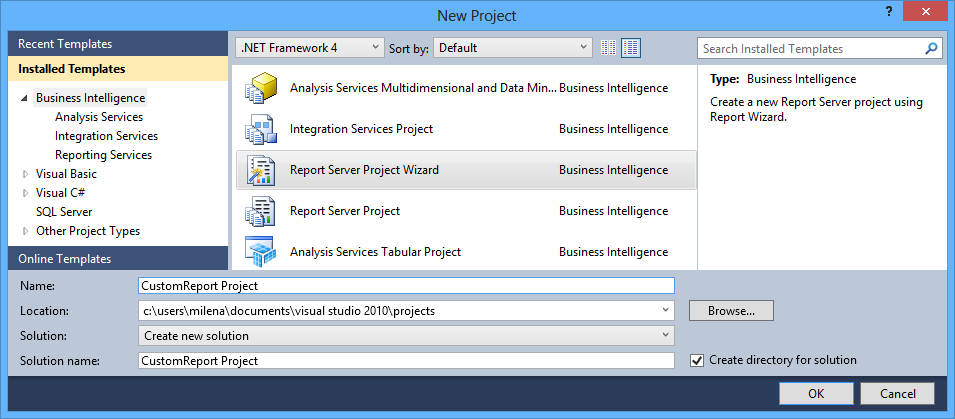
- Start SQL Server Data Tools
- In the menu, select File, then New | Project
- In the Installed Templates list, select Business Intelligence, Report Server Project Wizard
Modify the Name, Location, Solution, and Solution name if needed and click OK

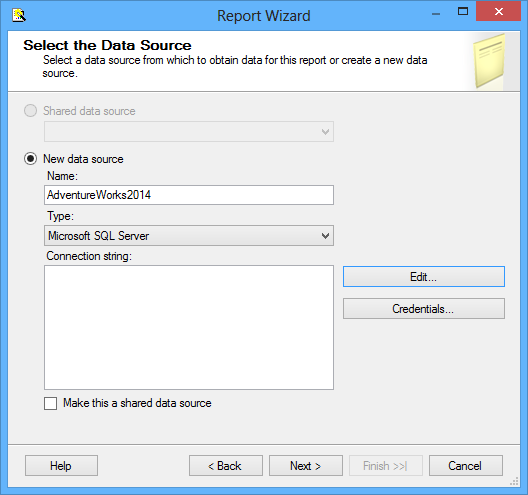
In the Report Wizard, select New data source, enter a name that describes the data source, and select Microsoft SQL Server as Type
- If you want to enable other reports in the project used this data source, check the Make this a shared data source option
- Click Edit
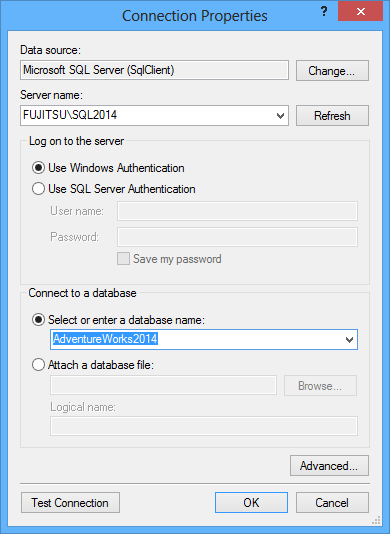
Select the SQL Server instance name from the drop-down list, authentication type, and database name
- Test the connection to check whether the settings are correct
- Click OK
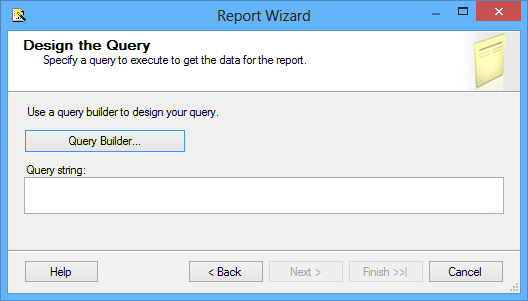
In the Design the Query step, click Query Builder
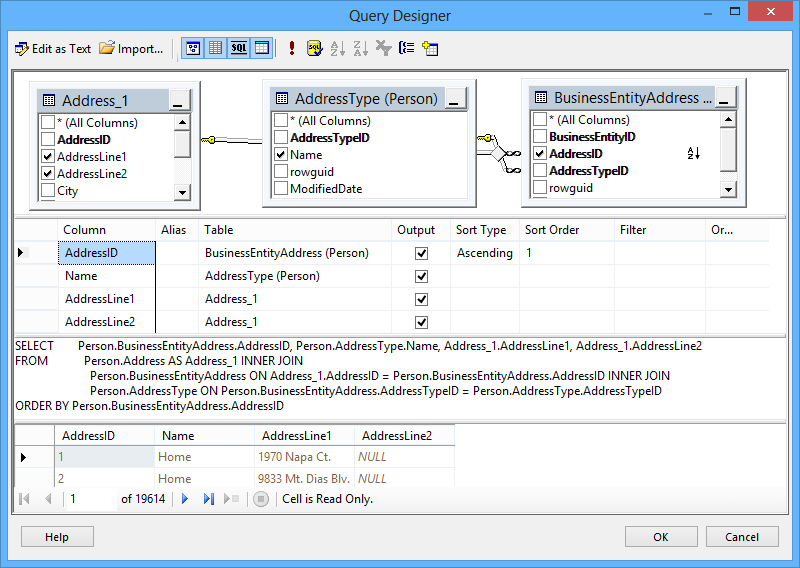
Query Builder enables you to create code that retrieves the data shown in the report either by using visual presentation of tables, views, functions, and synonyms (similar to View designer in SQL Server Management Studio), or by writing code manually.
If you use the visual presentation, add the objects you will query using Add Table in the menu and select the check boxes of the columns you want to see in the report.
Keep in mind that some of the statements, including the CROSS APPLY that we will use in the following example, cannot be presented graphically. The objects used in such queries will not be shown in the Diagram pane, and an error will be shown. Nevertheless, the T-SQL statement will be executed correctly. Also, note that system objects (including dynamic management views) cannot be added via the Add Table icon in the menu.
There is a workaround to get a system object in the Diagram pane and combine it with other objects. Paste into the SQL pane and execute a statement that contains the system object you want to show, such as:
123SELECT * FROM Sys.Dm_Exec_Query_StatsAnd use Add Table to add additional user tables.
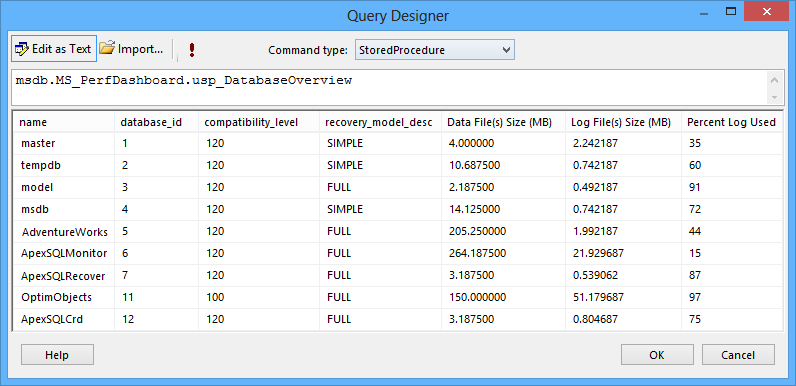
Query Builder supports two command types: text and stored procedure. To toggle between these two types, click Edit as Text in the menu.
The text command type works with T-SQL statements, the same as in SQL Server Management Studio Query tabs.
When you want to execute a stored procedure, use the stored procedure command type. You don’t have to write anything other than the stored procedure name (not even EXEC or EXECUTE). You can add the stored procedure parameters once you click Run in the menu.
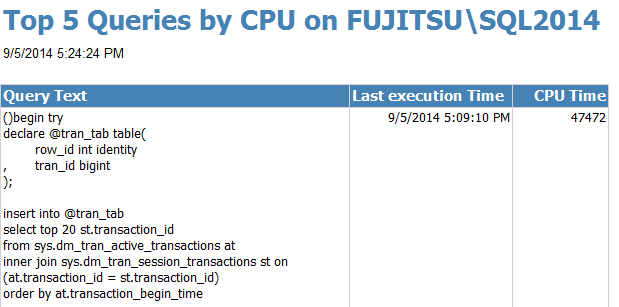
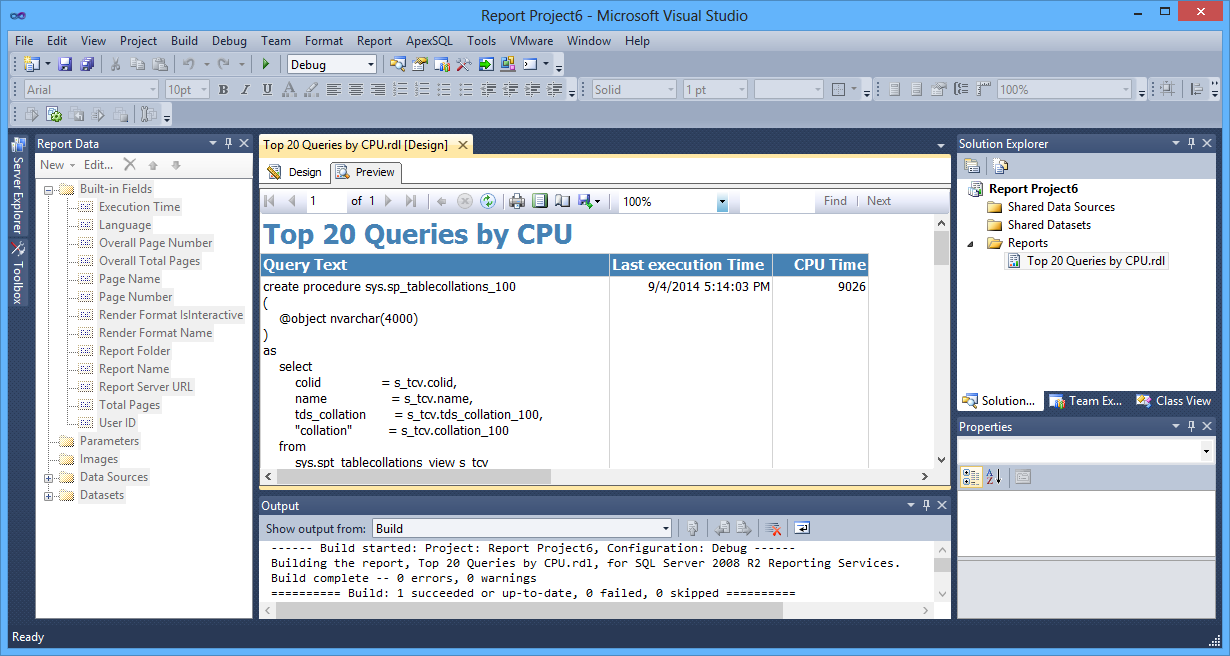
In this example, we’ll create a report that returns 20 most expensive queries executed after 5 PM. You can paste the following script directly into the Query Builder SQL pane.
123456789SELECT TOP 20QText.Text AS QueryText,QStat.Last_execution_Time,QStat.Total_Worker_Time AS CPU_TimeFROM SYS.Dm_Exec_Query_Stats QStatCROSS APPLY SYS.Dm_Exec_Sql_Text(QStat.SQL_Handle) AS QTextWHERE CAST(QStat.Last_execution_Time AS TIME) > '17:00:00';- To execute code and check whether it returns expected results, click Run in the Query Builder menu. You’ll receive a warning that the query cannot be presented graphically as the CROSS APPLY statement is not supported
- Click Continue. The results will be shown in the Result pane
- Click OK and then Next
- In the following three steps, define the report layout and design. The first one prompts you to select a report type: tabular or matrix. Although a matrix report is not adequate for all result sets returned by the query, the option is always enabled
- The next step prompts you to specify the fields that will be used to group the data in the table or matrix. In this example, we’ll leave all fields blank
- In the next step, select one of several predefined table styles. The difference is only in the colors and fonts used. You can skip this step and make font and color modifications later
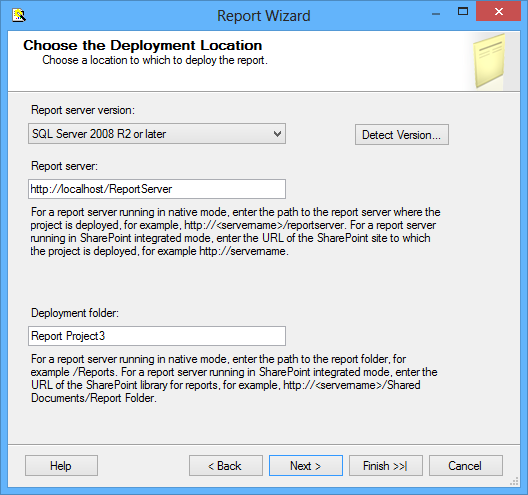
The Choose the Deployment Location step is related only to the report server in SQL Server Reporting Services (SSRS). You will be able to use the custom report through SQL Server Management Studio even if you don’t have SQL Server Reporting Services installed, configured, and running. In that case, you can just leave the values offered by default and click Next
- Specify the report name and click Finish
If you checked Preview report, the report will be shown in SQL Server Data Tools and you can tweak its layout in the Design tab if needed.
In this article, we presented SQL Server Management Studio custom reports, explained when they should be used, and gave a stop-by-step guide to create them using SQL Server Data Tools. In the next part of this article, we will give show how to run and modify custom reports.

She has been working with SQL Server since 2005 and has experience with SQL 2000 through SQL 2014.
Her favorite SQL Server topics are SQL Server disaster recovery, auditing, and performance monitoring.
View all posts by Milena "Millie" Petrovic
- Using custom reports to improve performance reporting in SQL Server 2014 – running and modifying the reports - September 12, 2014
- Using custom reports to improve performance reporting in SQL Server 2014 – the basics - September 8, 2014
- Performance Dashboard Reports in SQL Server 2014 - July 29, 2014