
Activity Monitor Activity Monitor is one of the features available in SQL Server Management Studio that quickly provides a set of most common performance metric values. What makes it more useful is that no previous setup is needed. Metrics are available at just a couple of clicks.
Keep in mind that the feature provides only basic information for a pre-defined set of SQL Server performance metrics, not useful for any deeper investigation and troubleshooting. No customization is possible. The metrics are shown in real-time graphs, they cannot be saved for later analysis, nor threshold values specified. But it can be useful to begin with performance monitoring and troubleshooting.
Data collection sets Starting with SQL Server 2008, data collection sets via Management Data Warehouse are available. Data collection provides three built-in collection sets; additional ones can be added through code. Unlike Activity Monitor, they are not available out of the box. Management Data Warehouse and collection sets have to be configured and started in advance.
Standard reports The largest set of SQL Server performance metric reports available in SQL Server Management Studio are Standard reports. It is a set of built-in reports that cover most common performance and monitoring requirements. The feature was introduced in SQL Server 2005. The available reports have changed over time, but the logic behind them is the same.
The same as with Activity Monitor, no previous configuration and customization is needed. These reports cannot be customized, no history saved, no alerting supported. However, the range of available reports is much larger than in Activity Monitor.
Standards reports are available at different database object levels. There are SQL Server instance level reports, login reports, management reports, SQL Server Agent, and more.
Some object types have disabled the Reports item in their content menu, which means that no reports are available for that object level. Besides these standard reports, there are custom ones. They are supported for most of database object types.
SQL Server instance standard reports SQL Server Management Studio provides a widest range of standard reports for the SQL Server instance level. There are more than 20 reports that show the most important SQL Server performance metrics, change history, memory usage, activity, top transactions, performance Service Broker statistics, and transaction log shipping status.
They can be used to quickly identify memory issues, most expensive queries, blocking transactions, and more.
Server dashboard Contains the information commonly analyzed when it comes to SQL Server performance monitoring. It shows the basic information about SQL Server instance configuration, settings, and activity in charts and tables: configuration details, non-default configuration options (in case you’ve modified the default instance settings), activity details, and graphs for processor usage and I/O performed.
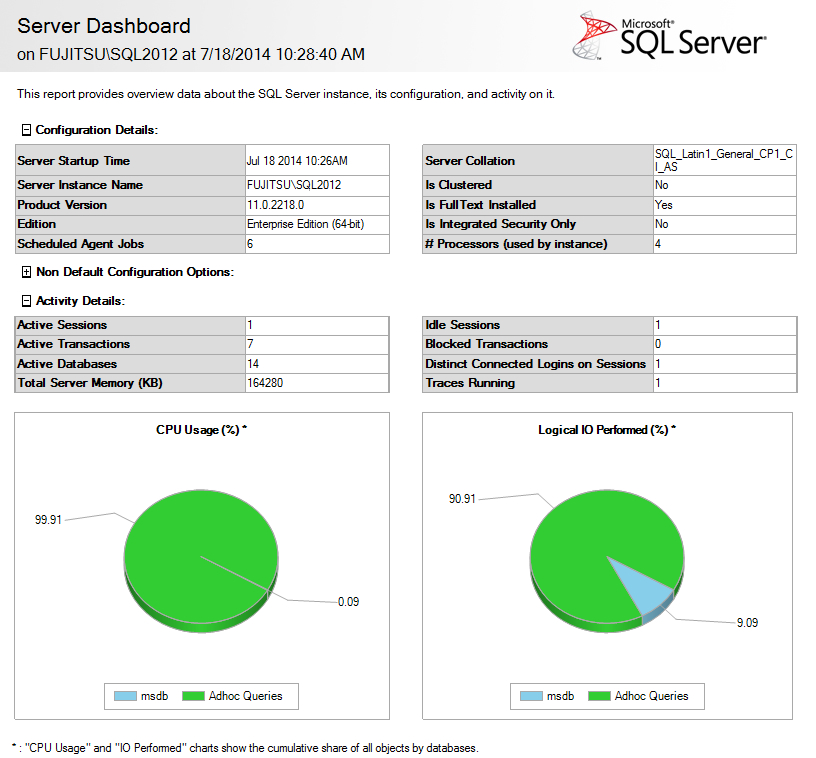
The same as other standard reports, this report contains expandable sections that provide additional detailed about specific metric or option.
Memory Consumption Memory Consumption is useful for troubleshooting memory issues and bottlenecks.
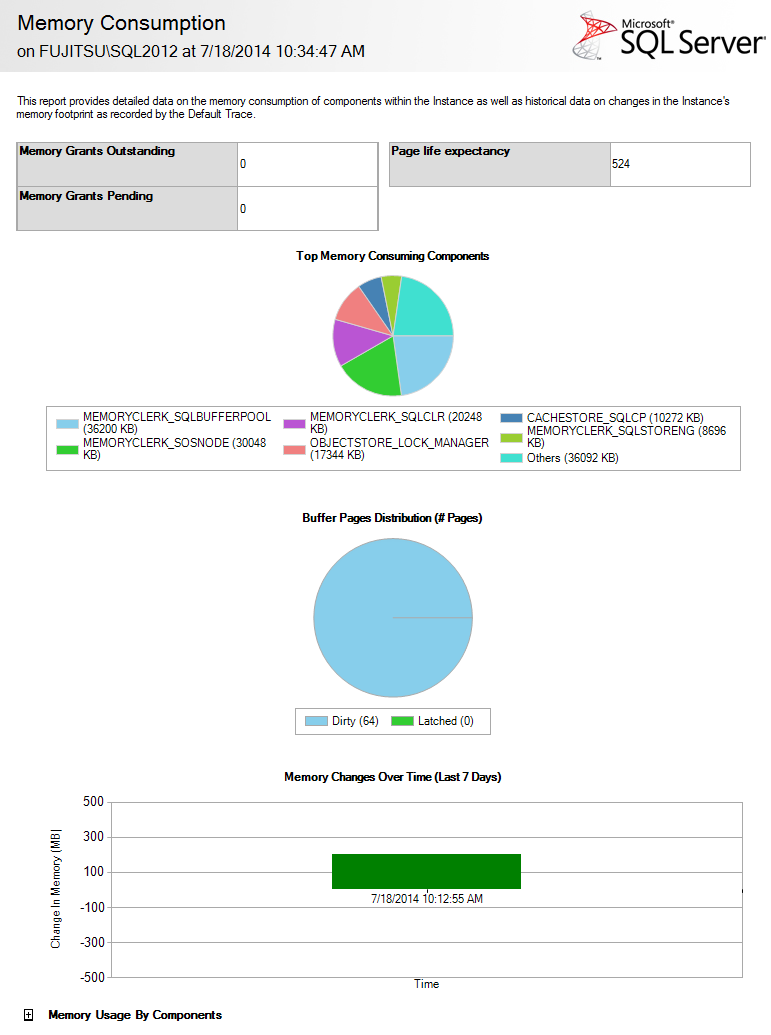
It shows the number of Memory grants outstanding, Memory grants pending, and Page life expectancy. These values can also be obtained by querying the sys.dm_os_performance_counters dynamic management view. Although these are not the most important memory metrics, they can be useful for basic analysis of the server memory usage. Additional memory performance metrics are not shown, nor can be added.
Memory grants outstanding shows the total number of processes that have been successfully granted a workspace in memory.
Memory grants pending shows the number of processes that are still waiting to be granted a workspace in memory.
Page life expectancy shows how many seconds a page stays in the buffer pool. If it’s not is the buffer pool, it has to be read from disk, so performance is affected. The preferred value is over 300, although this metric is not as useful as believed earlier.
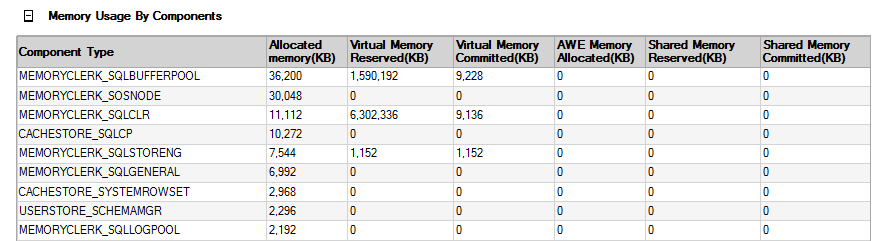
The Memory usage by components section, when expanded, shows a long list of SQL Server components and the allocated, virtual, and shared memory reserved and committed. This information can also be obtained by querying the sys. dm_os_memory_clerks dynamic management view. MEMORYCLERK_SQLBUFFERPOOL is usually the biggest memory consumer.
Here is just a fragment from the Memory usage by components list:
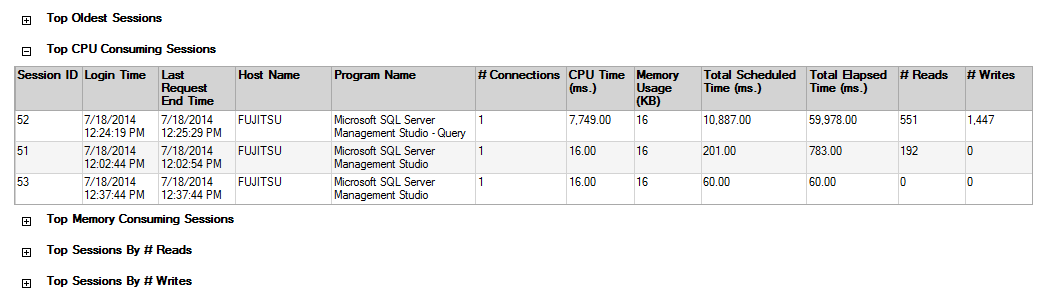
Activity There are seven available activity reports that show information about active sessions (both internal and external), connections, cursors, and transactions. The report shows top oldest, CPU consuming, and memory consuming sessions, as well as top sessions by number of reads, and by number of writes.
As the reports show host and program name, they enable you to nail down who uses most resources, from which computer and program.
Performance –Top Queries by Average CPU Time and Top Queries by Total CPU Time These report show ten most expensive queries when it comes to processor time usage. The information they show is the same, just grouped and presented differently. They show the exact query (system or user) executed, the database and object they are executed against, and the number of milliseconds the processor needed to process each of these queries.
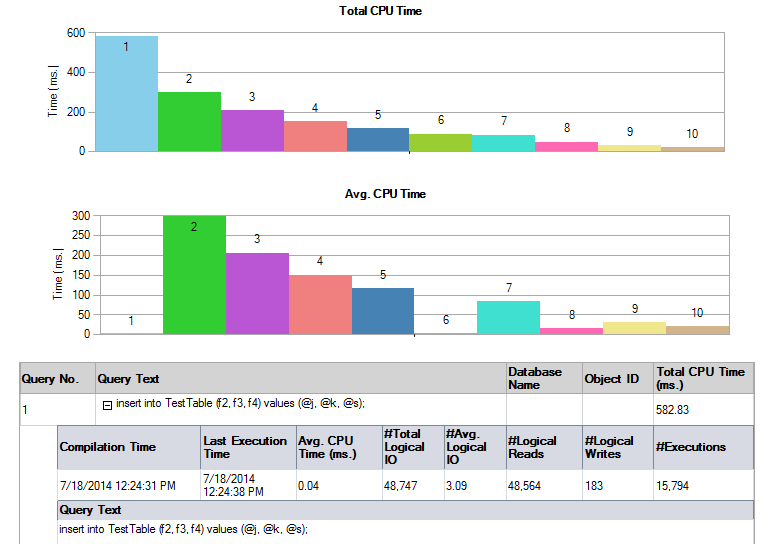
The Top Queries by Total CPU Time shows the same data and graphs as Top Queries by Average CPU Time, but in different order (Total CPU time is first).
The same goes for Performance –Top Queries by Average IO and Top Queries by Total IO Note that some of these reports use more hardware resources and need time to be created and displayed. Therefore, it is recommended to run them during off-peak hours.
Tasks Besides the instance-level reports shown above, we’ll present a management-level Tasks report.
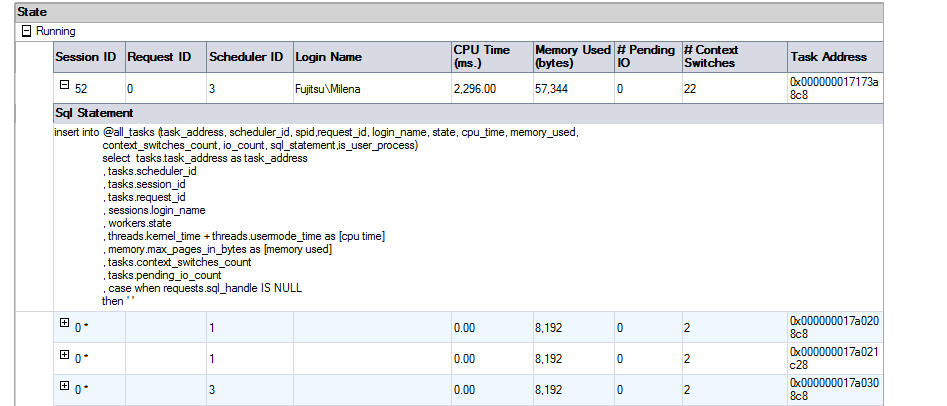
It shows the tasks that are currently executed on your SQL Server instance, so this information is also useful for performance and blocking troubleshooting. Besides the executed statement, the reports also shows processor time, memory used, pending IO. Blocked and blocking tasks are shown in a separate section.
How to use Standard reports
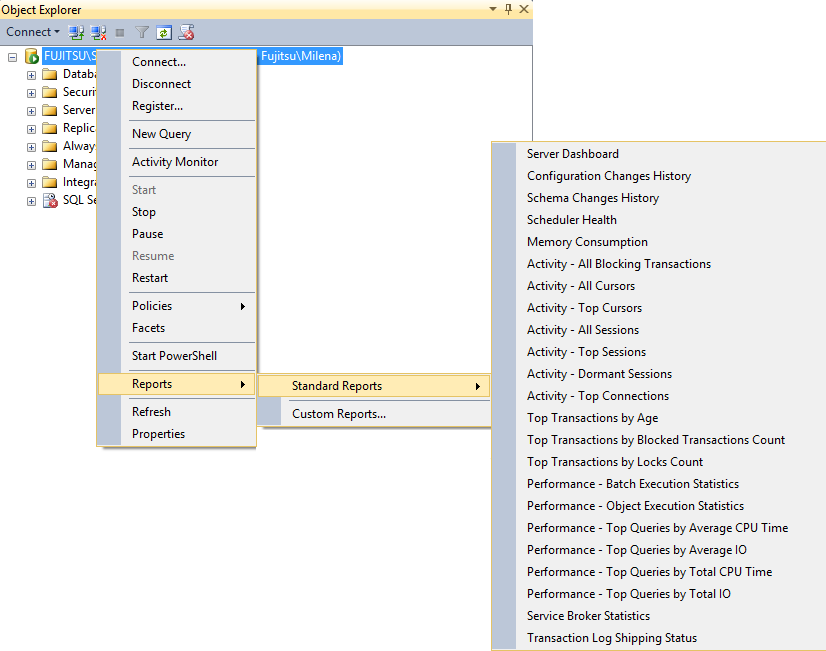
- In SQL Server Management Studio Object Explorer, right-click the SQL Server instance if you want the instance level reports, or the database object node for adequate standards reports
- In the context menu, select Reports | Standard reports
Select the report from the list

If you have already viewed some of the reports, the most recent ones will be listed below Custom Reports
- If you select Custom reports, you’ll be prompted to navigate to the folder where custom reports are saved. These are the .rdl and .rdlc files. If you haven’t created or used any custom reports on this SQL Server instance, the menu will be empty.
- Right-click the report and print it or save as an Excel or PDF file
If you’re looking for quick and basic details about SQL Server performance, SQL Server Management Studio standard reports can help. If you want to monitor your servers constantly, be able to select the performance metrics to monitor and configure their thresholds for alerting, keep history for later analysis, this is not the tool. A specialized SQL Server performance monitoring tool is highly recommended in these cases.

She has been working with SQL Server since 2005 and has experience with SQL 2000 through SQL 2014.
Her favorite SQL Server topics are SQL Server disaster recovery, auditing, and performance monitoring.
View all posts by Milena "Millie" Petrovic
- Using custom reports to improve performance reporting in SQL Server 2014 – running and modifying the reports - September 12, 2014
- Using custom reports to improve performance reporting in SQL Server 2014 – the basics - September 8, 2014
- Performance Dashboard Reports in SQL Server 2014 - July 29, 2014