
As these reports don’t provide enough information for SQL Server performance monitoring and troubleshooting, Microsoft has created a set of performance dashboard reports that provide more insight into what’s going on with your SQL Server.
Although there are still no Performance Dashboard Reports for SQL Server 2014, we used the reports for SQL Server 2012 and tested them on SQL Server 2014.
Getting started with Performance Dashboard Reports
SQL Server Performance Dashboard Reports are custom reports made to make performance monitoring easier. Keep in mind that these are ready to use reports and SQL Server Reporting Services don’t have to be installed on the SQL Server where you will use them.
Similar to standard reports, these reports help with identifying CPU usage, IO activity, blocks, bottlenecks, missing indexes, etc. As the values for the reports are mostly obtained from dynamic management views, such as sys.dm_os_performance_counters, sys. dm_os_memory_clerks, sys.dm_exec_requests, etc. no overhead is added to monitor the performance. To be able to query these views, the SQL Server login must have the VIEW SERVER STATE server permission.
Installation of Performance Dashboard Reports
- Download the installer here: Microsoft® SQL Server® 2012 Performance Dashboard Reports
- Start the installer and follow the steps and instructions. By default, the setup unpacks the files into C:\Program Files (x86)\Microsoft SQL Server\110\Tools\Performance Dashboard. Besides the reports (.rdl files), this folder also contains a chm help file, read me file that is actually a step by step guide on what to do next, and the setup.sql file that should be used in the next step
- To be able to use the reports, Performance Dashboard Reports functions and stored procedures have to be installed on every SQL Server instance you want to monitor. To do that, open the setup.sql file and execute it against the SQL Server instance using SQL Server Management Studio, or any other integrated developer environment. The script creates one table and multiple stored procedures, table valued, and scalar valued functions in the in msdb database. All created objects are in the MS_PerfDashboard schema.
- Repeat step 3 against all SQL Server instances you will monitor
How to use the reports
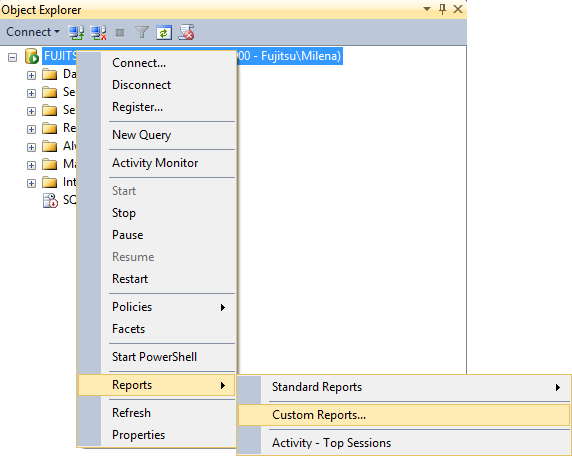
- In Object Explorer, right-click the SQL Server instance
Select Reports|Custom Reports

- The Open File dialog shows the folder where the Performance Dashboard Reports installer was unpacked. Only the report (*.rdl) files are shown
- Select the performance_dashboard_main.rdl file
If you get the Run Custom Report warning, click Run as the reports come from a trustworthy source and there’s no threat
The Performance Dashboard Reports are not listed, like the Standard reports are, but opened as files
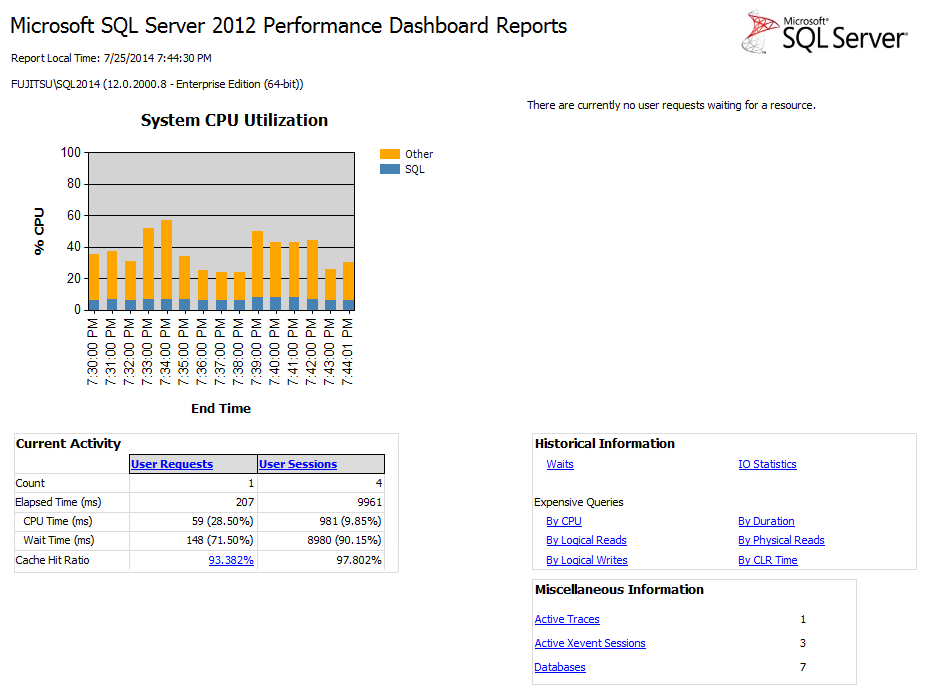
This is the main dashboard from which you can go to all other available reports by selecting the links in the report.
If you haven’t disabled the Run Custom Report warnings, each time you click a link in the report, you will get the path and the name of the Performance Dashboard Report that will be opened, so you can match reports in the dashboard to the .rdl files in the Performance Dashboard folder, as their names aren’t always identical. For example, the Cache hit ratio for the User requests opens the wait_buffer_io.rdl report.
The dashboard shows processor usage for the last 15 minutes, by both SQL Server and operating system, and basic information for current and historical activity.
A recommended value for the processor usage is up to 80%. Peaks when some heavy processing is performed are acceptable. Occasional peaks without a known reason should be investigated. If the processor usage is constantly over 80%, consider deeper query, index, database design analysis, adding more hardware resources, or distributing load on other servers.
To go back to the parent report, click the Navigate backward icon in the report menu (the first on the left), or press Ctrl and – on the keyboard.
User requests
The User requests or Current requests report shows the currently running user code. For each request, the complete script executed is shown, as well as the execution start time, status, wait statistics, processor time, logical and physical reads, granted query memory, etc.
User sessions
The User sessions report shows all user sessions (seeping and running) currently active on the SQL Server instance. There’s also an option to show system sessions. For each session, the following information is shown: the session ID, status, CPU time, memory usage, logical and physical reads, writes, login name, program name, host name, NT domain, NT user name, as well as last request start and end times.
Buffer IO Waits
The Buffer IO Waits report shows the ratio of pages read from buffer and total number of pages read. If the page is not read from buffer, it has to be read from disk, which degrades performance.
The recommended value is higher than 95%. However, this metric can be misleading, as high values are shown even when performance suffers. Therefore, it’s recommended to use some other memory metrics, such as Page Life Expectancy, Page reads/sec, and Free Pages
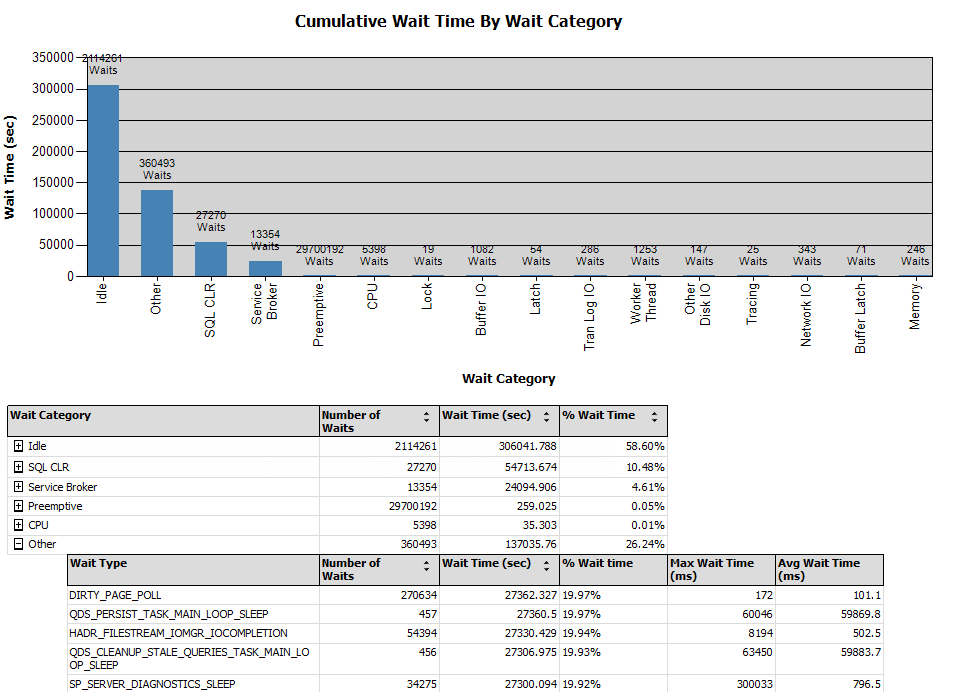
Waits
The Waits report shows the information about the SQL Server processes waiting to be processed. The information is obtained from the sys.dm_os_wait_stats dynamic management view.
SQL Server supports more than 200 wait types, but the report shows similar waits grouped into the same category with user-friendly category names. For example, all waits where the wait_type column has the value like LCK_M (LCK_M_SCH_S, LCK_M_SCH_M, LCK_M_S, etc.) are summed and shown as Lock waits in the report, all waits with the wait type like LATCH (LATCH_NL, LATCH_KP, LATCH_SH, etc. ) are shown as Latch, etc.
You can find the conditions used for wait grouping in the MS_PerfDashboard.fn_WaitTypeCategory function.
IO statistics
The IO statistics report shows the reads and writes (percentage, number, and wait time) for each database. Note that the values shown are cumulative since the last SQL Server start.
The report also shows 20 tables with the highest IO activity and indicates whether there is a missing index on the table, as that can be a cause for IO high values.
Expensive queries
A set of expensive query reports shows the information about 20 queries that use the most resources, grouped by different categories: processor time, duration, logical reads, physical reads, logical writes, and CLR time. The same rdl report, query_stats is used for all reports.
The information in this report is obtained from sys.dm_exec_query_stats. Note that the view doesn’t contain the information about statements other than DML statements (INSERT, UPDATE, DELETE, and SELECT), therefore, some other resource intensive operations, such as creating a full database backup, are not shown in the report, making it potentially misleading.
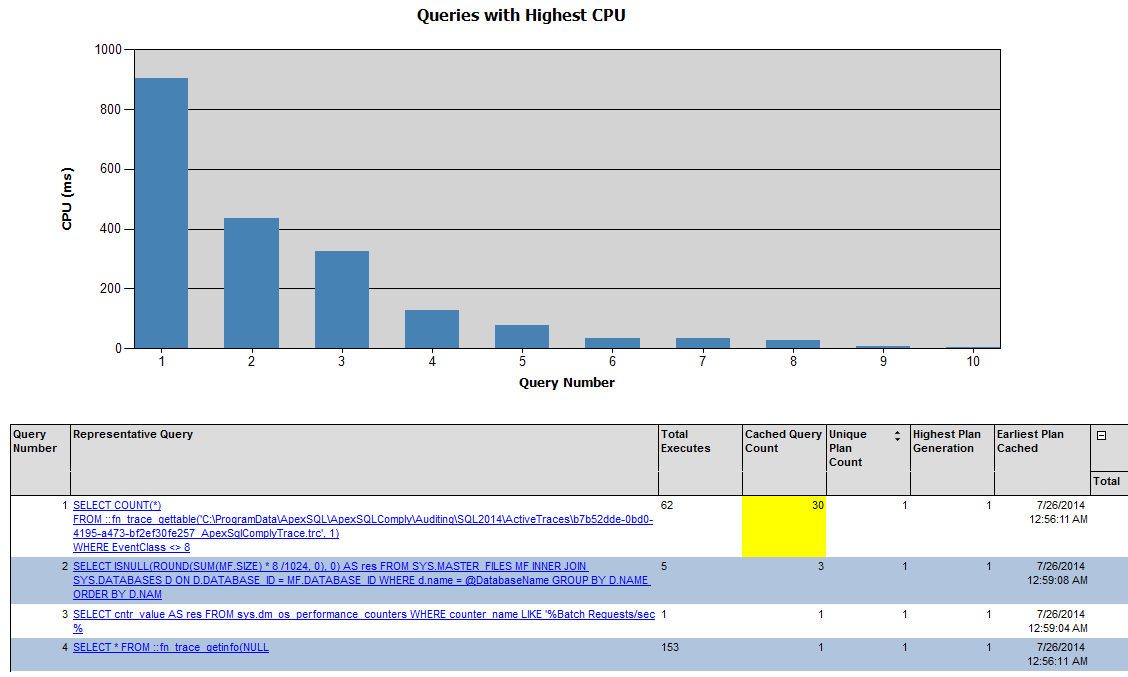
To drill down into the query, click the link in the Representative Query column, and a new report showing the query plan is opened. This report provides two new reports where applicable: the plan guide and missing indexes.
Miscellaneous information
This section contains three reports: Active traces, Active Xevent sessions, and Databases.
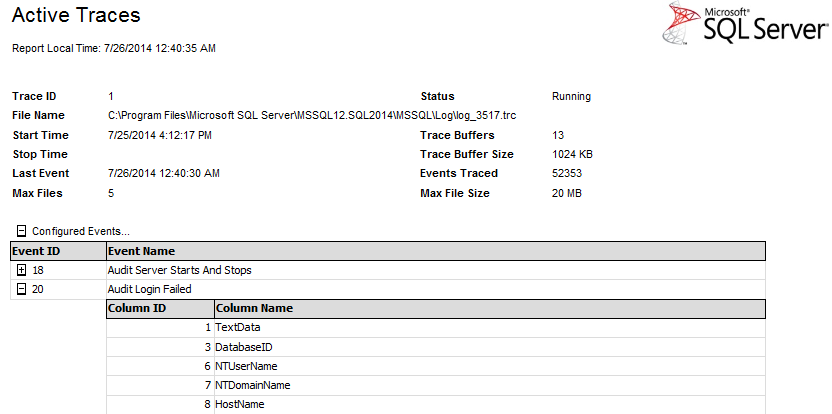
The Active traces report shows results only when at least one SQL trace is running. Otherwise, the link in the main dashboard will be disabled and the traces.rdl file will show no results. The report shows the trace start time, status, .trc file path and name, buffer size, number of buffers, as well as captured event names.
The Active Xevent sessions report is similar to the Active traces report, just shows the information for the running extended event sessions. Both Active traces and Active Xevent sessions use the same rdl report, traces.rdl.
The Databases report shows basic information about all databases hosted on the SQL Server instance: the name, compatibility level, recovery model, size, etc.
To uninstall Performance Dashboard Reports, use Windows Control Panel, Uninstall a program.
SQL Server Performance Dashboard Reports show some of the commonly monitored performance metrics. Although there is no new release for SQL Server 2014, Microsoft SQL Server 2012 Performance Dashboard Reports can be used on SQL Server 2014 without any issues. They provide deeper and more useful information about SQL Server performance than SQL Server Management Studio standard reports, but still not sufficient for any deeper performance troubleshooting.

She has been working with SQL Server since 2005 and has experience with SQL 2000 through SQL 2014.
Her favorite SQL Server topics are SQL Server disaster recovery, auditing, and performance monitoring.
View all posts by Milena "Millie" Petrovic
- Using custom reports to improve performance reporting in SQL Server 2014 – running and modifying the reports - September 12, 2014
- Using custom reports to improve performance reporting in SQL Server 2014 – the basics - September 8, 2014
- Performance Dashboard Reports in SQL Server 2014 - July 29, 2014