
One of the most common wait type seen on SQL Server and definitely one that causes a lot of troubles to less experienced database administrators is the PAGEIOLATCH_SH wait type. This is one of those wait types that clearly indicates one thing, but which background and potential causes are much subtler and may lead to erroneous conclusions and worse, incorrect solutions
The Microsoft definition of this wait type is:
Occurs when a task is waiting on a latch for a buffer that is in an I/O request. The latch request is in Shared mode. Long waits may indicate problems with the disk subsystem.
To make this simple to understand, lets explain this in an example. When the data pages are requested from the buffer cache by one or multiple sessions, but those data pages are not available in the buffer cache, SQL Server will have to allocate a buffer page for each one in the buffer and it will create the PAGEIOLATCH_SH on the buffer. At the same time, while the page is moved from the physical disk to a buffer cache (a physical I/O operation) SQL Server will create PAGEIOLATCH_EX wait type. Once the page is moved to a buffer cache, since the issued PAGEIOLATCH_SH is still active and the pages can be read from the buffer cache
Page latches are actually light locks that are not configurable, placed by SQL Server internal processes as a way of managing access to the memory buffer. Pahe latches are placed every time that SQL Server has to physically read data from the memory buffer to a hard drive or from hard drive to the memory buffer and the thread must wait until this completes causing the PAGEIOLATCH_XX waits. The moment the requested data pages became available after the I/O reading completes, the thread will get requested data and will continue with execution. So obviously, it is normal to encounter some PAGEIOLATCH_SH waits

So it is clear that the PAGE IOLATCH_SH is directly related to the I/O subsystem, but does this actually mean that in case of excessive PAGE IOLATCH _SH, the I/O subsystem is always the primary/only root cause of the trouble?
In short, the answer is no. The high PAGEIOLATCH_SH, even though it indicates the pressure is on the I/O subsystem, doesn’t necessary mean that I/O subsystem is a bottleneck per se, but it could also mean that I/O subsystem cannot cope with the excessive I/O imposed to it.
To understand this better, let’s dive deeper into the causes of high PAGEIOLATCH_SH which will allow better understanding of this wait type, but will also allow better handling of situations when PAGEIOLATCH_SH is prevalent wait type in SQL Server
I/O subsystem has a problem or is misconfigured
Logical/physical drive misconception
Network issues/network latency
Overloaded I/O subsystem by another processes that are producing the high I/O activity
Memory pressure
Synchronous Mirroring and AlwaysOn AG
Bad index management
I/O subsystem has a problem or is misconfigured
The PAGEIOLATCH_SH could indicate a problem with the I/O subsystem, i.e. problem with the disk. It is often possible that faulty disk does not trigger the monitoring system and in fact the disc issues could be very tricky, as disk could experience various issues which are not black and white (work/doesn’t work). Also the drives that are part of the RAID system could be even more trickier to detect considering the RAID own ability to deal with errors. In such cases, checking the S.M.A.R.T. (Self-Monitoring, Analysis and Reporting Technology) log should be the first step. In situations when the SMART log indicates a possible error or even an imminent drive failure, this could be the actual root cause of the excessive PAGEIOLATCH_SH.
For those with RAID controllers, testing the RAID hardware/software for malfunctions or errors is also recommended.
Another issue, very often overlooked is heavily fragmented disk. It’s not rare that defragmenting the disk subsystem resolve the I/O issue
Logical/physical drive misconception
A misconception in using the physical and logical drive is often the cause of a slow and problematic I/O subsystem. Quite often users are distributing a different part of the systems (OS, swap file, SQL Server data files, backups etc.) to a different disk partitions (C:, D:, E:, F: etc.) in order to load balance the I/O subsystem which is completely fine and recommended. But there is often misconceptions between load balancing using physical and logical disk drives. The following use case will help in understanding the problem and a provide potential solution
RAID arrays with multiple discs are quite common in larger organizations. In the following example, the RAID 5 array with 4 hard drives will be taken as an example. The RAID array is further divided into 3 partitions C:, D: and E:
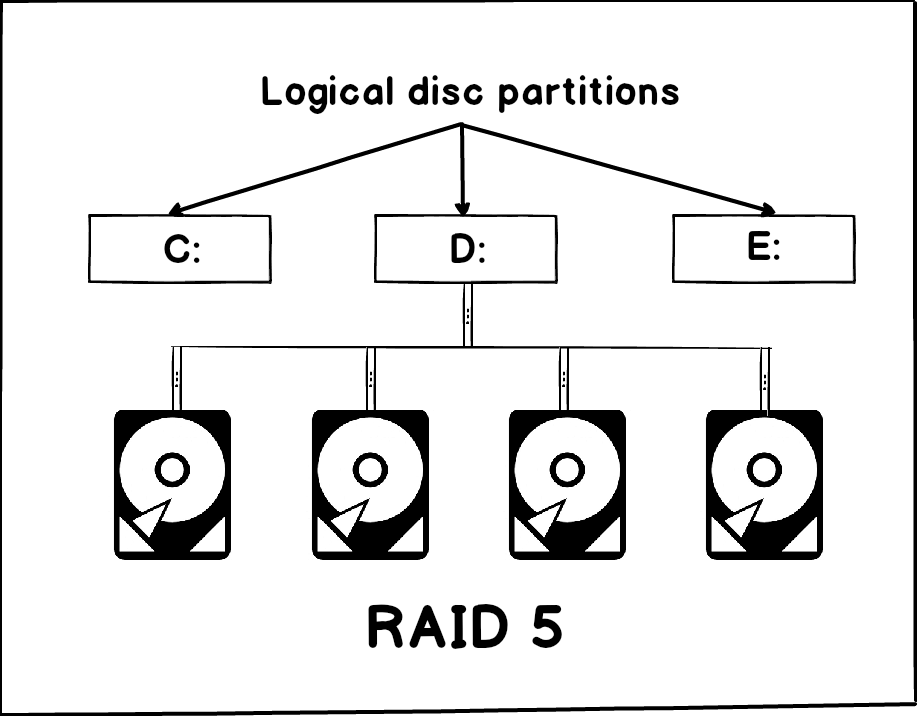
What must be clear here is that those partitions are actually logical, not physical partitions, as they share the same raid array and thus the same four physical disks – logically split RAID 5 array into 3 partitions. The RAID array for an operating system represent the single disk drive and it is not possible for OS to distribute specific data to a specific physical drive. In such scenario, OS, the page/swap file, SQL Server data files and tempDB are share same physical RAID array, namely the same physical drives. In such configurations, the different parts of the software systems are putting the pressure on each other, but also the different parts of the same software can conflict with each other (I.e. different SQL Server processes might be heavily dependent on I/O and thus conflicting to each other. In such a scenario, it is very possible to encounter excessive PAGEIOLATCH_SH as different SQL Server processes as well as different applications and OS processes could severely affect the performance of the I/O subsystem causing the slow transfer of data pages from disk to a buffer pool.
The principles of the RAID system itself will not be explained here any deeper, as it is not of particular interest for understanding the main problem
So instead of having partitions distributed across the same drives, it is actually important having the physical hard drives that will be used for distributing the different parts of the software to ensure the proper load balance of the I/O subsystem
The recommended scenario would be to have enough physical hard drives/RAIDs for distribution of critical parts of the software. The most widely used and recommended scenario would be the following
Set the Operating system on a dedicated RAID 1 array as minimum (one physical drive is also acceptable but risky solution)
Set the swap file to a dedicated hard drive. No RAID is required here
Set TempDB on a dedicated RAID 1 array as minimum. Again, one physical drive is acceptable, but it can pose the risk. TempDB will be recreated on every SQL Server restart, and if there are some SQL Server uptime requirements that consider rarely restarting SQL Server that RAID 1 option should be the first choice
Use the RAID 5 partition for the SQL Server data files. Storing the backups on the same RAID array is OK
Set the transaction log files on a dedicated RAID 1 array. RAID1 is the recommended for storing the transaction log files
Using this configuration should ensure the minimal I/O pressure and thus the normal values for PAGEIOLATCH_SH but for other PAGEIOLATCH_XX wait types as well
Network issues
For SQL Servers that are based on SAN (Storage Area Network) or NAS (Network Attached Storage) storage systems which are network dependent, every network latency or network slowness might/will cause excessive PAGEIOLATCH_SH (but also the other PAGEIOLATCH_XX waits) wait type values due to inability of the SQL Server to retrieve data from physical storage to a buffer pool fast enough
If the PAGEIOLATCH_SH wait type values are consistently larger than 10-15 seconds, this could be a reliable indicator of pressure on I/O subsystem and three above mentioned causes should be carefully investigated
Overloaded I/O subsystem by another processes that are producing the high I/O activity
In this particular scenario the high I/O activity caused by other processes or subsystems will cause a slightly different representation of the PAGEIOLATCH_SH wait type, and under such scenario, a high number of short PAGEIOLATCH_SH wait types will be displayed. Generally, a high number of brief PAGEIOLATCH_SH wait types is a typical scenario where increased pressure on I/O by another processes should be investigated and resolved
Memory pressure
In an ideal scenario the memory buffer should be big enough to store all the necessary data for work that SQL Server has to perform. In such an ideal scenario, since all the necessary data is stored in the buffer pool, there will be no requirements for physical data read, and the only changes that will be performed would be the buffer pool data updates. Real world scenarios are rarely ideal, so physical I/O readings from storage to a buffer pool and vice versa are inevitable. The fact that SQL Server is performing the physical I/O readings from the storage is not the something that should be of concern as long as SQL Server performance is not affected. This is why it is important for a DBA to create a baseline of the system and as long as the physical I/O reads are within the created baseline no intervention should be required.
What has to be tracked and alerted for is when there is a sudden breach of the high threshold of an established baseline, especially if this occurs without visible reason and it lasts for prolonged period of time. This is almost a certain indicator that SQL Server is suffering from the memory pressure, which could be caused by a different reason including:
OS processes are utilizing the larger amount of memory than usually forcing the SQL Server memory manager to reduce the size of the memory buffer. Reduced memory buffer is causing increased amount of lazy writes and read activity
A poor performing query that is causing dynamic memory default action to pose internal pressure to a physical memory as a consequence of memory settings change. The same internal pressure on physical memory might be caused due to redistribution of the reserved and stolen pages from the memory buffer
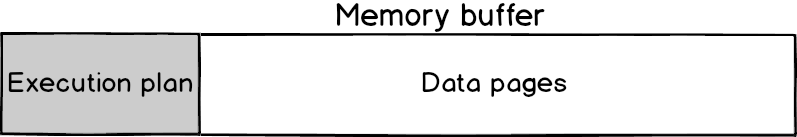
Bloated query plan will cause buffer space reduction for the data cache. This is often the cause of the memory pressure so it will be explained with more details here. Query execution plans are stored in the same memory buffer as buffered data. In this way the SQL Server can reuse the execution plan without need for expensive compiling of the query every time it executes, thus relieving the pressure on CPU

For an execution plan to be reused for a specific query, the T-SQL statement of that query must be identical up to the last character as the one that is stored with the query plan, which is not the case with ad-hock queries.* Parametrized queries, unlike ad-hoc queries, use a parameter instead of the specific value, and thus they do not change when executing with different data values, which means that the stored query plan can be used for each execution. For SQL Servers where a large number of ad-hock queries are executed, there will be increased requirements for memory in order to store the additional query plans, as T-SQL, for these ad-hock queries will be different. The more ad-hock queries that are executed, the more memory for storing the execution plans will be required and thus more buffer memory used. Since query plans for ad-hock queries are used only once, their respective execution plans will be useless and the memory used by those plans will be wasted. But the waste of memory itself is not posing the issue, instead it is the fact that buffer memory allocated to the useless execution plans will be at the expense of the memory used for data pages, which is often referred as the “memory stealing”
Reduced size of the memory for storing the data pages will force SQL Server to perform physical I/O reading from the disk more frequently, thus causing the direct impact on SQL Server performance and excessive PAGEIOLATCH_SH

When the memory is the cause of the excessive PAGEIOLATCH_SH, whether the to perform performance optimization and tuning of SQL Server or just to add/increase physical memory should be carefully considered. Troubleshooting and performance optimization in such cases can be time consuming and not always efficient in producing desired results. It is not unusual that after spending lots of time in tuning the SQL Server to avoid memory pressure, a DBA to ends up with no solution but to add more physical memory to a system. With the current price of memory, just increasing physical memory size could be not only instant/faster but also a cheaper (compering to the DBA labor) and thus more optimal solution in most cases
Synchronous Mirroring and AlwaysOn AG
In situations when high safety mode is used in database mirroring, or when the synchronous-commit availability mode (synchronous-commit mode) is set for AlwaysOn AG, high availability is emphasized over performance. In this case, high availability is achieved at a cost of increased transaction latency which means that a transaction on the principal server or the primary replica cannot be committed until it receives a message that the mirror or secondary replica that the secondary database enters the SYNCHRONIZED state. In situations when the mirroring operation is delayed for any reason (network, high O/O etc.) it require increased time for physical I/O data reading and thus the PAGEIOLATCH_SH times as the thread will have to wait for the data until the synchronized signal is sent. While this often appears similar to query blocking, the actual root cause of this lies in problems with synchronization
Poor index management
Poor index management is another cause of high incidents PAGEIOLATCH_SH wait types due to forcing the index scan (table scan) instead of index seek. Generally speaking, index seek is always preferred and having index scan in execution plans is something that should be investigated. Having index scan means that no indexes that are relevant to particular query that is executing were found, so SQL Server will have to perform a full table scan, meaning that it will have to read every single row, from first to the last one, in the table. This will cause, in most cases, all pages related to the table have to be read from the disk, meaning that physical I/O reading will be performed – a direct consequence of this will be increased incidents of PAGEIOLATCH_SH wait types. The reason for this could be often that indexes doesn’t exists or that there is a missing or missing/altered nonclustered index that is required by a query.
Excessive CXPACKET wait types present alongside with excessive PAGEIOLACH_SG wait types is often an indicator that index scan is the actual cause of excessive PAGEIOLATCH_SH
A parameter sniffing might also cause the unwanted and unneeded index scan instead of index seek, in situations when the query results could be significantly different for different parameters. During the initial execution and depending on the results retrieved by the query (for example if the retrieved number of rows consist make up a high percent of the total number of rows), SQL Server might decide that it is better to use the index scan instead of the index seek. This means that for every execution of the query, even when the small number of rows is returned the SQL Server will use the same execution plan and it will use index scan, instead of the lighter and faster index seek. Results of this will be increased PAGEIOLATCH_SH wait types due to increased physical I/O reading of the data pages from the disk
So to sum up this article:
Even, although fundamentally related to the I/O, excessive PAGEIOLATCH_SH wait types don’t mean necessarily that the I/O subsystem is the root cause. It is often one of the other reasons described in this article
Check the SQL Server, queries and indexes as very often this could be found as a root cause of the excessive PAGEIOLATCH_SH wait types
Check for memory pressure before jumping into any I/O subsystem troubleshooting
Keep in mind that in case of high safety Mirroring or synchronous-commit availability in AlwaysOn AG, increased/excessive PAGEIOLATCH_SH can be expected
* An example of what was explained in the sentence:
As it can be seen in this ad hock query the specific value is used, and the value will be changed when different condition have to be used
SELECT * FROM dbo.Table1 WHERE CustomerId = 670
Here the parameter is used that will be replaced with original value at the time of execution
SELECT * FROM dbo.Table1 WHERE CustomerId = @p
So in case number 1, the SQL Server will have to store the execution plan for every query as if different values are used like this:
SELECT * FROM dbo.Table1 WHERE CustomerId = 670 SELECT * FROM dbo.Table1 WHERE CustomerId = 29
When SQL Server compares these T-SQL statements it will identify them as different, as they actually are, so every time we use the new value for CustomerId, it will create a new execution plan and will store it in the buffer
In case of parametrized query:
SELECT * FROM dbo.Table1 WHERE CustomerId = @p
Every time it is executed the query text will be identical, so there is no need for the new execution plan as the T-SQL will not change for different values of CustomerId

Military aviation devotee and hard core scale aircraft modeler. Extreme sports fan; parachutist and bungee jump instructor. Once serious, now just a free time photographer
View all posts by Nikola Dimitrijevic
- SQL Server trace flags guide; from -1 to 840 - March 4, 2019
- How to handle the SQL Server WRITELOG wait type - June 13, 2018
- SQL Server performance counters (Batch Requests/sec or Transactions/sec): what to monitor and why - June 5, 2018