
The user’s read requests in SQL Server are managed and controlled by the SQL Server Relational Engine, that is responsible for determining the most optimized access method, such as index scan or table scan, to retrieve the requested data. These read requests are also optimized internally by the SQL Server Storage Engine, the buffer manager components specifically, that is responsible for determining the general read pattern to be performed.
When you submit a query to request data in SQL Server, the SQL Server Database Engine will request that data pages that are required for your query from the buffer cache, performing a logical read. If these pages are not found in the buffer cache, a physical read will be performed to copy the pages from the disk into the buffer cache.
Although the SQL Server query optimizer tries to do its best in providing the most optimal execution plan that helps to retrieve the data requested by the user, you may still face CPU or I/O performance issues while executing the query. SQL Server provides us with many features that help in optimizing the data retrieval performance in order to respond to the user’s requests as fast as possible. One of these useful features is the read-ahead mechanism. As the name indicates, using the read-ahead mechanism, the SQL Server Storage Engine brings the data and index pages into the buffer cache, up to 64 contiguous pages per each file, before they are actually requested by the SQL Server Relational Engine, to respond for the user’s query. This provides more possibilities to find the data page in the buffer cache when it is requested and optimizes I/O performance by performing more logical reads, which is faster than physical reads. It allows also for computation overlap that helps in reducing the CPU time required to execute the queries.
SQL Server provides us with two types of read-ahead mechanisms: sequential read-ahead and random prefetching read-ahead mechanisms. In the sequential read-ahead mechanism, the pages will be read in allocation order or index order depending on what is being processed. For tables that are not sorted, in any order, due to having no clustered index, also called heap tables, the data will be read in the allocation order. In such cases, the SQL Server Storage Engine builds its own sorted list of addresses to be read from the disk by reading the Index Allocation Map pages, that contains a list of extents that are used by each table or index. The sorted addresses list allows the SQL Server Storage Engine to perform optimal sequential reads for the data in the disk, based on the extent addresses stored in the IAM. On the other hand, index pages will be read sequentially in key order. In this case, the SQL Server Storage Engine will scan the intermediate nodes of B tree structure of the index to prepare a list of all keys to be read from the leaf level nodes, recalling that the keys are stored in the leaf level nodes of the index.
A random prefetching read-ahead mechanism is used to speed up the fetching of data from non-clustered indexes, where the leaf level nodes contain only pointers to the data rows in the table or the clustered index. In this case, the SQL Server Storage Engine will read the data rows, asynchronously, that it already retrieves its pointers from the non-clustered index. In this way, the underlying table’s data rows will be fetched using the SQL Server Storage Engine before completing the non-clustered index scan. The number of pages to be read ahead is not configurable and depends on the edition of the SQL Server, with the Enterprise edition having the most number of allowed pages.
To understand how the read-ahead will affect the performance in practical terms, let’s go through the following example. We will create a simple testing table, using the CREATE TABLE T-SQL statement below:
|
1 2 3 4 5 6 7 8 |
USE SQLShackDemo GO CREATE TABLE ReadAheadDemo ( ID INT IDENTITY (1,1) PRIMARY KEY, CustName VARCHAR(50), CustAddress NVARCHAR(MAX) ) |
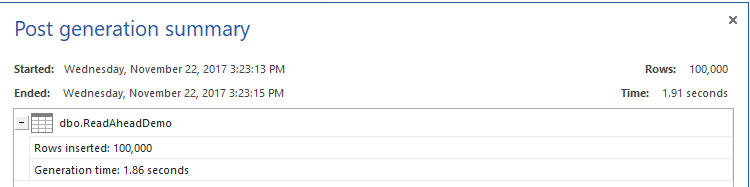
Once created, we will fill that table with 100K records, using ApexSQL Generate, a SQL test data generator tool:
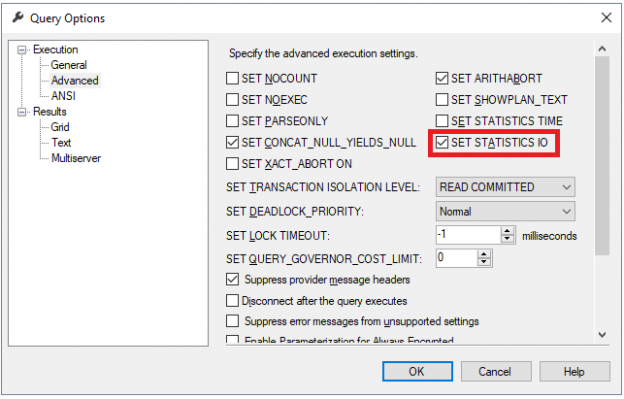
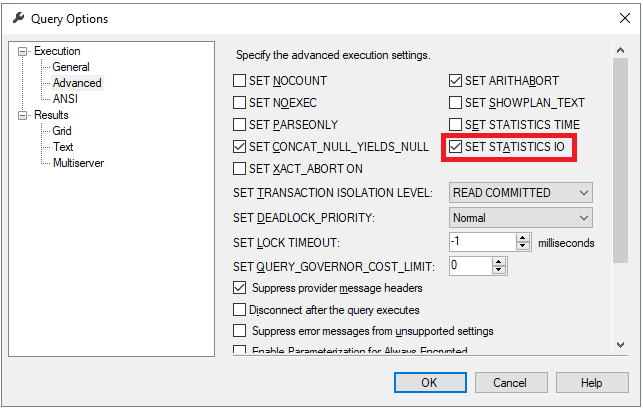
The table is ready now to start our testing scenario. To track the read-ahead, we will enable the IO statistics in the session that we will execute the query within, using the SET STATISTICS IO ON command, or by ticking the SET STATISTICS IO checkbox from the Query Options Advanced tab as shown below:
We will also use the DBCC DROPCLEANBUFFERS command to flush all data pages in the buffer cache before running our SELECT query so that the buffer cache will be empty and the read-ahead reads can take place. This is used for testing purposes and not recommended to be used in a production environment. After enabling IO statistics, TIME statistics, the actual execution plan and cleaning the buffer cache, we will run the SELECT statement below to retrieve data from the previously created table, using the T-SQL query below:
|
1 2 3 4 5 6 7 8 9 |
DBCC DROPCLEANBUFFERS SET STATISTICS IO ON SET STATISTICS TIME ON SELECT [ID] ,[CustName] ,[CustAddress] FROM [SQLShackDemo].[dbo].[ReadAheadDemo] WHERE ID >157 |
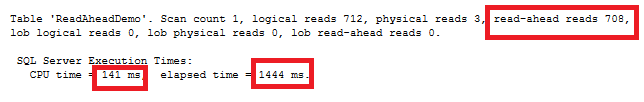
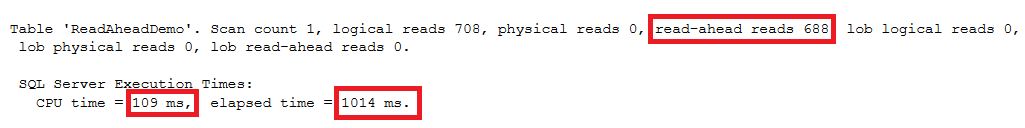
We are not interested here in the retrieved data as we will check the IO and TIME statistics for performance comparison purposes only. From the messages tab of the query result, we will see that the number of read-ahead reads performed while retrieving data for this query is 708 pages. This means that 708 pages were brought into the buffer pool while executing that query. The query took 1444ms to be executed and consumed 141ms from the CPU time as shown in the statistics below:
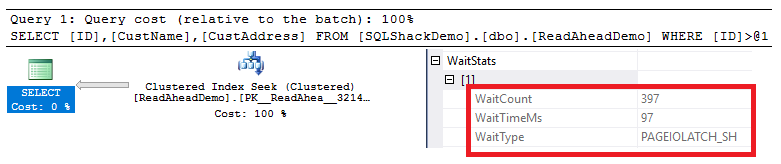
From the execution plan generated after executing the previous query, right-click on the SELECT node properties, you will see that the PAGEIOLATCH_SH wait type occurred 4 times and stayed for 3ms, as shown in the snapshot below:
If we execute the previous SELECT query again, enable IO and TIME statistics for that query and enable the actual execution plan, but this time we will not clear the buffer cache content as shown in the T-SQL query below:
|
1 2 3 4 5 6 7 8 |
SET STATISTICS IO ON SET STATISTICS TIME ON SELECT [ID] ,[CustName] ,[CustAddress] FROM [SQLShackDemo].[dbo].[ReadAheadDemo] WHERE ID >157 |
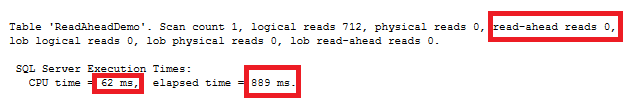
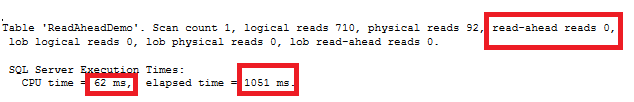
You will derive from the TIME and IO statistics, shown in the Messages tab, that there is no need to perform read-ahead reads this time, as the requested pages are already in the buffer cache. The same result can be derived also from the TIME statistics, showing that it took the query only 889 ms to be executed completely, which is 60% of the time consumed in the previous query, and consumes 62 ms from the CPU time, which is 44% of the previous query CPU consumption. All of that due to the same reason; the data already exists in the buffer cache as a result of previous read-ahead reading operations. The IO and TIME statistics in our situation will be as follows:
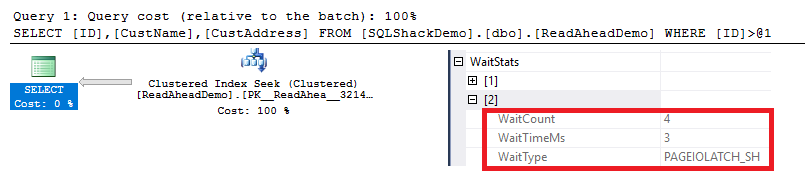
Checking the SELECT node properties in the execution plan generated by the executing the previous query, you will see that, when the read-ahead reads are not performed, the PAGEIOLATCH_SH wait type occurred 397 times and stayed for 97ms, as shown in the snapshot below:
If we try to run the same previous query, providing a different value in the WHERE clause, and enabling both TIME and IO statistics for performance comparison purposes, as in the SELECT statement below:
|
1 2 3 4 5 6 7 8 |
SET STATISTICS IO ON SET STATISTICS TIME ON SELECT [ID] ,[CustName] ,[CustAddress] FROM [SQLShackDemo].[dbo].[ReadAheadDemo] WHERE ID >774 |
You will see that the query will ask for new pages that are not available in the buffer cache. Because of this, read-ahead reads will be performed, to retrieve extra pages in addition to the requested pages and copy it to the buffer cache using complex algorithms to predicate the pages that the user may request in the coming queries, as shown in the Messages tab snapshot below:
The read-ahead mechanism is enabled by default. Which means that, whenever a read-ahead read is required, it will take place. There is a Trace Flag 652 that can be used to disable the default read-ahead mechanism. Recall the first SELECT query in our demo in which we clear the buffer cache before executing the query, that forced the read-ahead to take place. If we turn on the Trace Flag 652 before executing the same query, as shown in the T-SQL script below:
|
1 2 3 4 5 6 7 8 9 10 |
DBCC TRACEON(652) DBCC DROPCLEANBUFFERS SET STATISTICS IO ON SET STATISTICS TIME ON SELECT [ID] ,[CustName] ,[CustAddress] FROM [SQLShackDemo].[dbo].[ReadAheadDemo] WHERE ID >157 |
Checking the IO statistics of the previous query, you will find that, no read-ahead read is performed in the query that has 708 read-ahead reads previously, due to turning on the TF 652 before executing it, that disabled the read-ahead mechanism, as shown in the statistics below:
I hope this all made sense. If anything was unclear, please feel free to comment below!

He is a Microsoft Certified Solution Expert in Data Management and Analytics, Microsoft Certified Solution Associate in SQL Database Administration and Development, Azure Developer Associate and Microsoft Certified Trainer.
Also, he is contributing with his SQL tips in many blogs.
View all posts by Ahmad Yaseen
- Azure Data Factory Interview Questions and Answers - February 11, 2021
- How to monitor Azure Data Factory - January 15, 2021
- Using Source Control in Azure Data Factory - January 12, 2021