
What is SQL Server Activity Monitor?
SQL Server Activity Monitor is a feature in SQL Server Management Studio that displays information about the SQL Server processes and their effect on SQL Server performance
Activity Monitor panes
Activity Monitor consists of several panes – Overview, Processes, Resource Waits, Data File I/O, and Recent Expensive Queries. Panes can be expanded and collapsed. The activities are queried only when the specific pane is expanded
“Activity Monitor runs queries on the monitored instance to obtain information for the Activity Monitor display panes. When the refresh interval is set to less than 10 seconds, the time that is used to run these queries can affect server performance” [1]
The Overview pane
The Overview pane contains the graphs for the most important SQL Server instance information. The context menu contains the Refresh interval option that can be set to a predefined value from 1 second to 1 hour
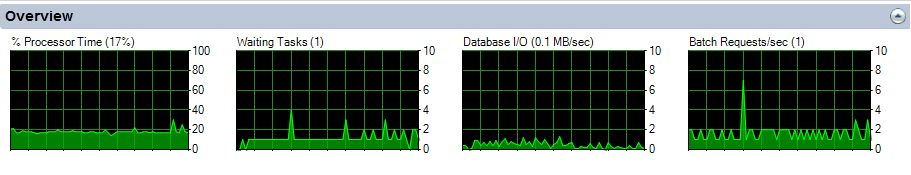
% Processor Time – is the percentage of time the processors spend to execute threads that are not idle
Waiting Tasks – is the number of tasks that are waiting for processor, I/O, or memory to be released so the tasks can be processed
Database I/O – is the data transfer rate in MB/s from memory to disk, disk to memory, or disk to disk
Batch Requests/sec – is the number of SQL Server batches received by the instance in a second
The Processes pane
The Processes pane shows the information about the currently running processes on the SQL databases, who runs them, and from which application
A tooltip for each table header shows a short description of the column data and system views used to obtain it. Each column can be filtered using the filters in the column header
The context menu for the specific process provides options to see the last T-SQL command batch for the process, kill it, or trace it in SQL Server Profiler
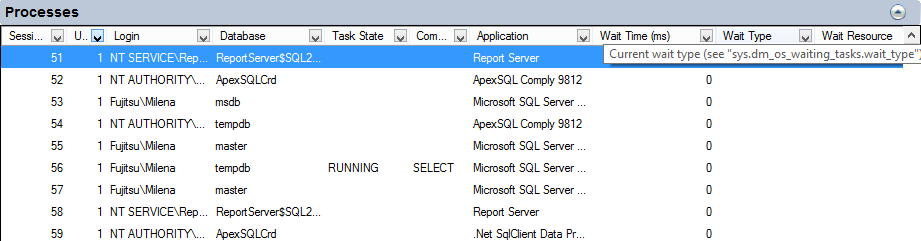
Session ID – is a unique value assigned by Database Engine to every user connection. This is the spid value returned by the sp_who procedure
User Process – 1 for user processes, 0 for system processes. The default filter is set to 1, so only user processes are shown
Login – the SQL Server login that runs the session
Database – the database name on which the process is running
Task State – the task state, blank for tasks in the runnable and sleeping state. The value can also be obtained using the sys.dm_os_tasks view, as the task_state column. The states returned can be:
“PENDING: Waiting for a worker thread.
RUNNABLE: Runnable, but waiting to receive a quantum.
RUNNING: Currently running on the scheduler.
SUSPENDED: Has a worker, but is waiting for an event.
DONE: Completed.
SPINLOOP: Stuck in a spinlock.” [2]
Command – the current command type. The value can also be obtained using the sys.dm_exec_requests view, as the command column
Application – the name of the application that created the connection
Wait Time (ms) – how long in milliseconds the task is waiting for a resource. The value can also be obtained using the sys.dm_os_waiting_tasks view, as the wait_duration_ms column
Wait Type – the last/current wait type. The value can also be obtained using the sys.dm_os_waiting_tasks view, as the wait_type column. The waits can be resource, queue and external waits
Wait Resource – the resource the connection is waiting for. The value can also be obtained using the sys.dm_os_waiting_tasks view, as the resource_description column
Blocked By – the ID of the session that is blocking the task. The value can also be obtained using the sys.dm_os_waiting_tasks view, as the blocking_session_id column
Head Blocker – the session that causes the first blocking condition in a blocking chain
Memory Use (KB) – the memory used by the task. The value can also be obtained using the sys.dm_exec_sessions view, as the memory_usage column
Host Name – the name of the computer where the current connection is made. The value can also be obtained using the sys.dm_exec_sessions view, as the host_name column
Workload Group – the name of the Resource Governor workload group[3]. The value can also be obtained using the sys.dm_resource_governor_workload_groups view, as the name column
The Resource Waits pane
Shows information about waits for resources

Wait Category – the categories are created combining closely related wait types. The wait types are shown in the Wait Type column of the Processes pane
Wait Time (ms/sec) – the time all waiting tasks are waiting for one or more resources
Recent Wait Time (ms/sec) – the average time all waiting tasks are waiting for one or more resources
Average Waiter Count – is calculated for a typical point in time in the last sample interval and represents the number of tasks waiting for one or more resources
Cumulative Wait Time (sec) – the total time waiting tasks have waited for one or more resources since the last SQL Server restart, or DBCC SQLPERF last execution
The Data File I/O pane
Shows information about the database files on the SQL Server instance. For each database, all database files are listed – MDF, LDF and NDF, their paths, and names
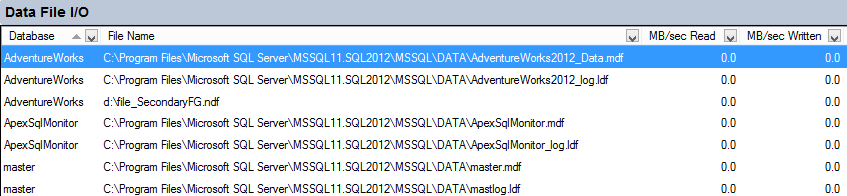
MB/sec Read – shows recent read activity for the database file
MB/sec Written – shows recent write activity for the database file
Response Time (ms) – average response time for recent read-and-write activity
The Recent Expensive Queries pane
Expensive queries are the queries that use much resources – memory, disk, network. The pane shows expensive queries executed in the last 30 seconds. The information is obtained from the sys.dm_exec_requests and sys.dm_exec_query_stats views. A double-click on the query opens the monitored statement
The context menu for the specific query provides options to open the query in Query Editor, and show the execution plan
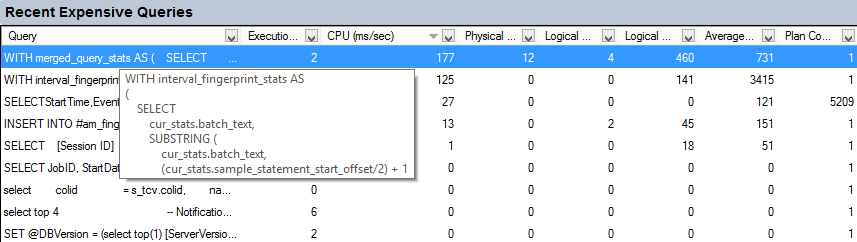
Query – the SQL query statement monitored
Executions/min – the number of executions per minute, since the last recompilation. The value can also be obtained using the sys.dm_exec_query_stats view, as the execution_count column
CPU (ms/sec) – the CPU rate used, since the last recompilation. The value can also be obtained using the sys.dm_exec_query_stats view, as the total_worker_time column
Physical Reads/sec, Logical Writes/sec, and Logical Reads/sec – the rate of physical reads/logical writes/logical reads per second. The value can also be obtained using the sys.dm_exec_query_stats view, as the total_physical_reads/ total_logical_writes/ total_logical_reads columns
Average Duration (ms) – average time that the query runs. Calculated based on the total_elapsed_time and execution_count columns in the sys.dm_exec_query_stats view
Plan Count – the number of duplicate query plans. A large number requires investigation and potential explicit query parameterization
Requirements to use Activity Monitor
The permission necessary to view Activity Monitor is VIEW SERVER STATE
To view the Data File I/O pane, besides VIEW SERVER STATE, the login must be granted CREATE DATABASE, ALTER ANY DATABASE, or VIEW ANY DEFINITION permissions
To kill a process, it’s necessary to be a member of the sysadmin role
How to start Activity Monitor
There are several ways to start Activity Monitor – in the SQL Server Management Studio toolbar click the activity Monitor icon, use the keyboard shortcut Ctrl+Alt+A, or in Object Explorer right-click the SQL Server instance and select Activity Monitor
One more option is to set Activity Monitor to be opened when SQL Server Management Studio is started
- In the SQL Server Management Studio menu click Tools and then Options
- Open the Environment | Start Up tab
- Select the Open Object Explorer and Activity Monitor option
On the next SQL Server Management Studio start up, Object Explorer will be shown on the left and Activity Monitor on the right
Activity Monitor is a SQL Server Management Studio feature that tracks some of the most important metrics that affect performance. It shows the metrics in real time, without the out-of-the-box solution to save them for later analysis. Filtering by a specific database/parameter is easy, but excluding a specific value is not possible. Monitoring additional metrics is also not possible. Due to its limited set of features and monitored metrics, it’s not recommended for in-depth performance monitoring

She has been working with SQL Server since 2005 and has experience with SQL 2000 through SQL 2014.
Her favorite SQL Server topics are SQL Server disaster recovery, auditing, and performance monitoring.
View all posts by Milena "Millie" Petrovic
- Using custom reports to improve performance reporting in SQL Server 2014 – running and modifying the reports - September 12, 2014
- Using custom reports to improve performance reporting in SQL Server 2014 – the basics - September 8, 2014
- Performance Dashboard Reports in SQL Server 2014 - July 29, 2014