
Azure Data Studio (ADS) is an integrated, lightweight database development for supporting both on-premises and cloud databases. It can be installed on Windows as well as Linux operating system. I am assuming you are familiar with the SQL Server Management Studio. If you work on Linux based SQL Server instance, you can install only ADS in those systems. We can use integrated terminals to execute the PowerShell and Terminal sessions for the Linux system.
Once you install ADS and connect to a SQL Instance, it provides a default dashboard. You should always work on the latest version of ADS to be familiar with the latest feature. I am using the latest version ADS1.17.1 released on the 30th April 2020. If you are already running a previous version of ADS, you can click on the settings button at the bottom left-hand side and click on Check for updates.
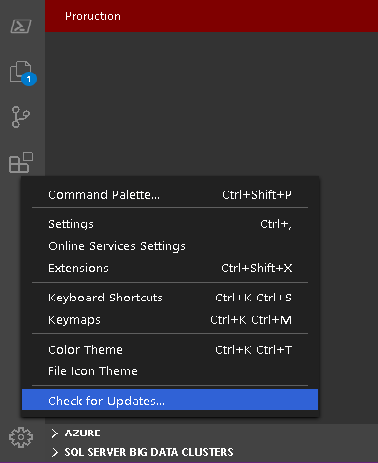
It automatically downloads the latest version of ADS provided you have an active internet connection.
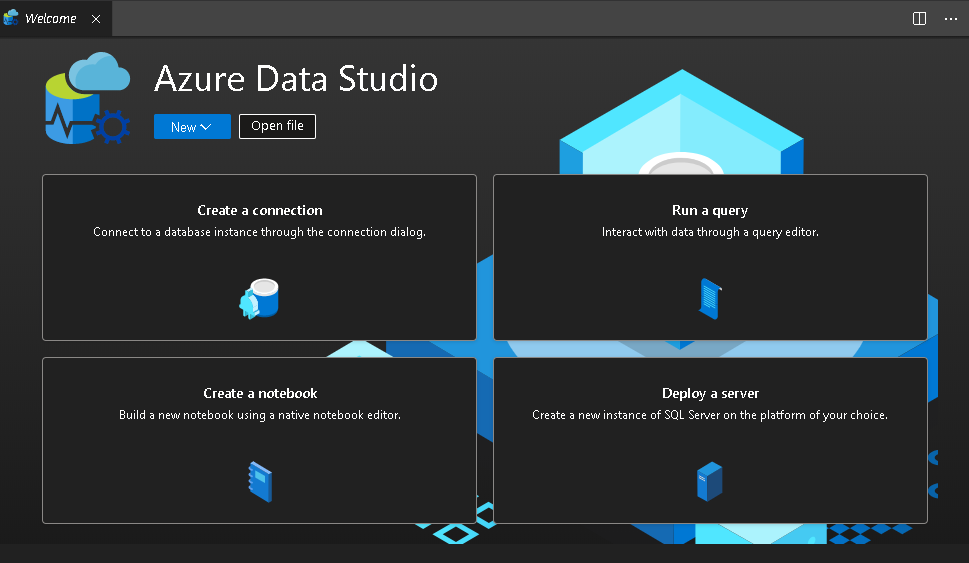
Launch ADS 1.17.1, and you get a beautiful welcome screen. Here you get following options
- Create a Connection
- Run a query
- Create a SQL Notebook
- Deploy a server
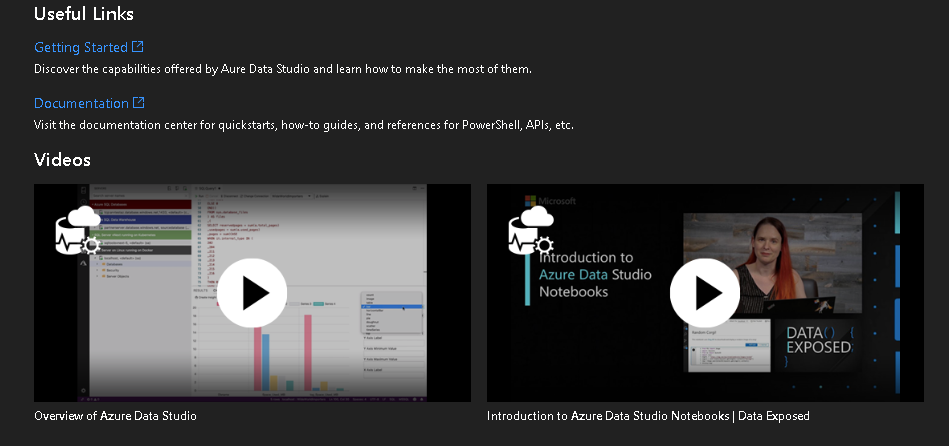
You also get useful links to start learning ADS and video to make you familiar with this new tool.
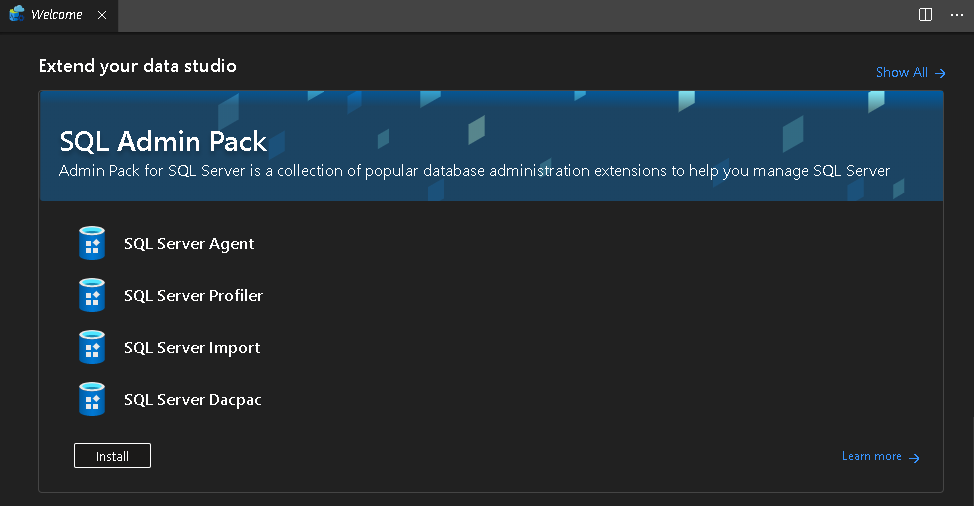
You can use extensions in Azure Data Studio to extend the features supported by this tool. In the welcome page, we get the following useful database administration extensions to install it ADS.
- SQL Server Agent
- SQL Server Profiler
- SQL Server Import
- SQL Server Dacpac
Let’s connect to SQL Server in ADS, right-click on the instance and click on Manage.
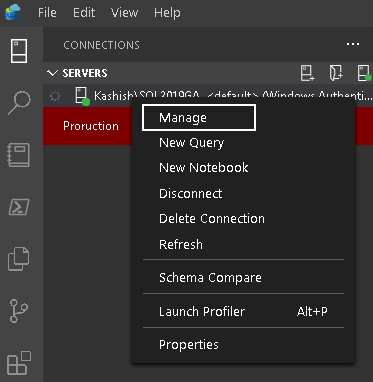
It opens the Server Dashboard, as shown below. I have marked different sections in the screenshot using numbers.
Server Dashboard in Azure Data Studio
Quick access toolbar
In this quick access toolbar, we get options to launch a few useful tasks such as backup, restore, and create an external table. You also get a hyperlink Learn more to open the documentation page – Manage servers and databases with Insight widgets in Azure Data Studio. It requires an active internet connection on the Server where ADS is installed.
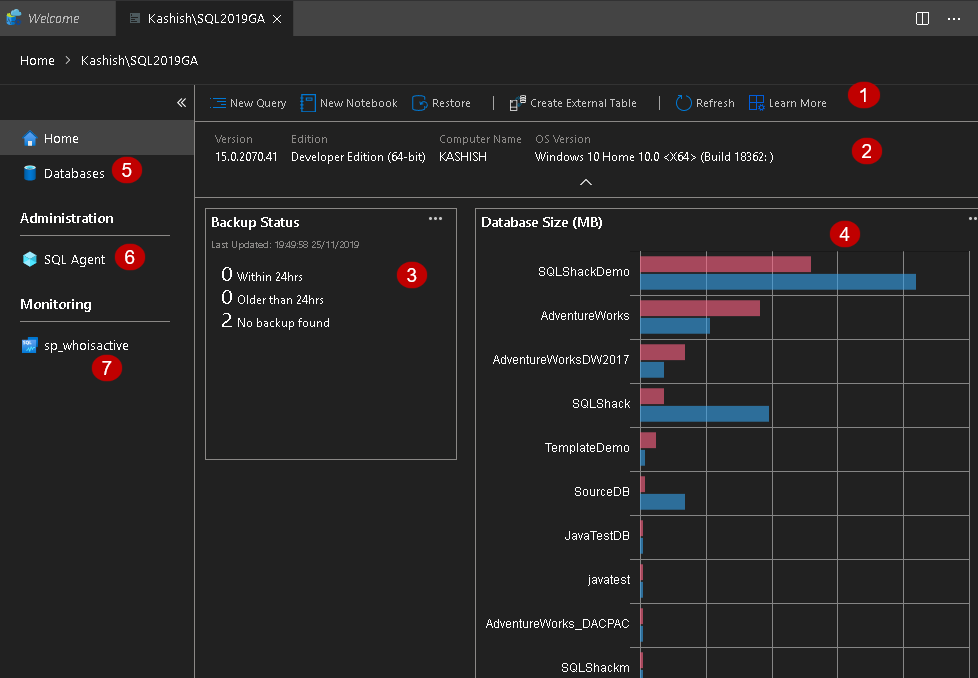
SQL instance overview
In this section, you get information about connected SQL instance version, edition, hostname along with the operating system version.
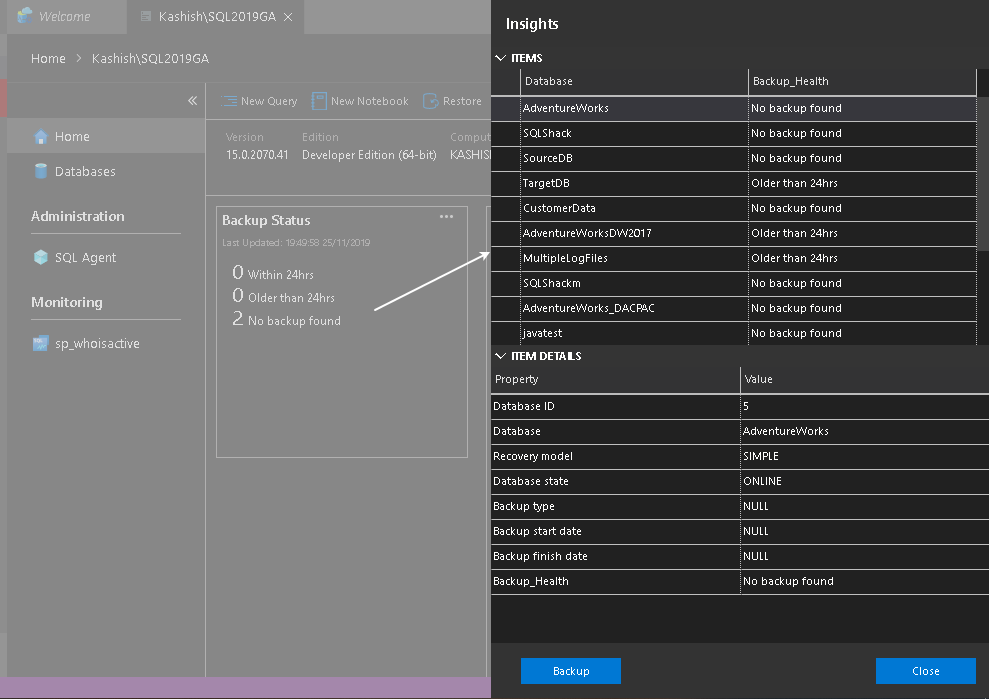
Backup Status
In this backup dashboard, we get a high-level summary of database backups:
- Completed backup within last 24 hours
- Database backups age older than 24 hours
- Total backups found
You can also click on eclipse as shown below, and you get options few options as shown below.
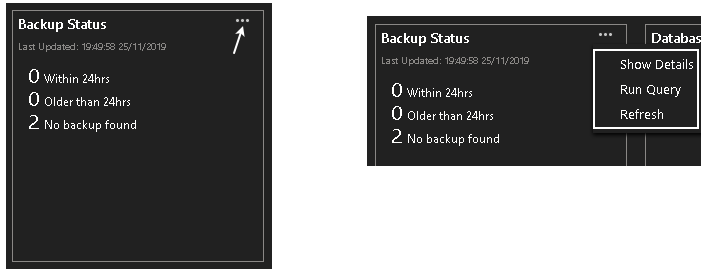
Click on Run Query, and it opens a new query tab with the script it uses to show details in the dashboard.

If we click on Show Details, it shows details of backups for each database. We can click on a particular database, and get detailed information such as recovery mode, database state, last backup start and end time, backup health.
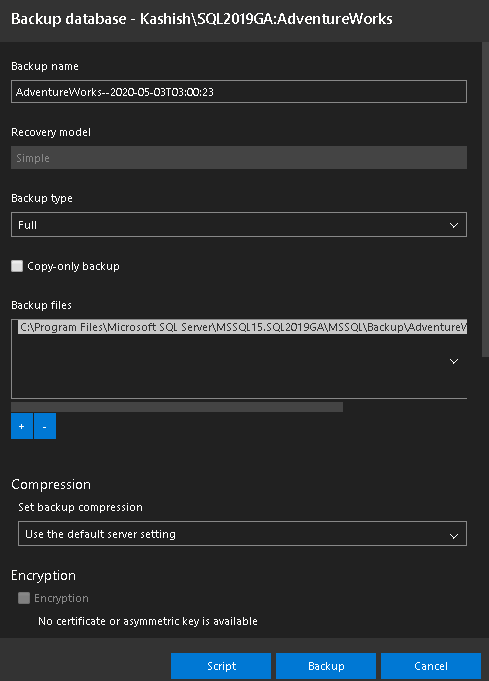
We can launch backup directly from this details section. Click on backup, and it launches the backup wizard.
Database Size
It is a friendly dashboard and helps you to visualize data and log file size of all databases in the instance.
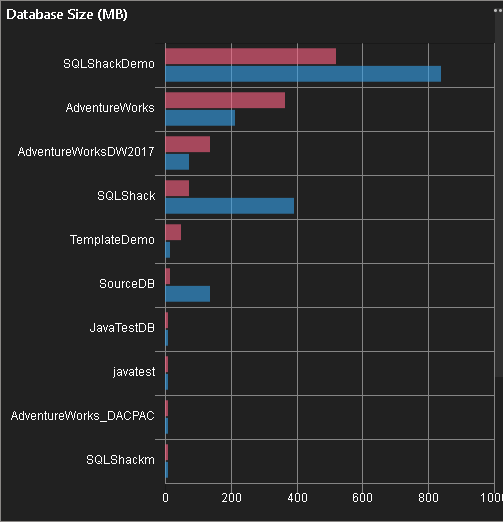
Here, the pink bar shows data file size and blue bar shows log file size. You can hover the mouse and get the actual data point for each file.
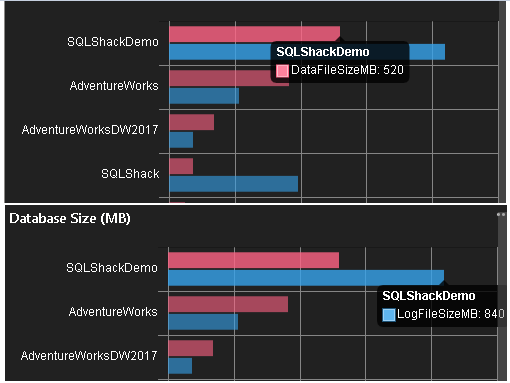
Sometimes, you can see that the log file size gets more prominent than the data file size. It can occur if the database is in full recovery model and you do maintain transaction log backups. In the above screenshot, we see [SQLShackDemo] data file size is more significant than a log file. We can easily keep track of database file sizes using this visual.
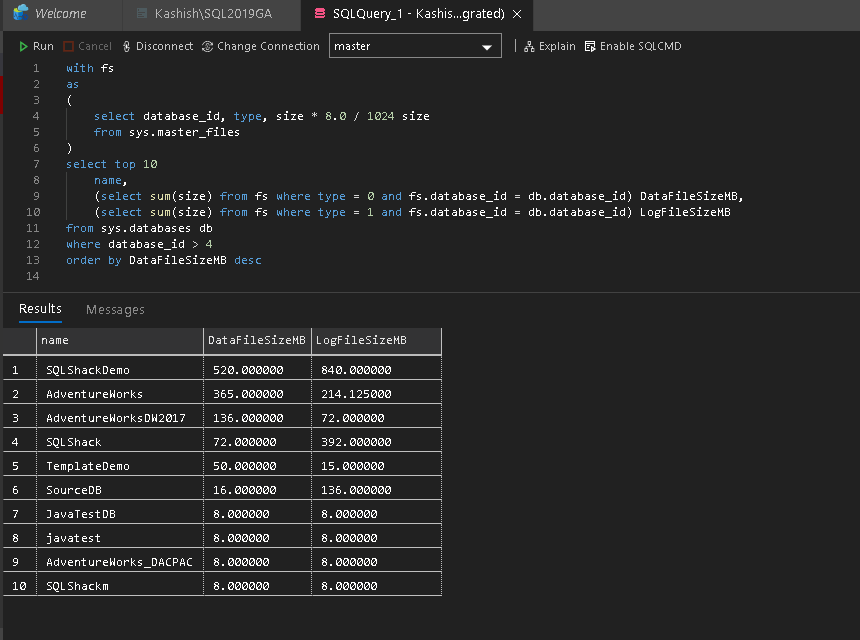
Similar to the backup visual, we can also click on Run Query and view the results along with query in ADS.
Databases
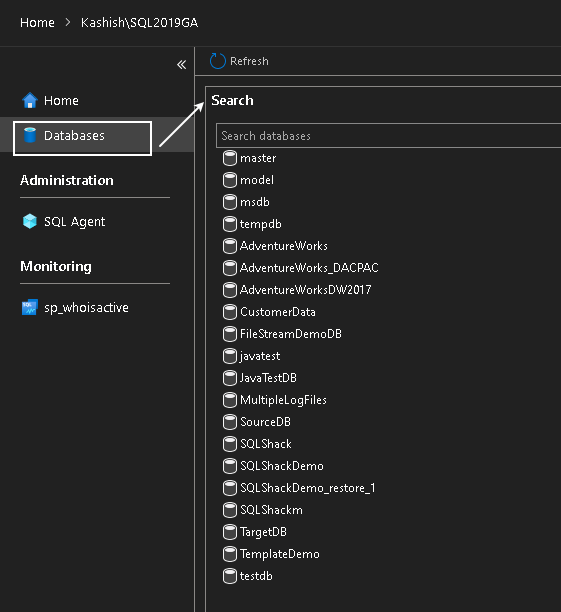
Click on the databases, and it lists all databases in your SQL instance. You can search for a specific database using the search box.
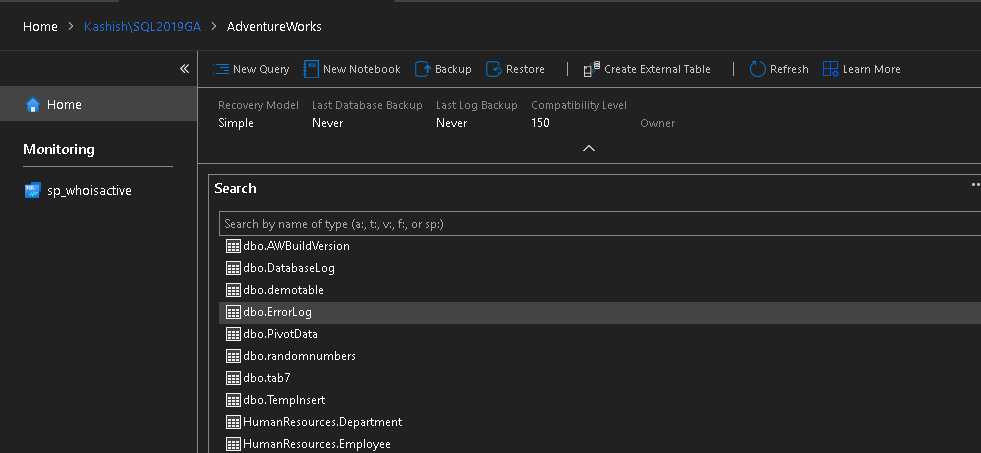
Click on a specific database ( for example – AdventureWorks). It gives you quick menu options for a specific database. You can also see database details such as recovery model, last full backup, last log backup and the compatibility level.
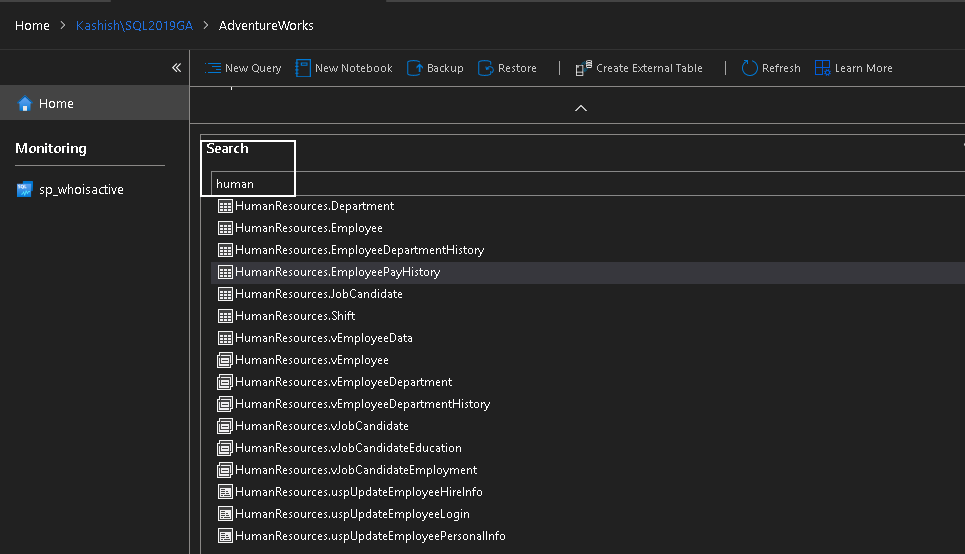
You can also search for objects( tables, views, stored procedures) as well in the database.
It is an interactive search. ADS starts filtering objects as soon as you type characters in the search box.
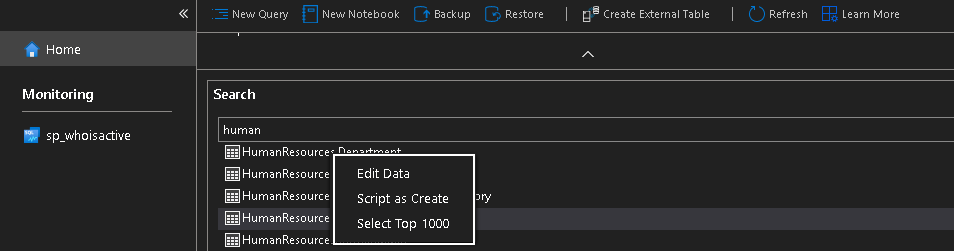
We can right-click on a specific object, and it gives you option differently for tables, stored procedures and views.
Tables
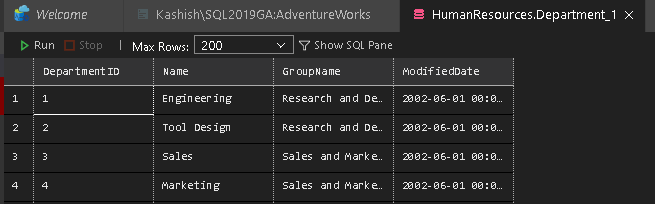
Edit Data
You can edit existing data in a graphical pane. Click on this option, and it opens the following data view. You can click on any data row, modify data and save it.

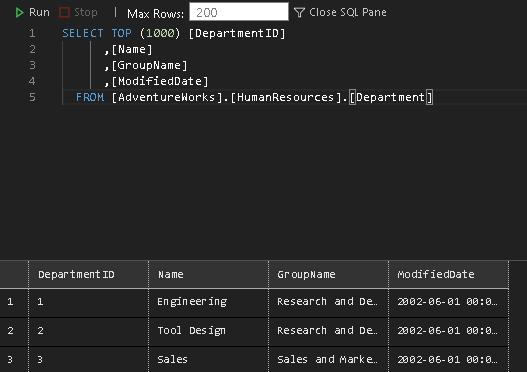
By default, it shows a maximum of 200 rows in the output. You can choose to display 1000 or 10000 rows in this view.
If you click on Show SQL Pane, you get the query it uses for this view
Script as create:
We can script out the SQL table using this option
Select top 1000:
You get the top 1000 records from this SELECT TOP 1000 option
Stored procedure
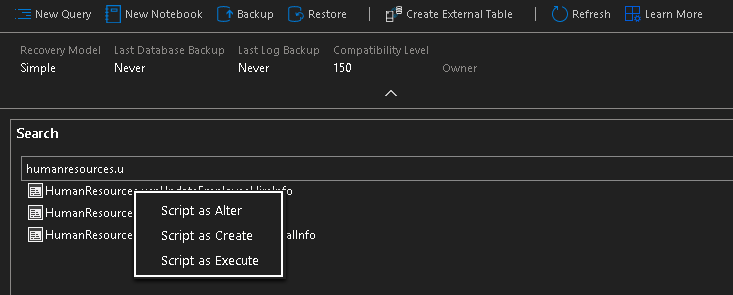
For a stored procedure, you get the following options:
Script as Alter:
It scripts out a stored procedure with an Alter Procedure statement
Script as Create:
It scripts out a stored procedure with a CREATE Procedure statement
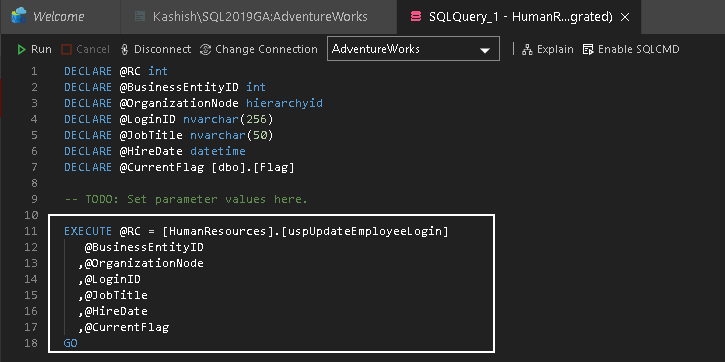
Script as Execute: We can get a script to execute this stored procedure. You can specify values for the parameters, if any and execute it
SQL Agent
You can create, execute, manage the SQL Agent jobs, SQL Notebook jobs, alerts, operators and proxies using the SQL Agent.
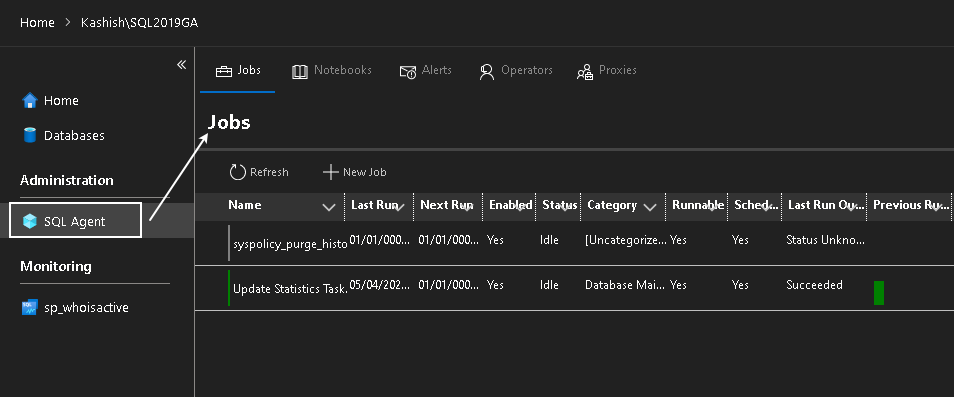
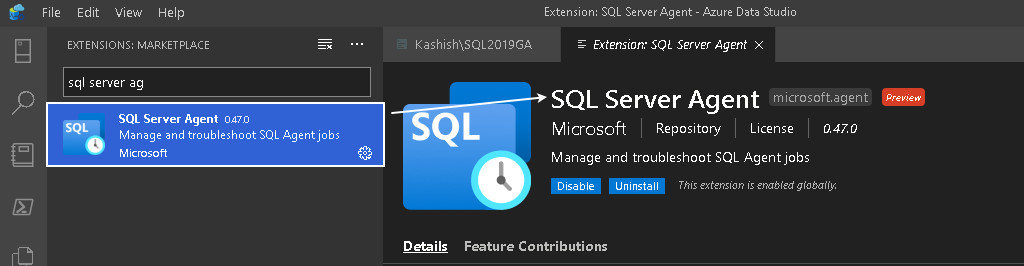
By default, SQL Server Agent is not part of the Azure Data Studio. You can go to the marketplace and install the SQL Server Agent extension to get this SQL Agent option in the administration tab.
You should explore the article Scheduling SQL Notebooks in Azure Data Studio for SQL Notebook jobs.
Monitoring
It uses SP_WHOISACTIVE stored procedure to display the charts for top CPU, CPU delta, memory data, memory delta in the Azure Data Studio. It is a monitoring stored procedure written by Microsoft MVP Adam Machanic. It provides you with a result set with compressive information such as execution plan, waits for stats, long-running queries to analyze performance issues.
You should have installed the Sp_WhoIsActive extension in Azure Data Studio using the marketplace. You can explore the article An overview of the sp_WhoIsActive stored procedure to learn and get more details of this procedure.
Adding a Custom database dashboard in Azure Data Studio
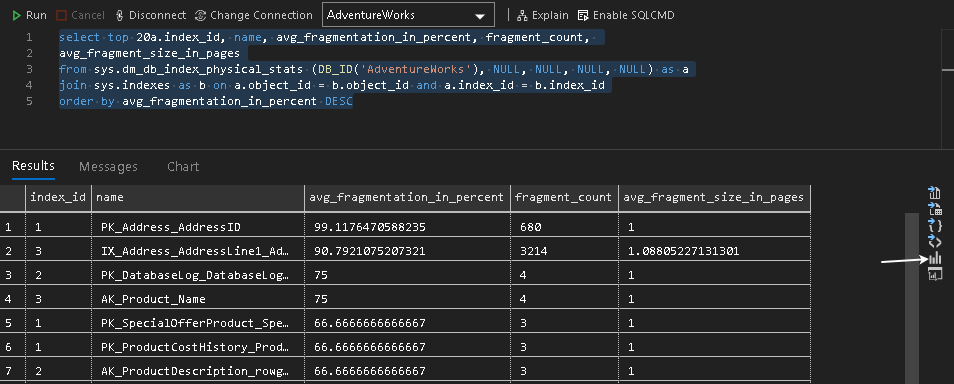
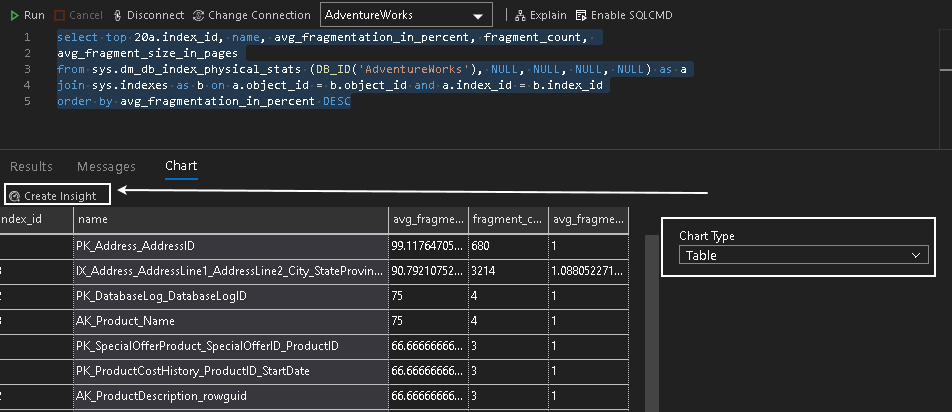
We can add custom dashboards as well in the ADS. Suppose, we want to add index fragmentation status for the top 20 indexes based on the average fragmentation in the dashboard.
We will use the following query for this dashboard.
|
1 2 3 4 5 |
select top 20a.index_id, name, avg_fragmentation_in_percent, fragment_count, avg_fragment_size_in_pages from sys.dm_db_index_physical_stats (DB_ID('AdventureWorks'), NULL, NULL, NULL, NULL) as a join sys.indexes as b on a.object_id = b.object_id and a.index_id = b.index_id order by avg_fragmentation_in_percent DESC |
Execute this query, view results and click on Chart icon as pointed by an arrow. Save this SQL query in a directory.
Select chart type Table and you get data in a table format.
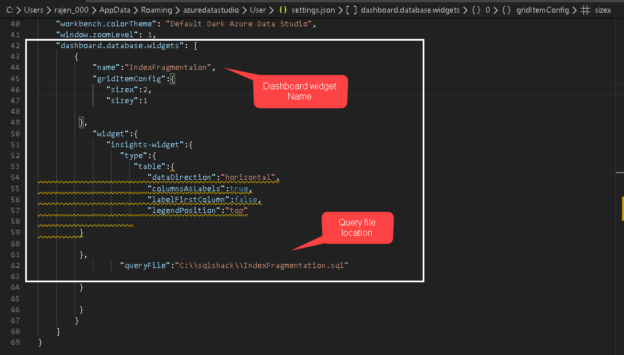
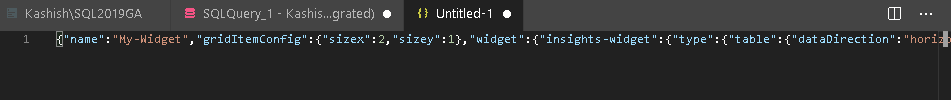
Click on Create Insight, and it gives you code in JSON key-value pairs as shown below.
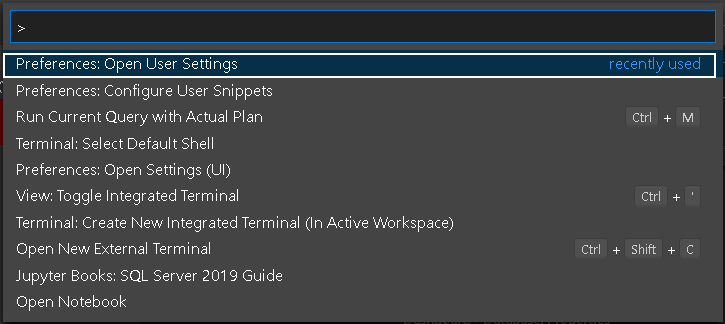
Go to View-> Command Palette -> Preference : Open User Settings.
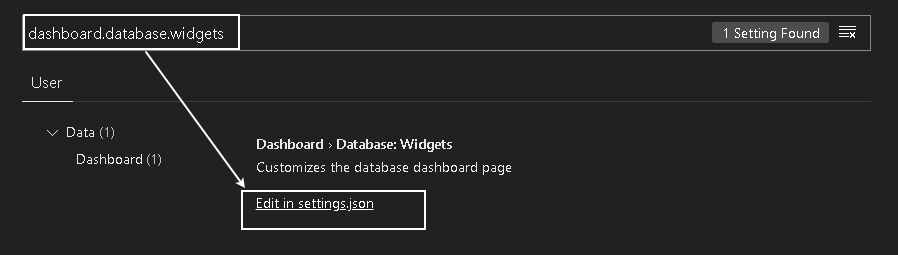
It opens the settings configurations. Search for the dashboard.database.widgets and you get an option to edit in the settings.json file.
It opens the following settings file in the JSON format.
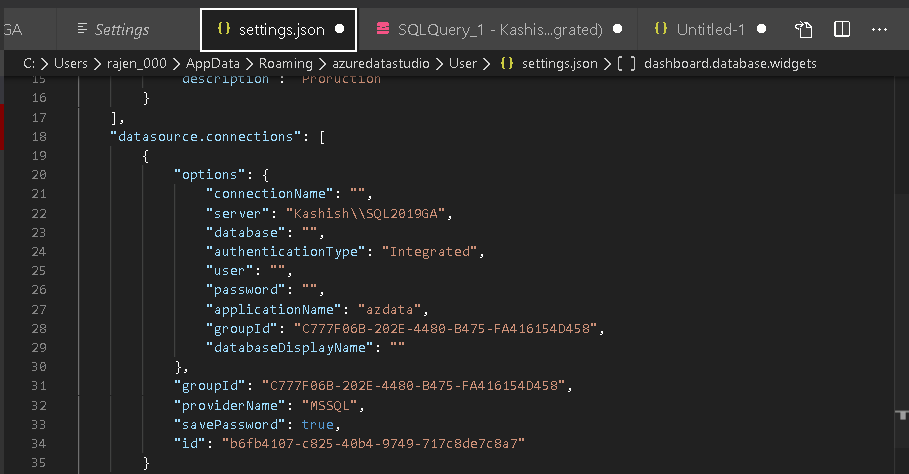
In this script, go to the dashboard.database.widgets section and paste the JSON we get from the Create Insight option earlier. I formatted the JSON before putting in the settings.json using the URL. We can see the updated setting page for the IndexFragmentation database widget.

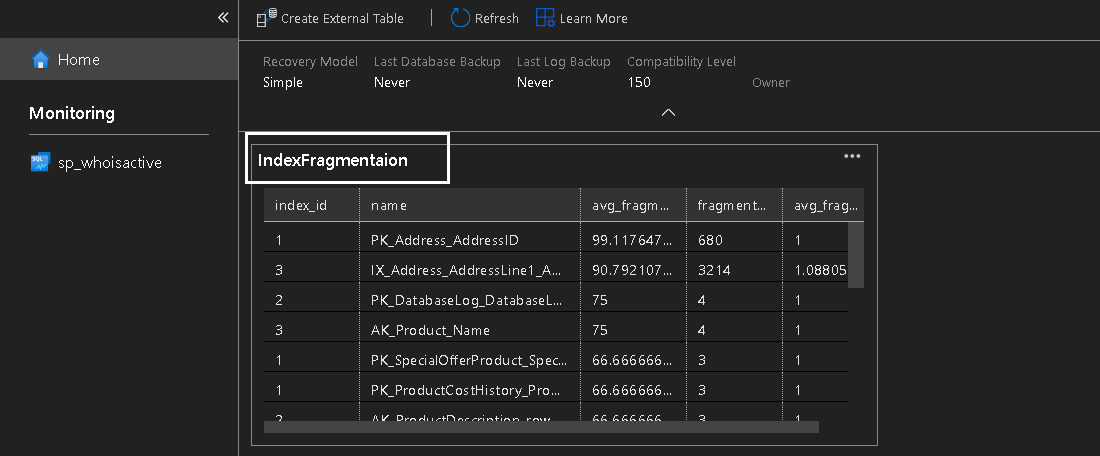
Save this setting page. Right-click on the AdventureWorks database and go to Manage. We can see IndexFragmentation, as shown below.
Conclusion
In this article, we explored Server and Database dashboards in the Azure Data Studio. We also configured a custom dashboard for index fragmentation for the user database. You can customize this dashboard as per your requirement and view frequently used queries output in tabular or chart format.

I am the author of the book "DP-300 Administering Relational Database on Microsoft Azure". I published more than 650 technical articles on MSSQLTips, SQLShack, Quest, CodingSight, and SeveralNines.
I am the creator of one of the biggest free online collections of articles on a single topic, with his 50-part series on SQL Server Always On Availability Groups.
Based on my contribution to the SQL Server community, I have been recognized as the prestigious Best Author of the Year continuously in 2019, 2020, and 2021 (2nd Rank) at SQLShack and the MSSQLTIPS champions award in 2020.
Personal Blog: https://www.dbblogger.com
I am always interested in new challenges so if you need consulting help, reach me at rajendra.gupta16@gmail.com
View all posts by Rajendra Gupta
- Understanding PostgreSQL SUBSTRING function - September 21, 2024
- How to install PostgreSQL on Ubuntu - July 13, 2023
- How to use the CROSSTAB function in PostgreSQL - February 17, 2023