
Introduction
A few months ago, I was working on a few SQL Server reports for a client. The one request that I had received (from this client) was to ensure that the finished reports were as ‘all encompassing’ as possible, as they wanted to conduct a considerable amount of Business Analytics, via the reports.
Knowing this, I decided (where possible) to attempt to construct the reports so as to enable the firm to do their ‘what if’ scenarios with a minimal amount of time and effort.
The screen shot below is a sample of the final report AND we are going to look at the steps necessary to create this report. Stay with me!!!

Getting started
Opening SQL Server Data Tools (hence forward referred to as SSDT) we begin by creating a Reporting Services Project call ‘Cars’. The project may be created in any directory that is convenient to you.
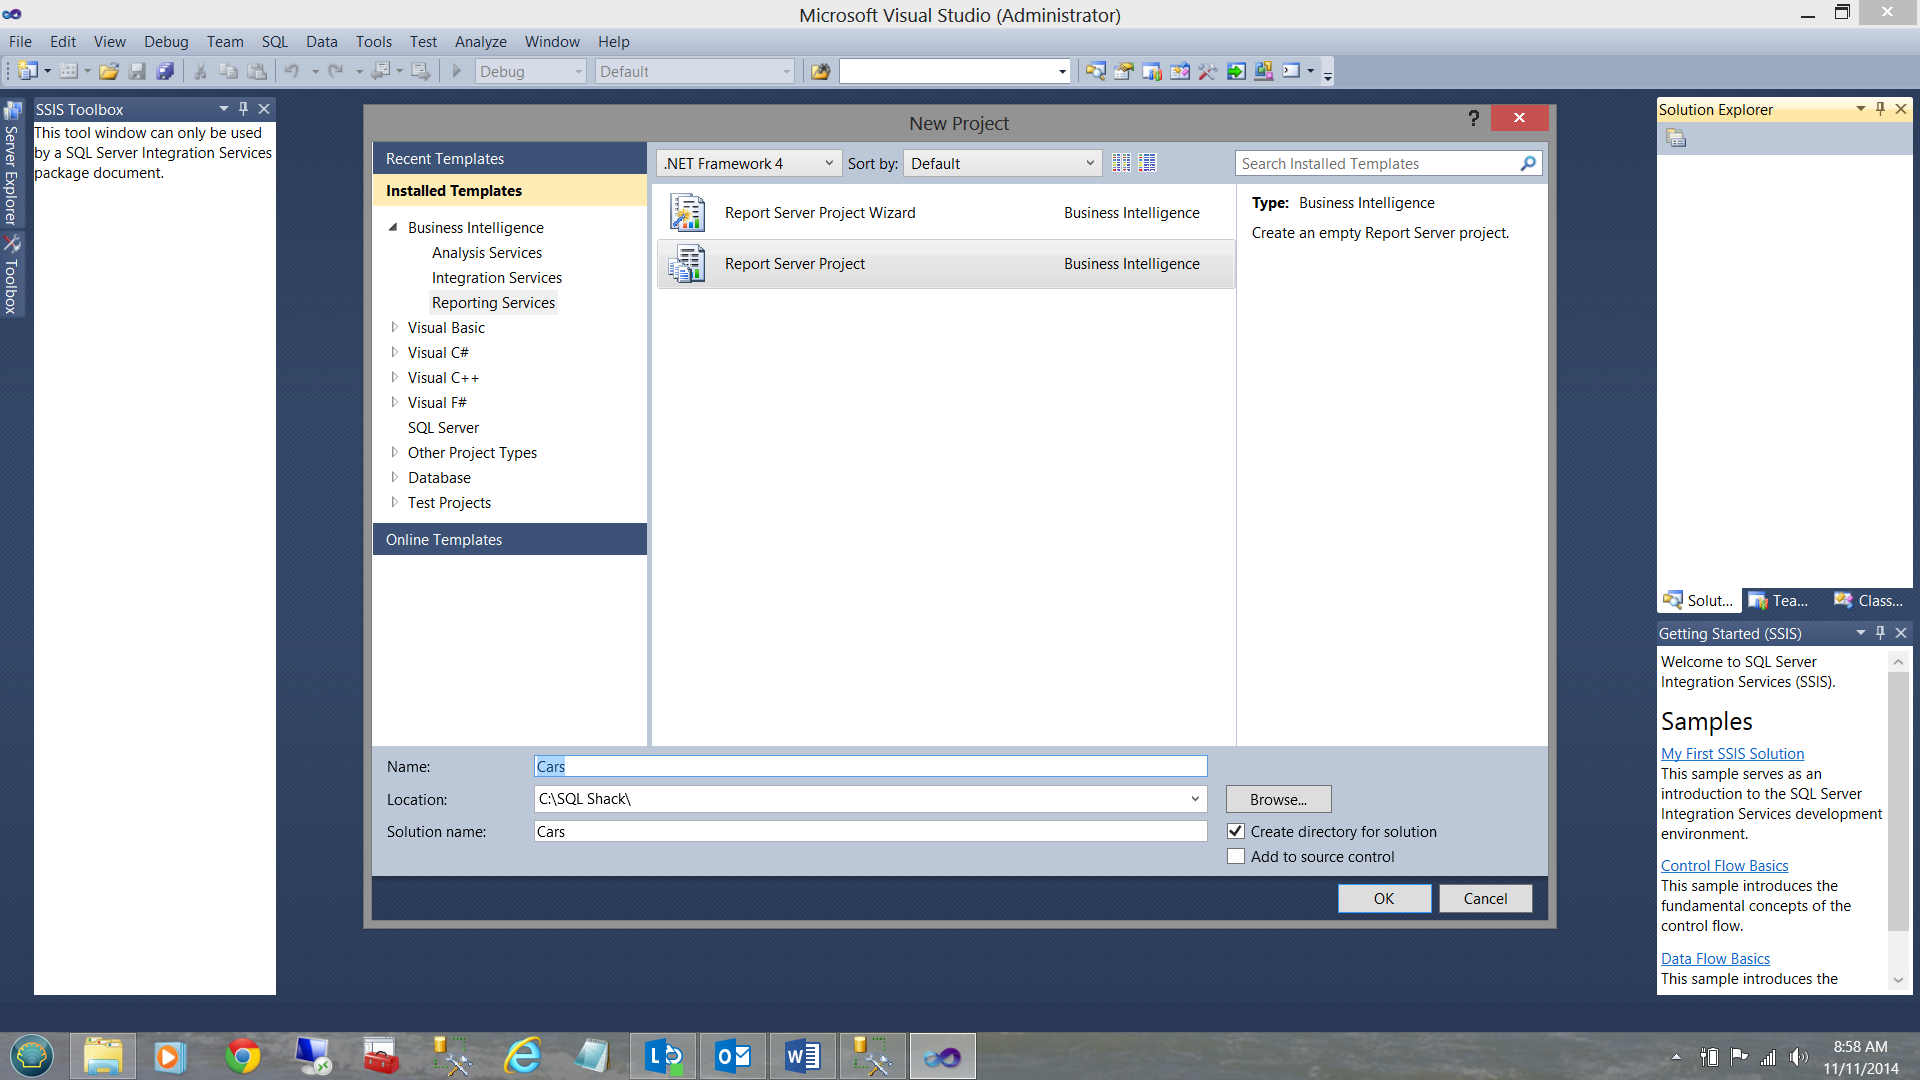
We click OK to arrive at our drawing surface. We first need to create a brand new ‘report’.
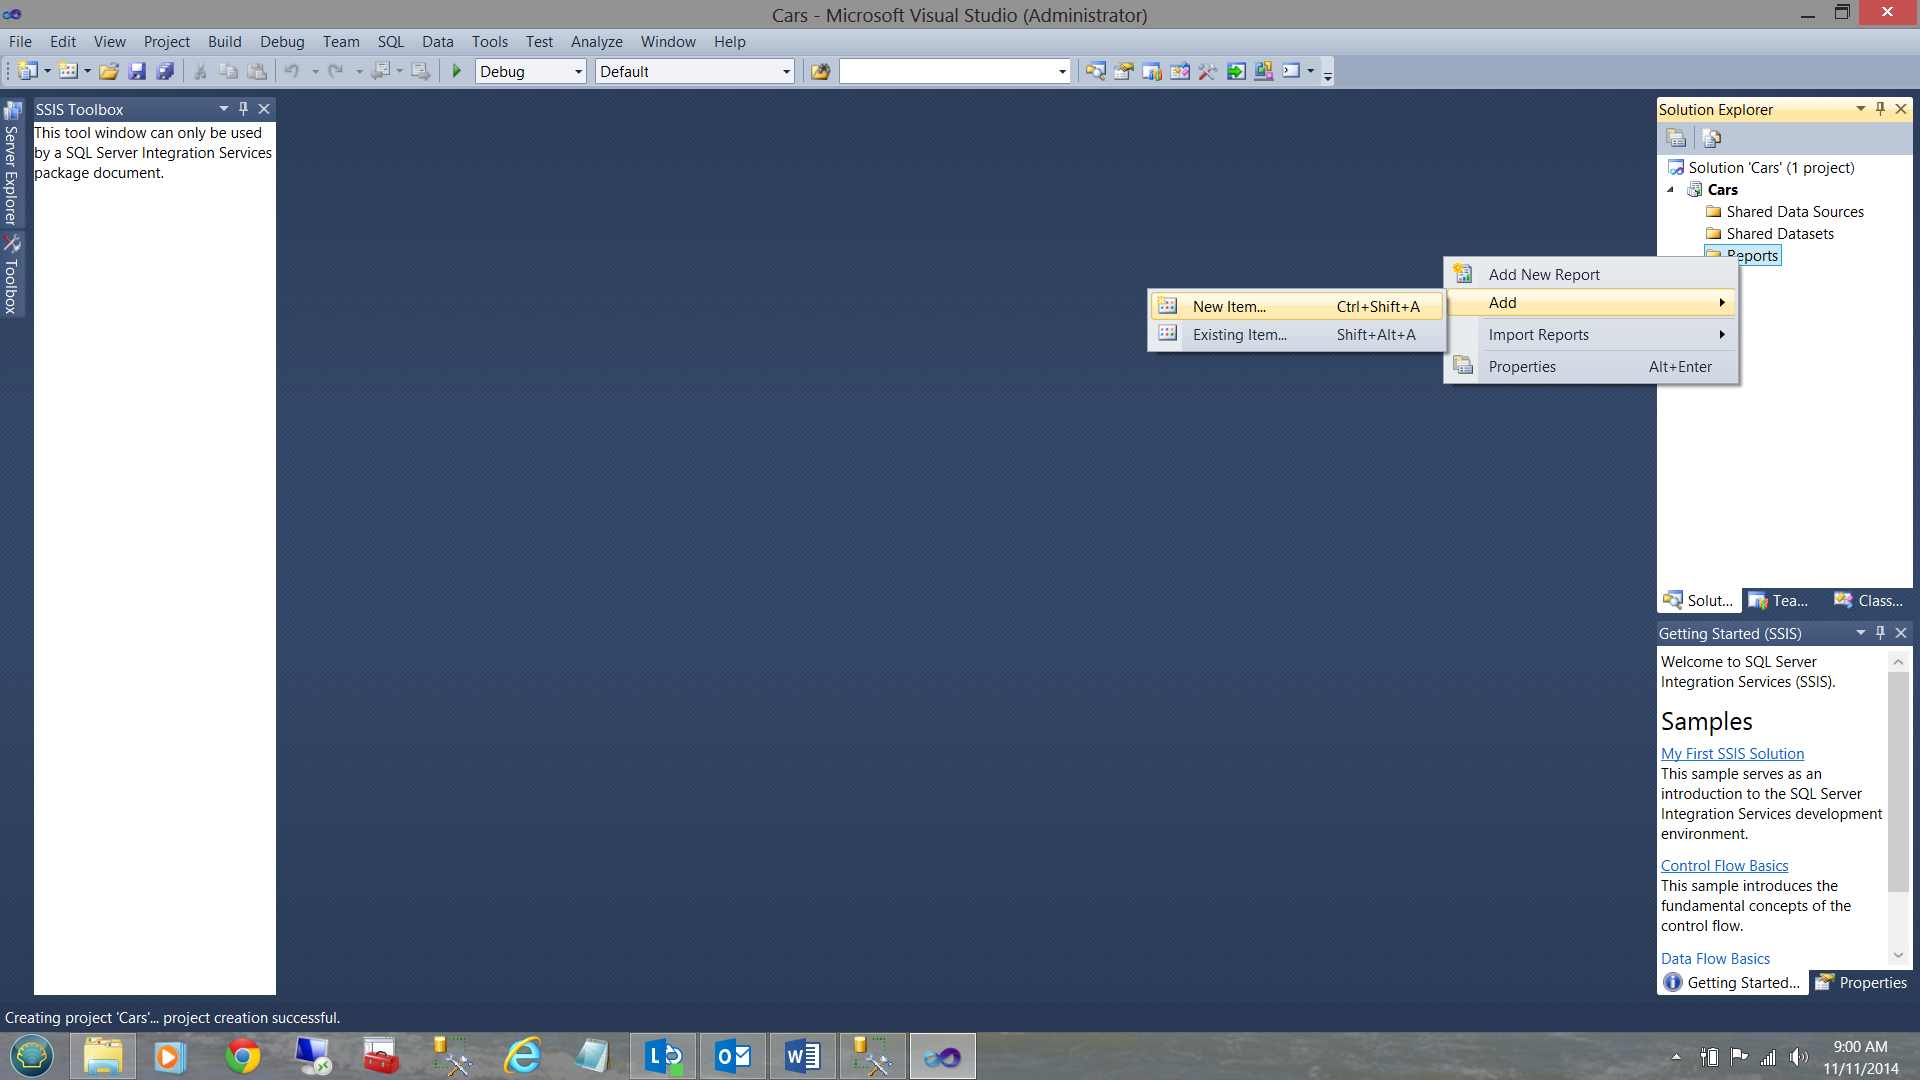
By right clicking on the Reports folder on the ‘Solution Explorer; we see the context menu (see above). We next click ‘Add’ and then ‘New Item’. The ‘new report’ menu is then brought up for you to see.
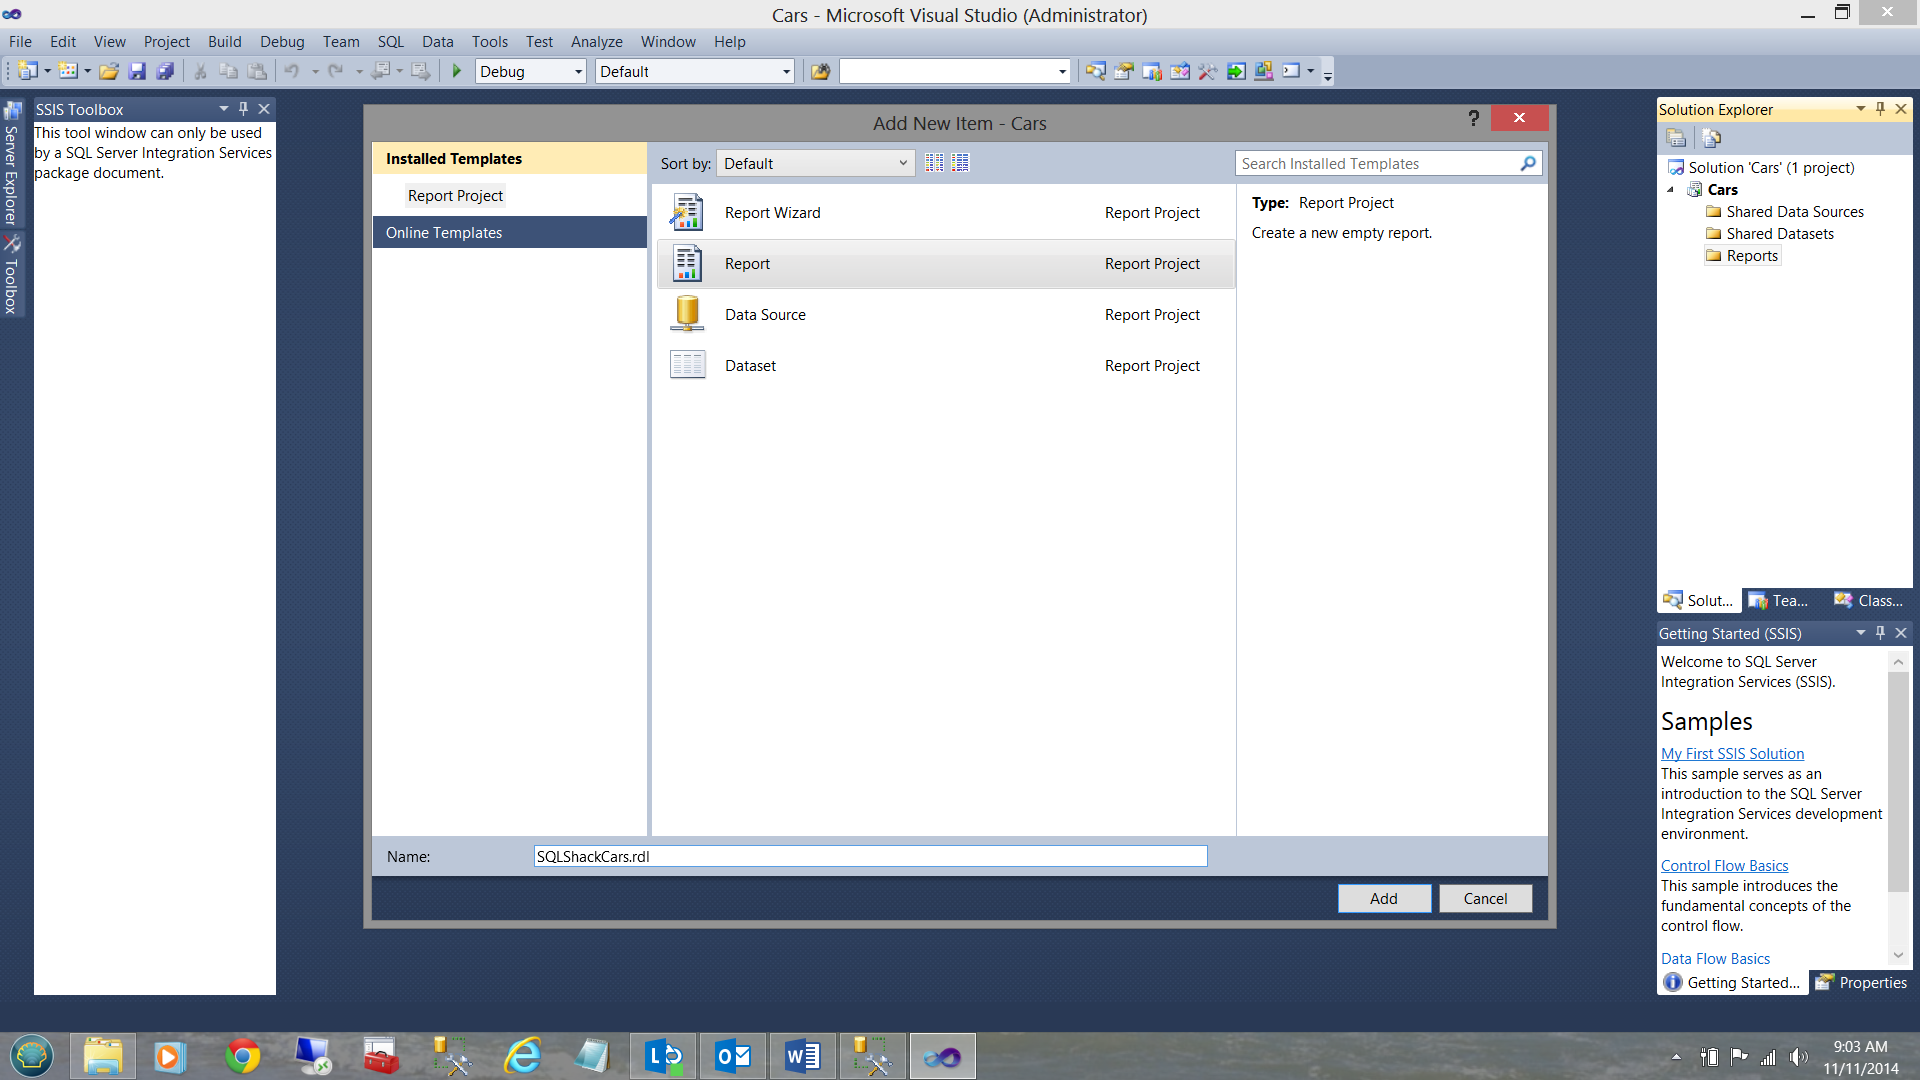
We choose the option ‘Report’ and give our report a name: ‘SQLShackCars’. The click Add.
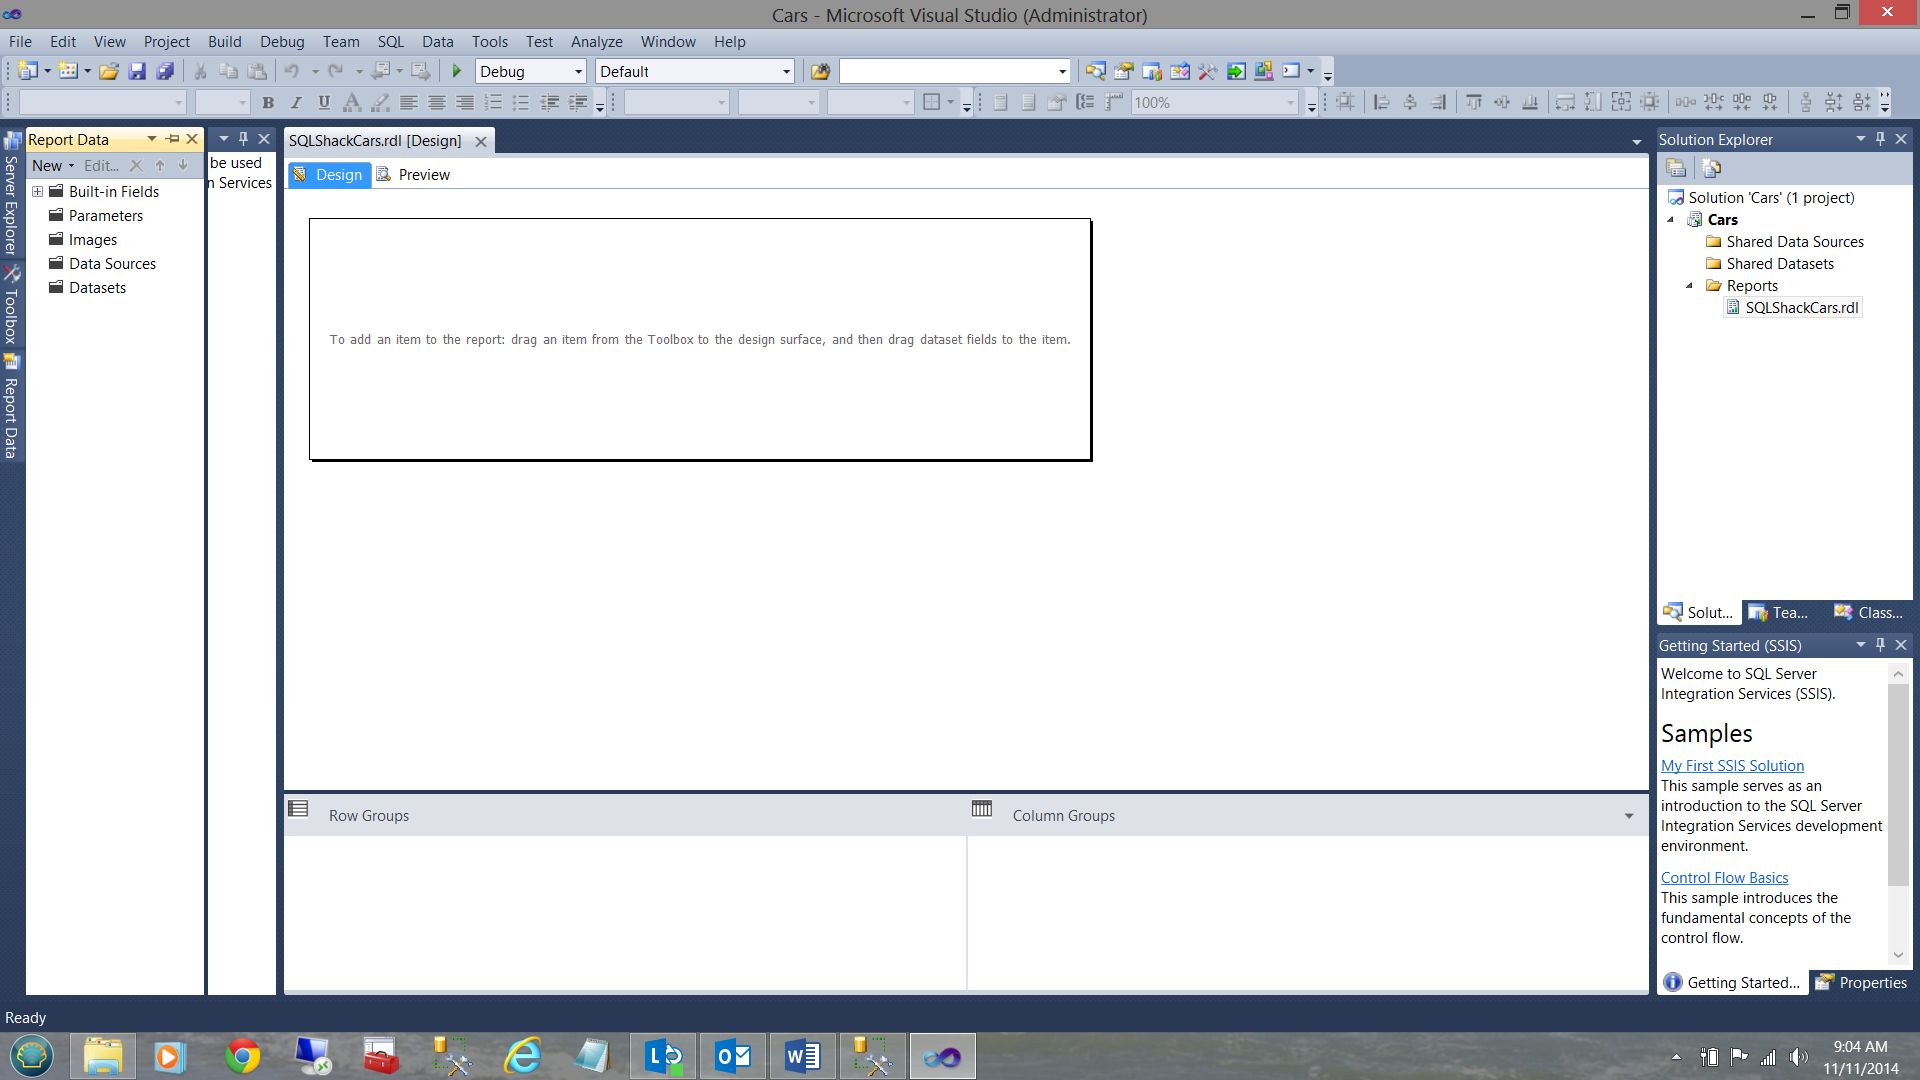
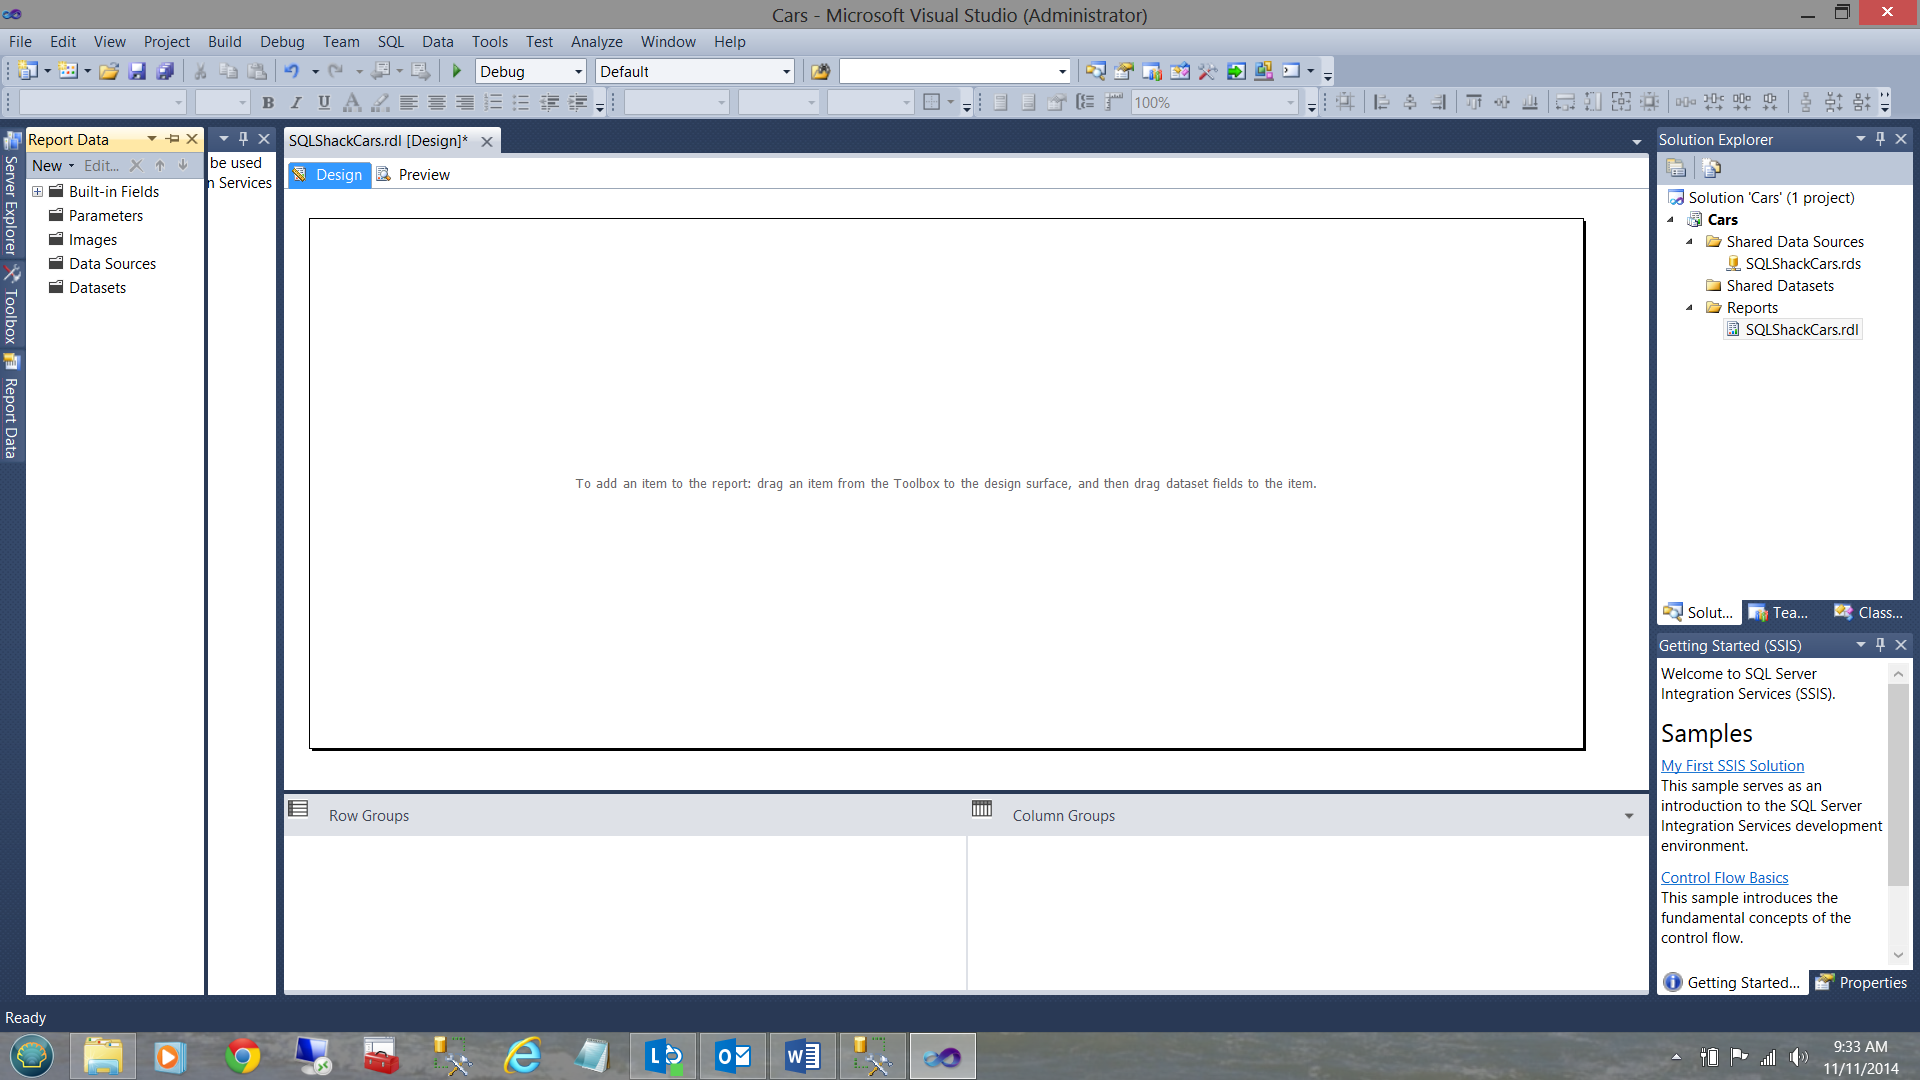
As the reader will note above, we now have a drawing surface, and an area to define and to create datasets parameters (upper left).
We must now create a ‘Shared Data Source’ to access our data.
A data source may be likened to a ‘water tap’ on a house. The report will be using the ‘water’ /data thus it is necessary to define where that ‘water’ / data resides.
I right click on ‘Shared Data Sources’ and the following context menu is displayed (see below top right).
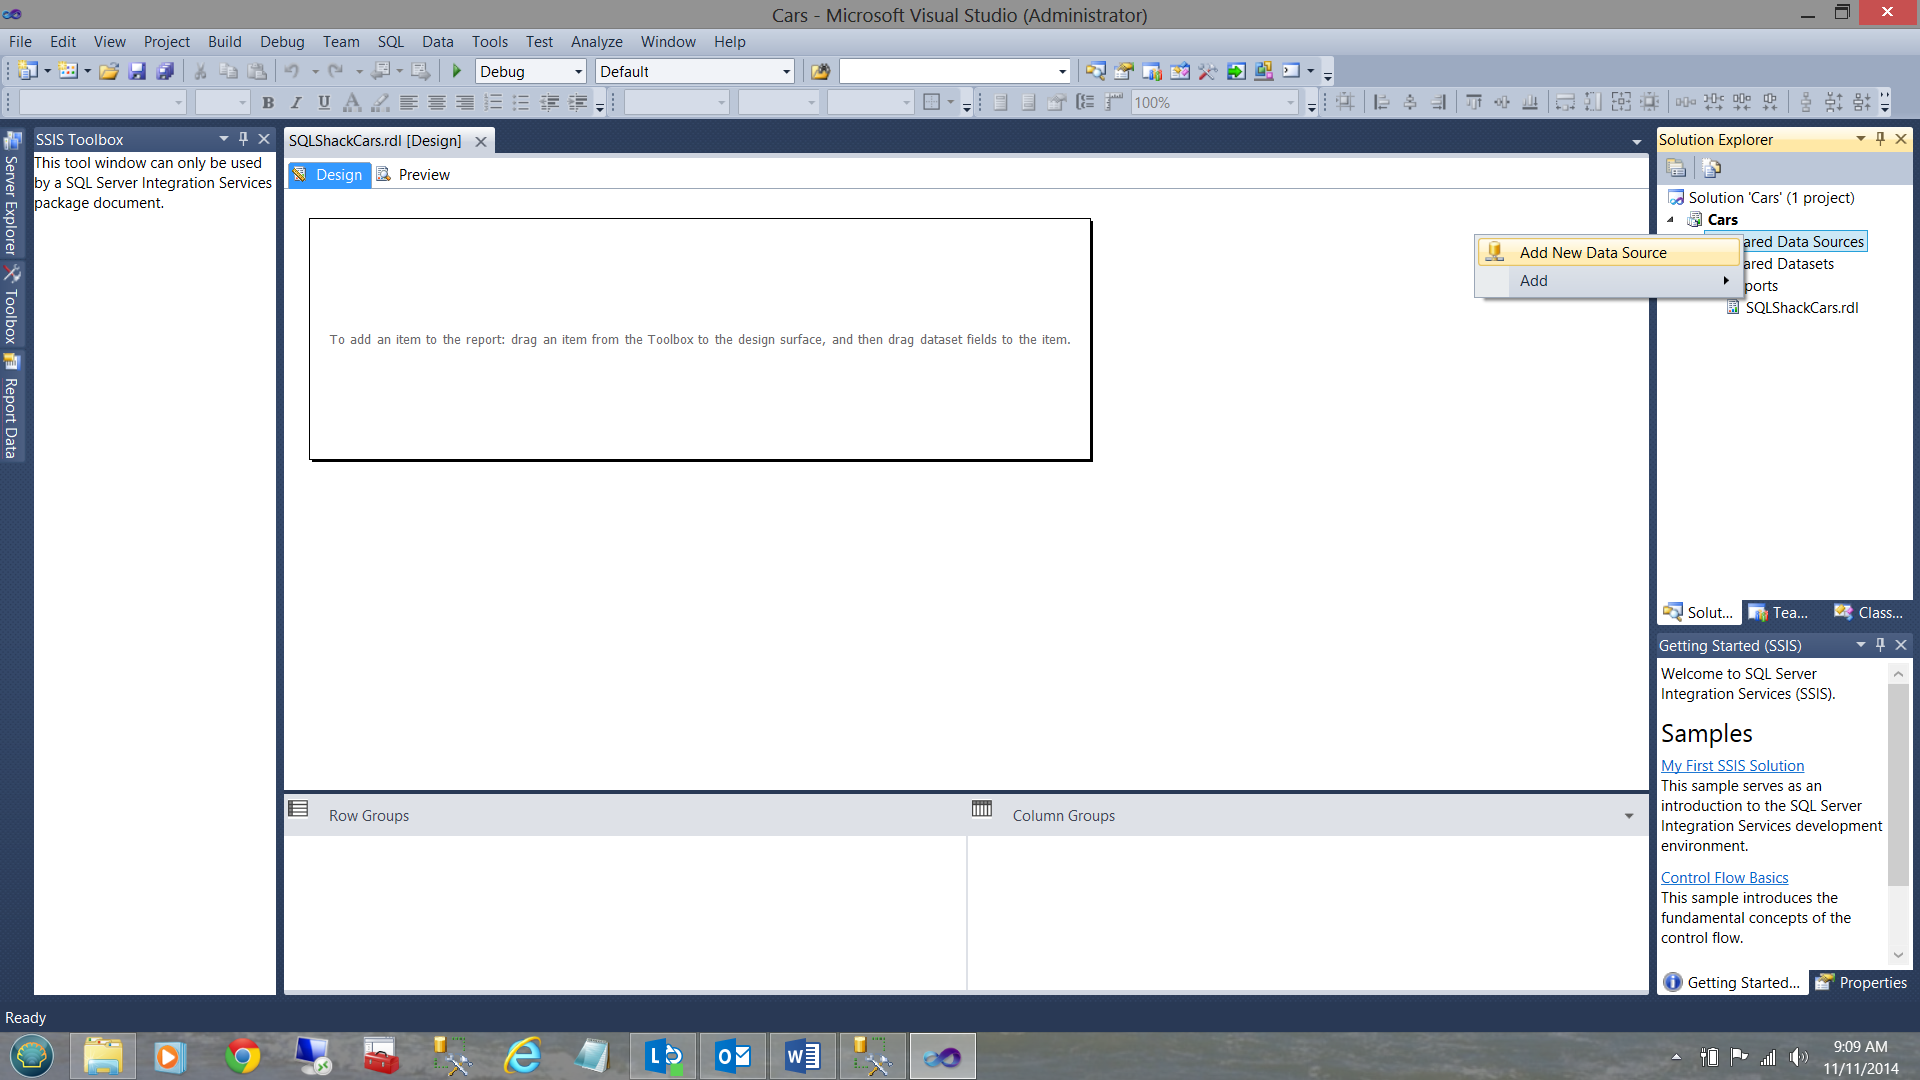
I choose ‘Add New Data Source’ from the context menu (see above). It should be noted from the outset that this data source (as it is shared) is for all intents and purposes a ‘GLOBAL’ data source. The ‘Shared Data Source Properties’ data entry screen is then displayed.
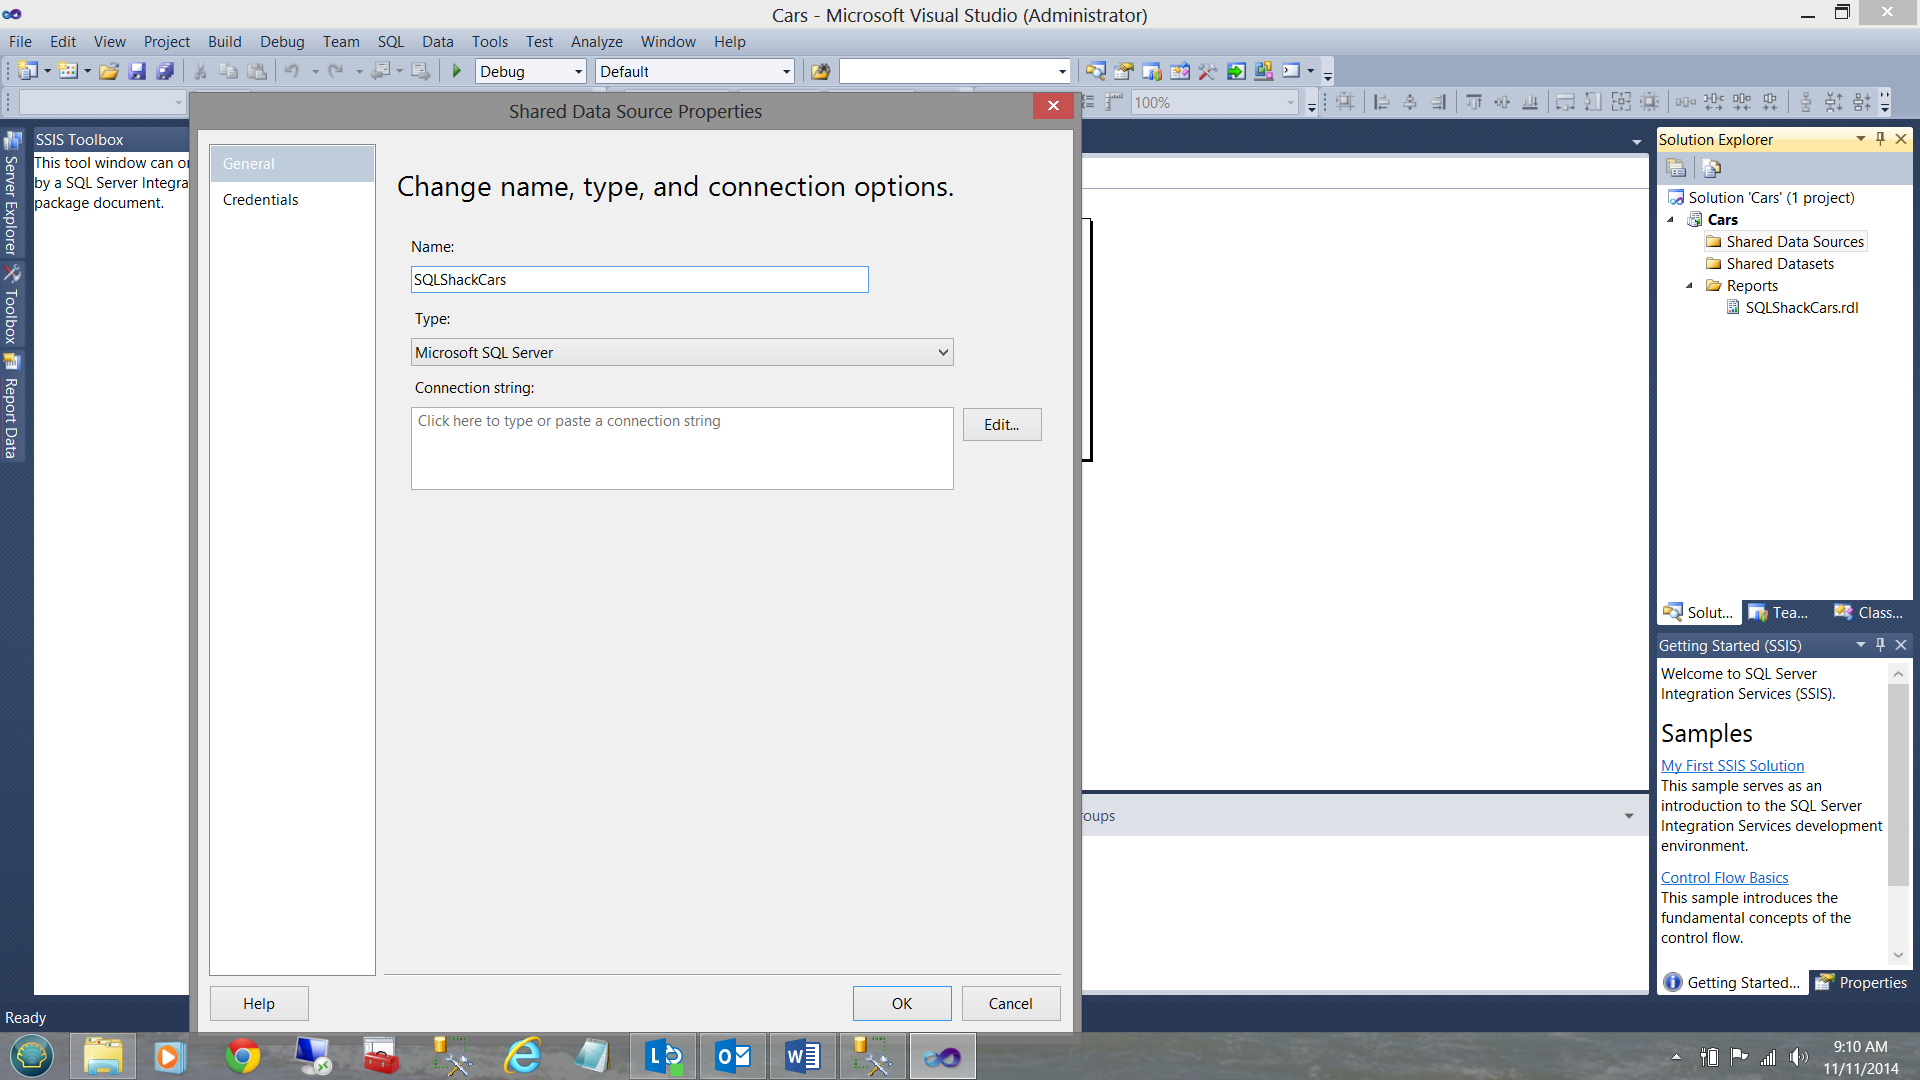
Note that I have given the data source a name (see above) and the only step left is to define the ‘connection string’ to our database (where our report data resides). By clicking ‘Edit’ we arrive at the ‘Connection Properties’ data entry screen (see below).
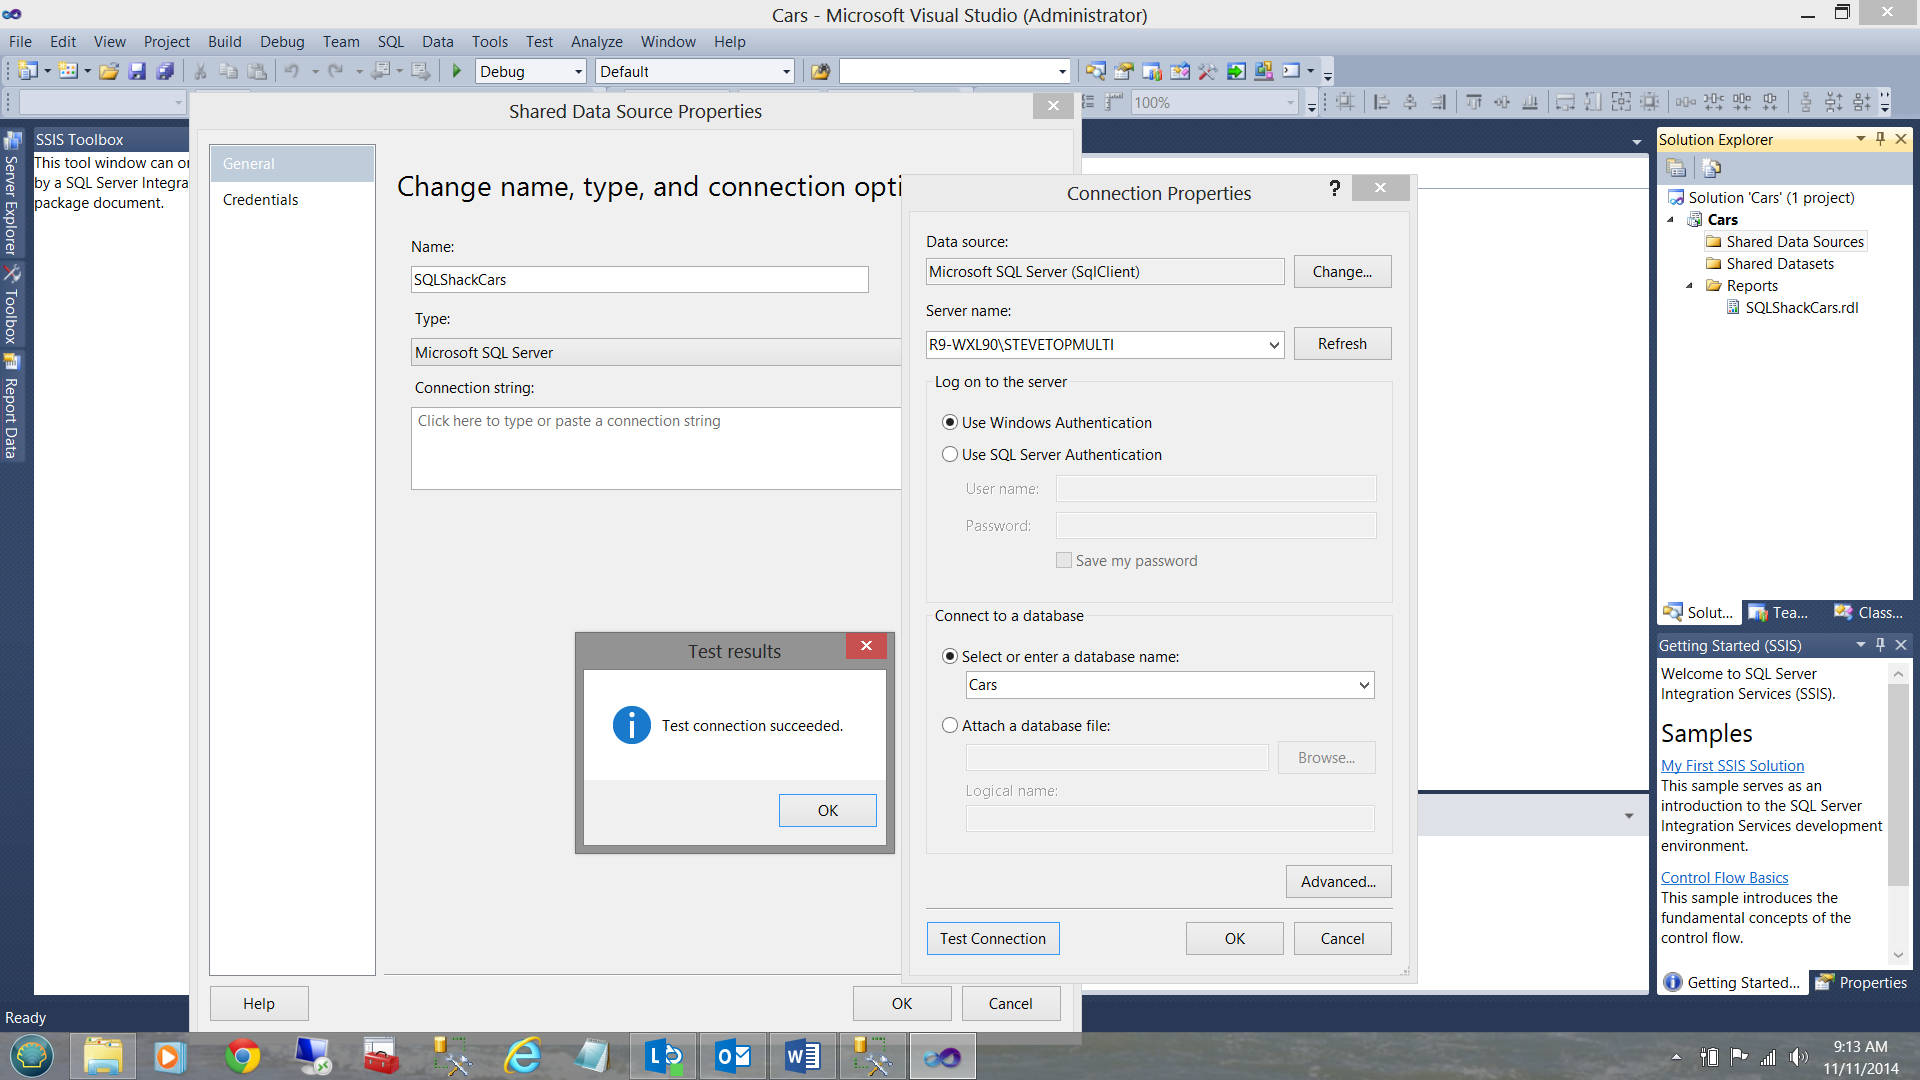
I have taken the liberty completing the name of the connection string and point the string to the correct SQL Server instance and database.
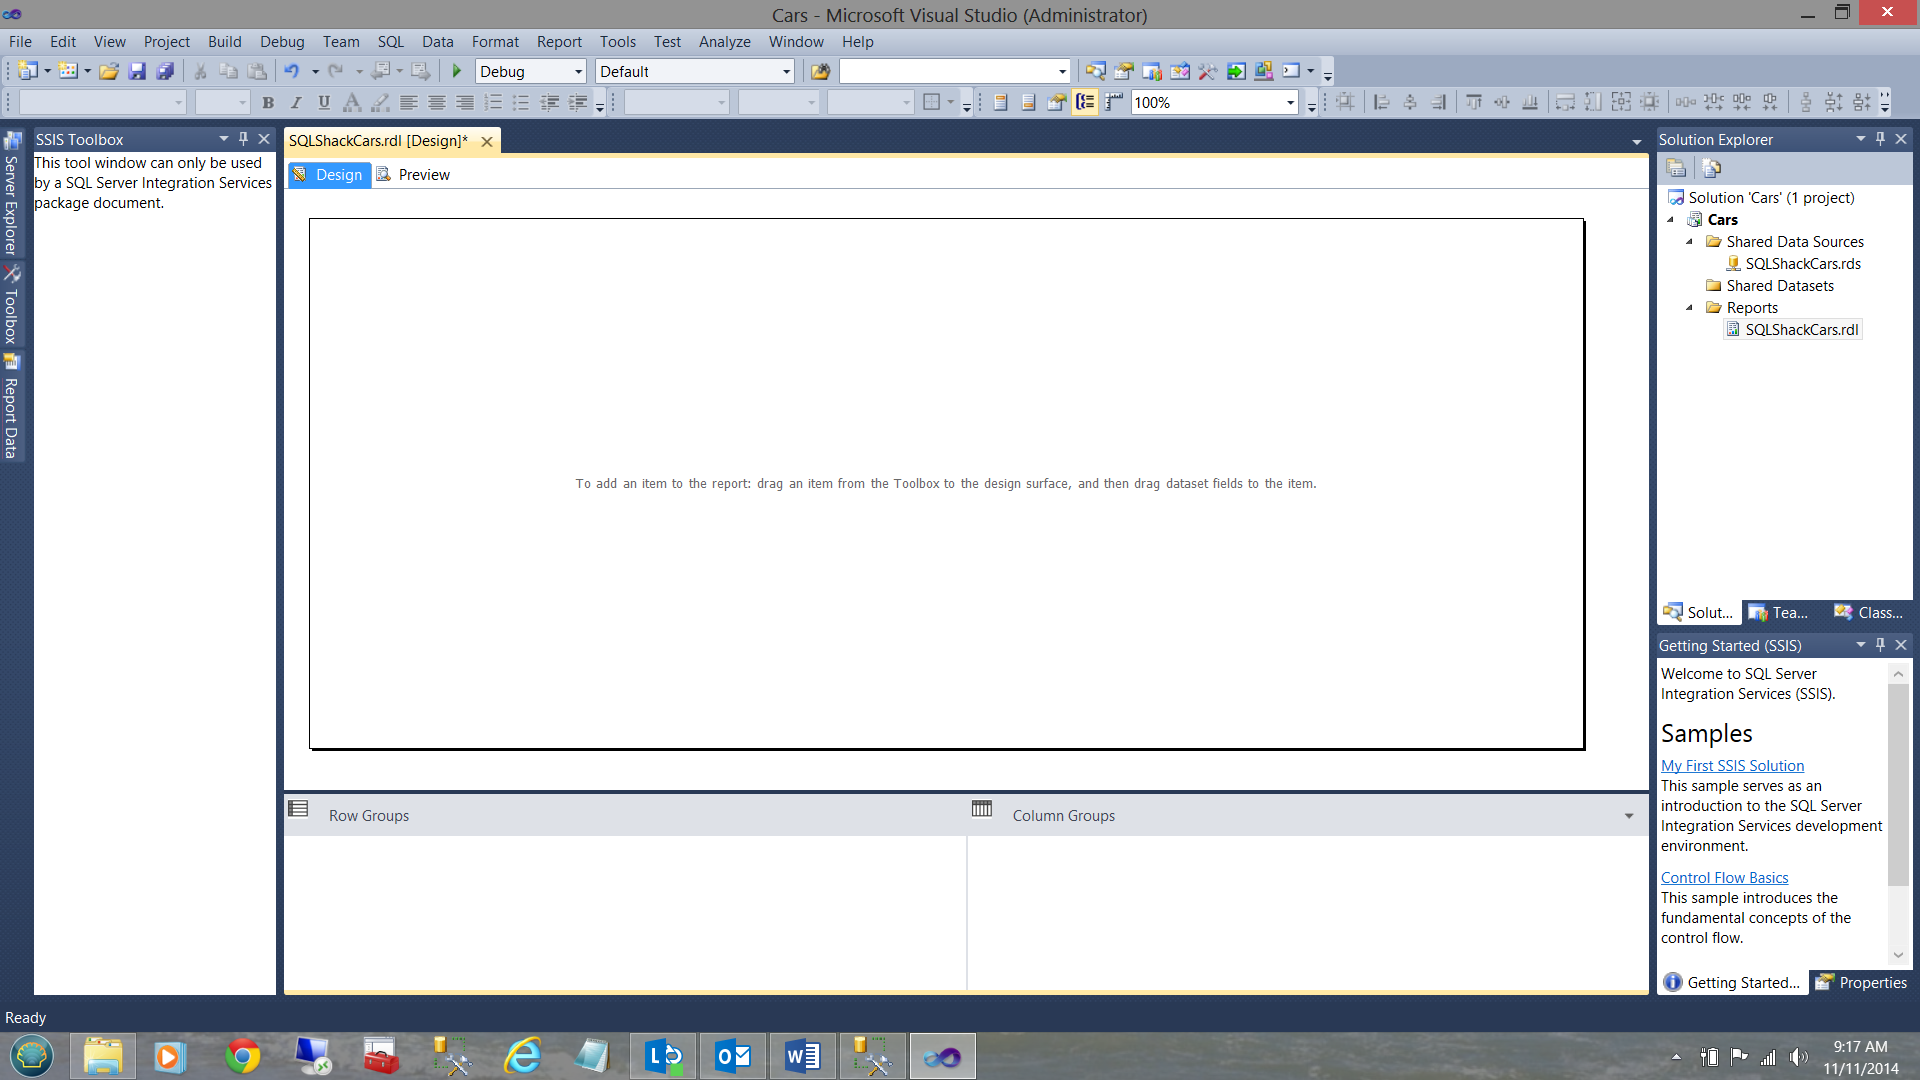
We are now ready to create our first report.
I first want to increase the size of our drawing surface (see below).
Setting our report parameters (Color, Number of Doors, Make)
As we want our report to be a flexible as possible, we must create a few ‘user selection’ parameters. These parameters will permit the user to pass ‘desired’ criteria to a stored procedure that will utilize these criteria to pull the correct data from the database table(s) and return the data to the report. This data will then be reflected in a data matrix.
Creating our ‘Color’ parameter
In order to create a parameter, we must ensure that our ‘Report Data’ window is visible. Should yours not be visible, then simply click on the ‘View’ Tab of SSDT and the option to show the ‘Report Data’ window may be found there. My screen looks as follows:
I right click on the Parameters folder (in the upper left hand portion of the screen dump above) and choose ‘Add Parameter’.
The ‘Report Parameter Properties’ screen is then shown.
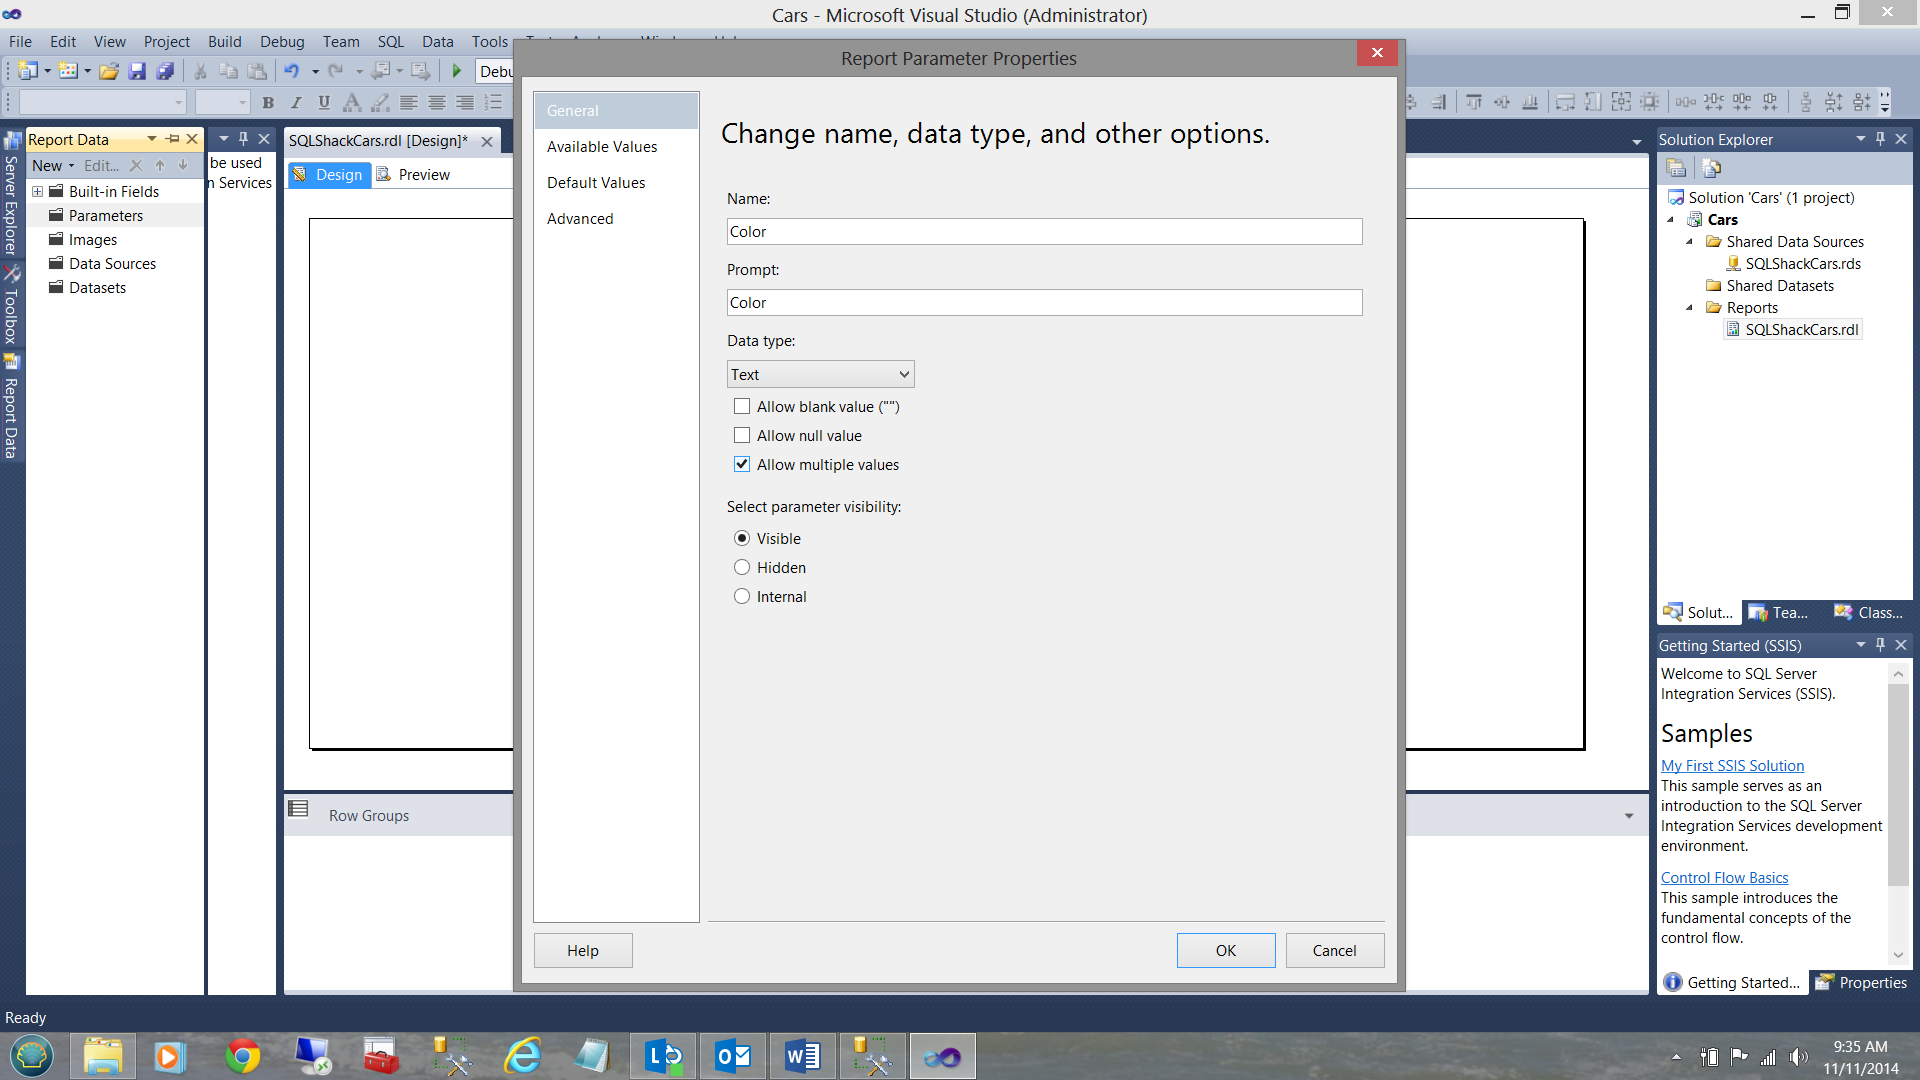
The astute reader will note that I have set the parameter name to ‘Color’, the prompt to ‘Color’, and more importantly the ‘Allow multiple values’ box has been checked.
For the time being I am just going to say ‘OK’ and close the parameter selection box. Fear not, we shall be returning to this parameter in a few minutes.
At this point in time your screen will appear as follows:
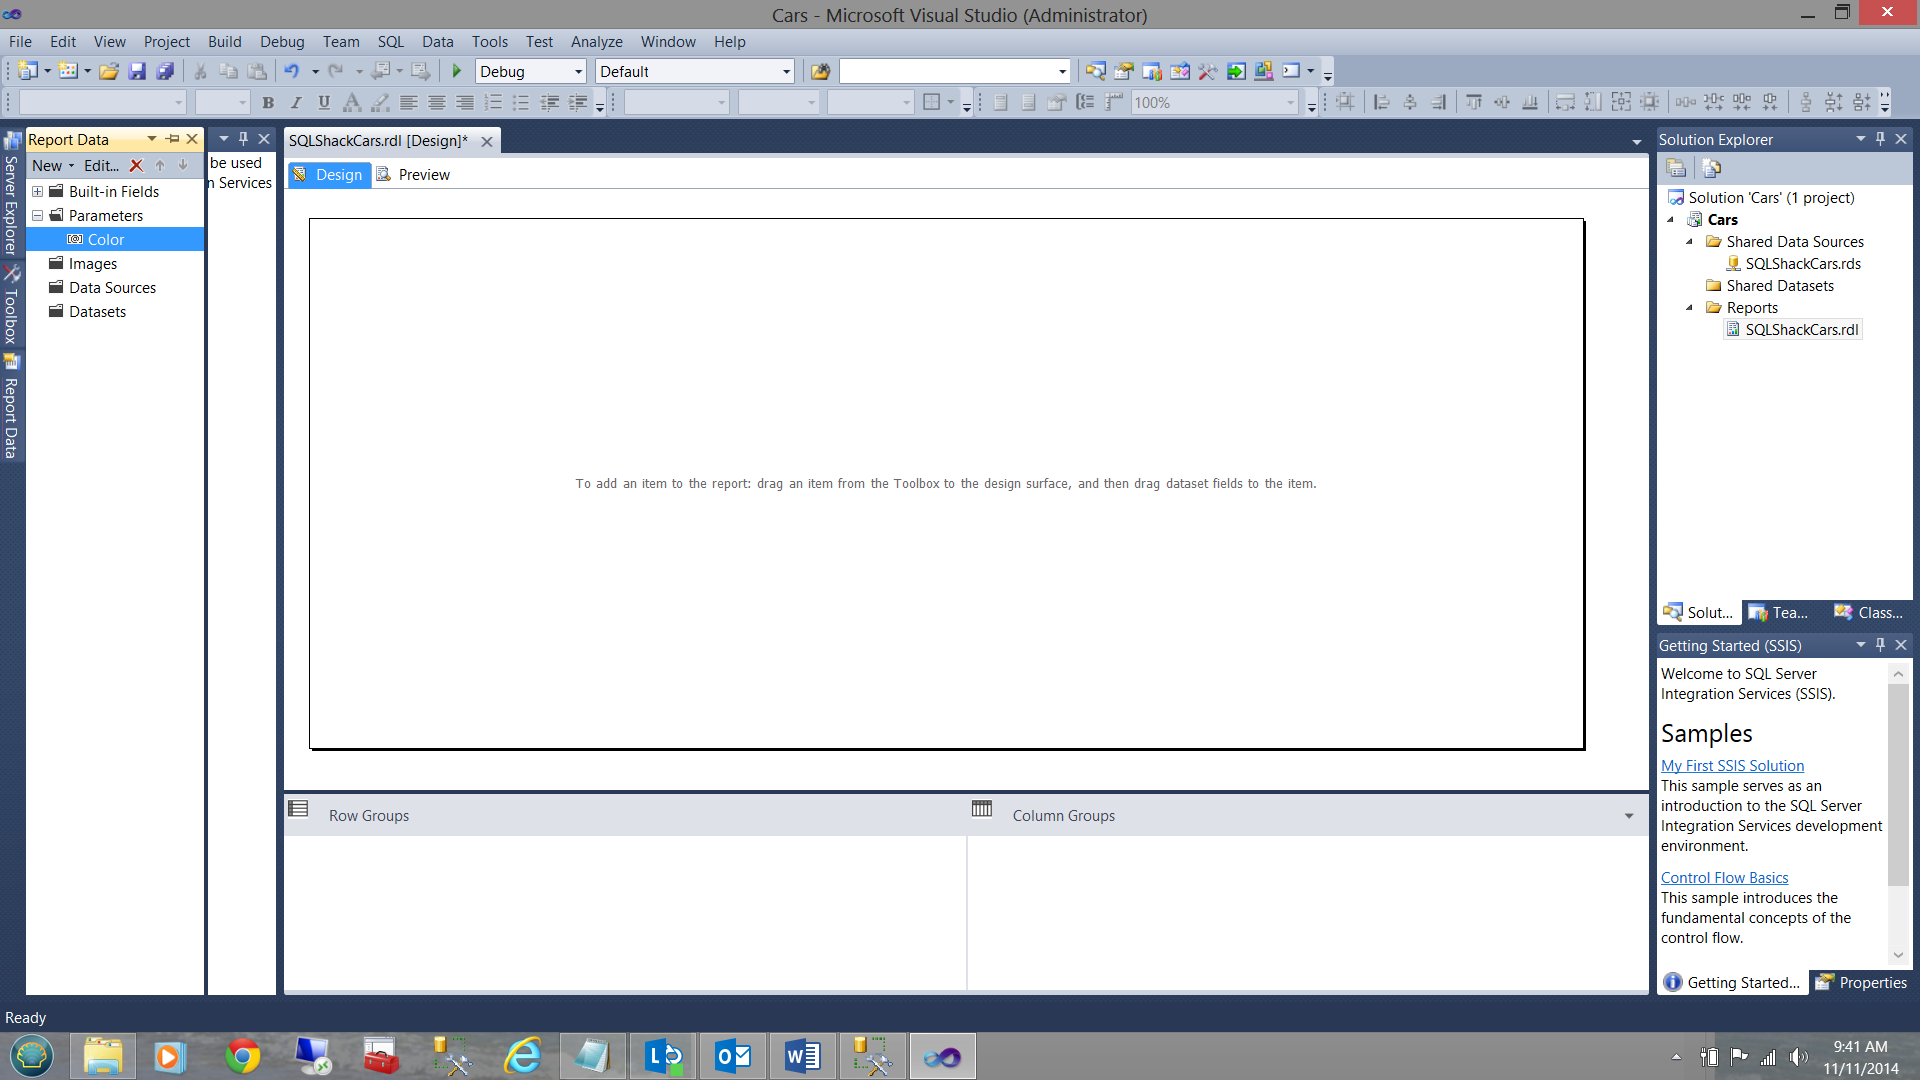
Note that we have created a ‘Color’ parameter which is highlighted in blue. It is left up to the reader to create the ‘Number of doors’ and the ‘Make’ parameters. They will be created in a similar manner as described above.
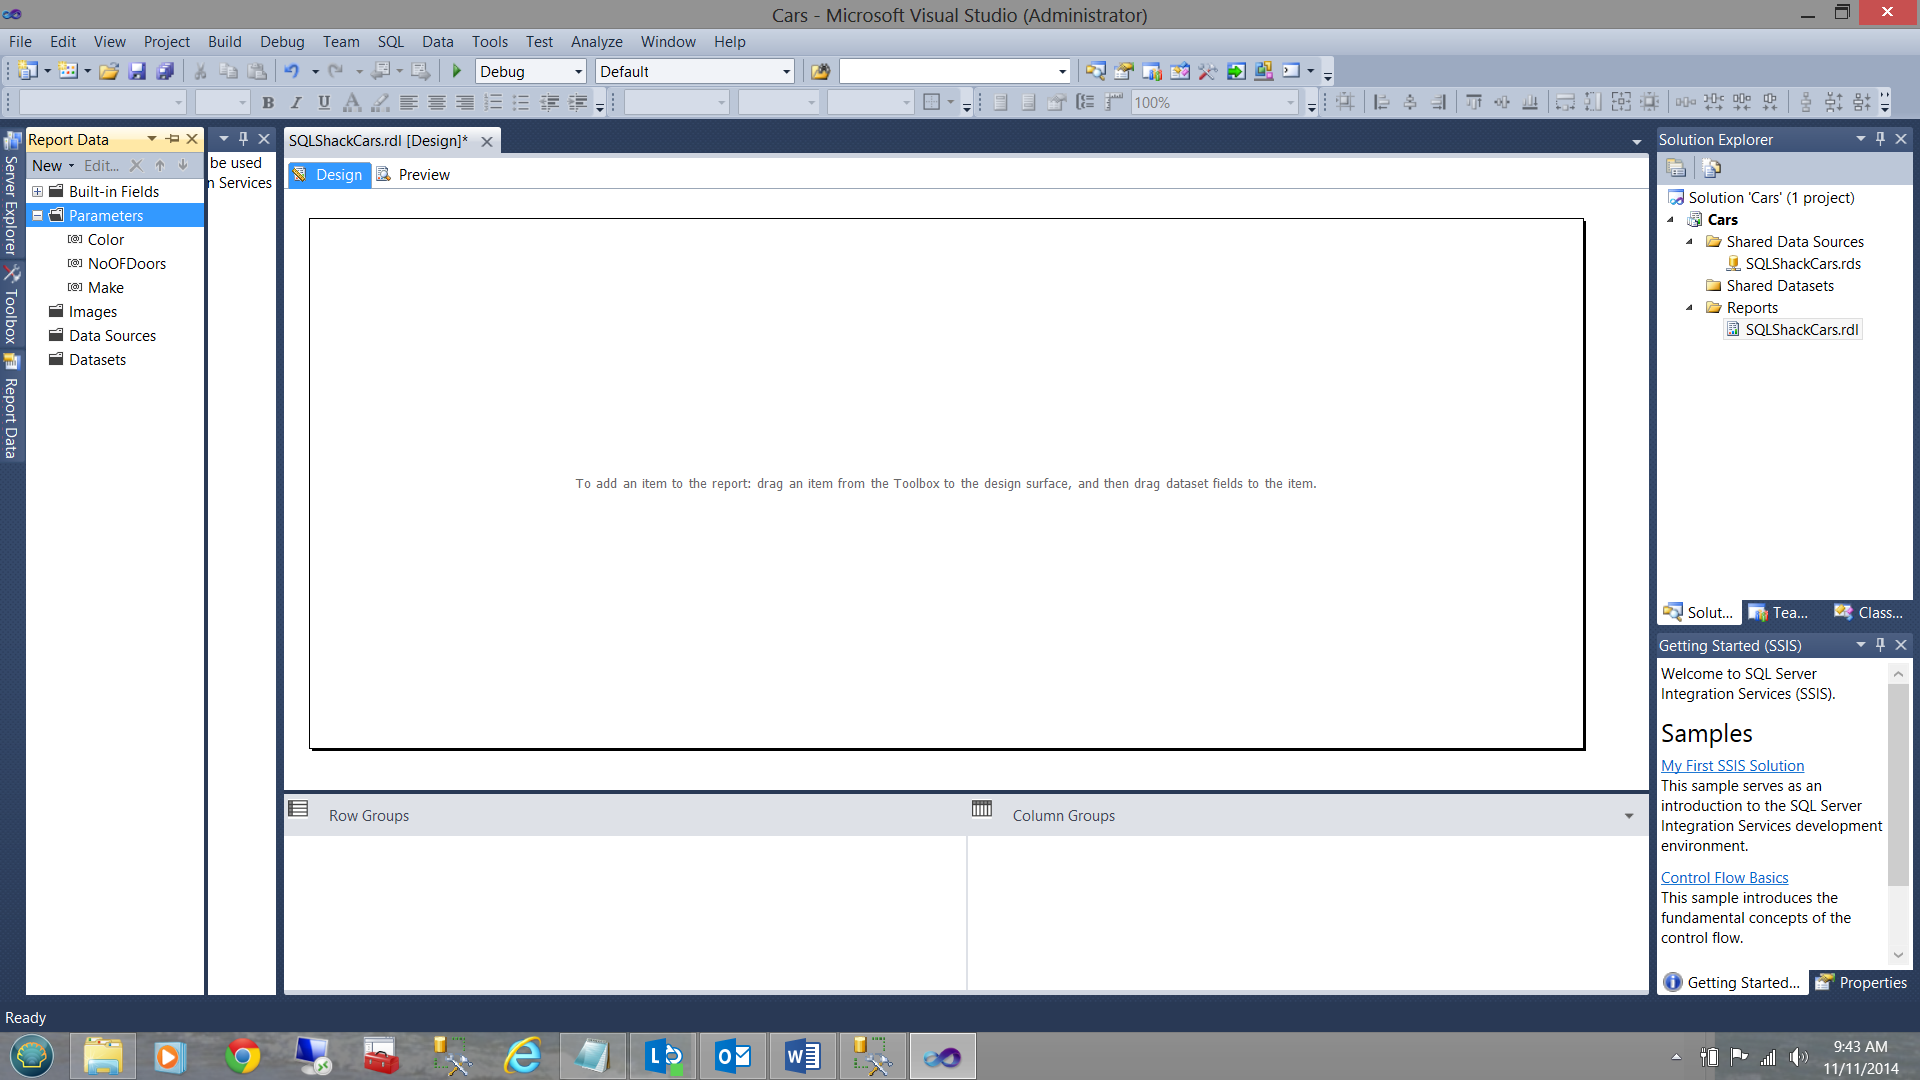
Our final parameters may be seen on the screen dump immediately below.
Creating our Datasets
When our data flows from the ‘house water tap’ through the connection ‘hose’, it must be placed in a ‘bucket’ that will be used when required by our report. This bucket is called a dataset.
The datasets that we shall be creating, will provide the parameters (that we have just created) with a complete list of colors, makes and number of doors that exist within our database table.
Creating the color dataset
To create our dataset we right click on the ‘Datasets’ folder and the following screen is brought up.
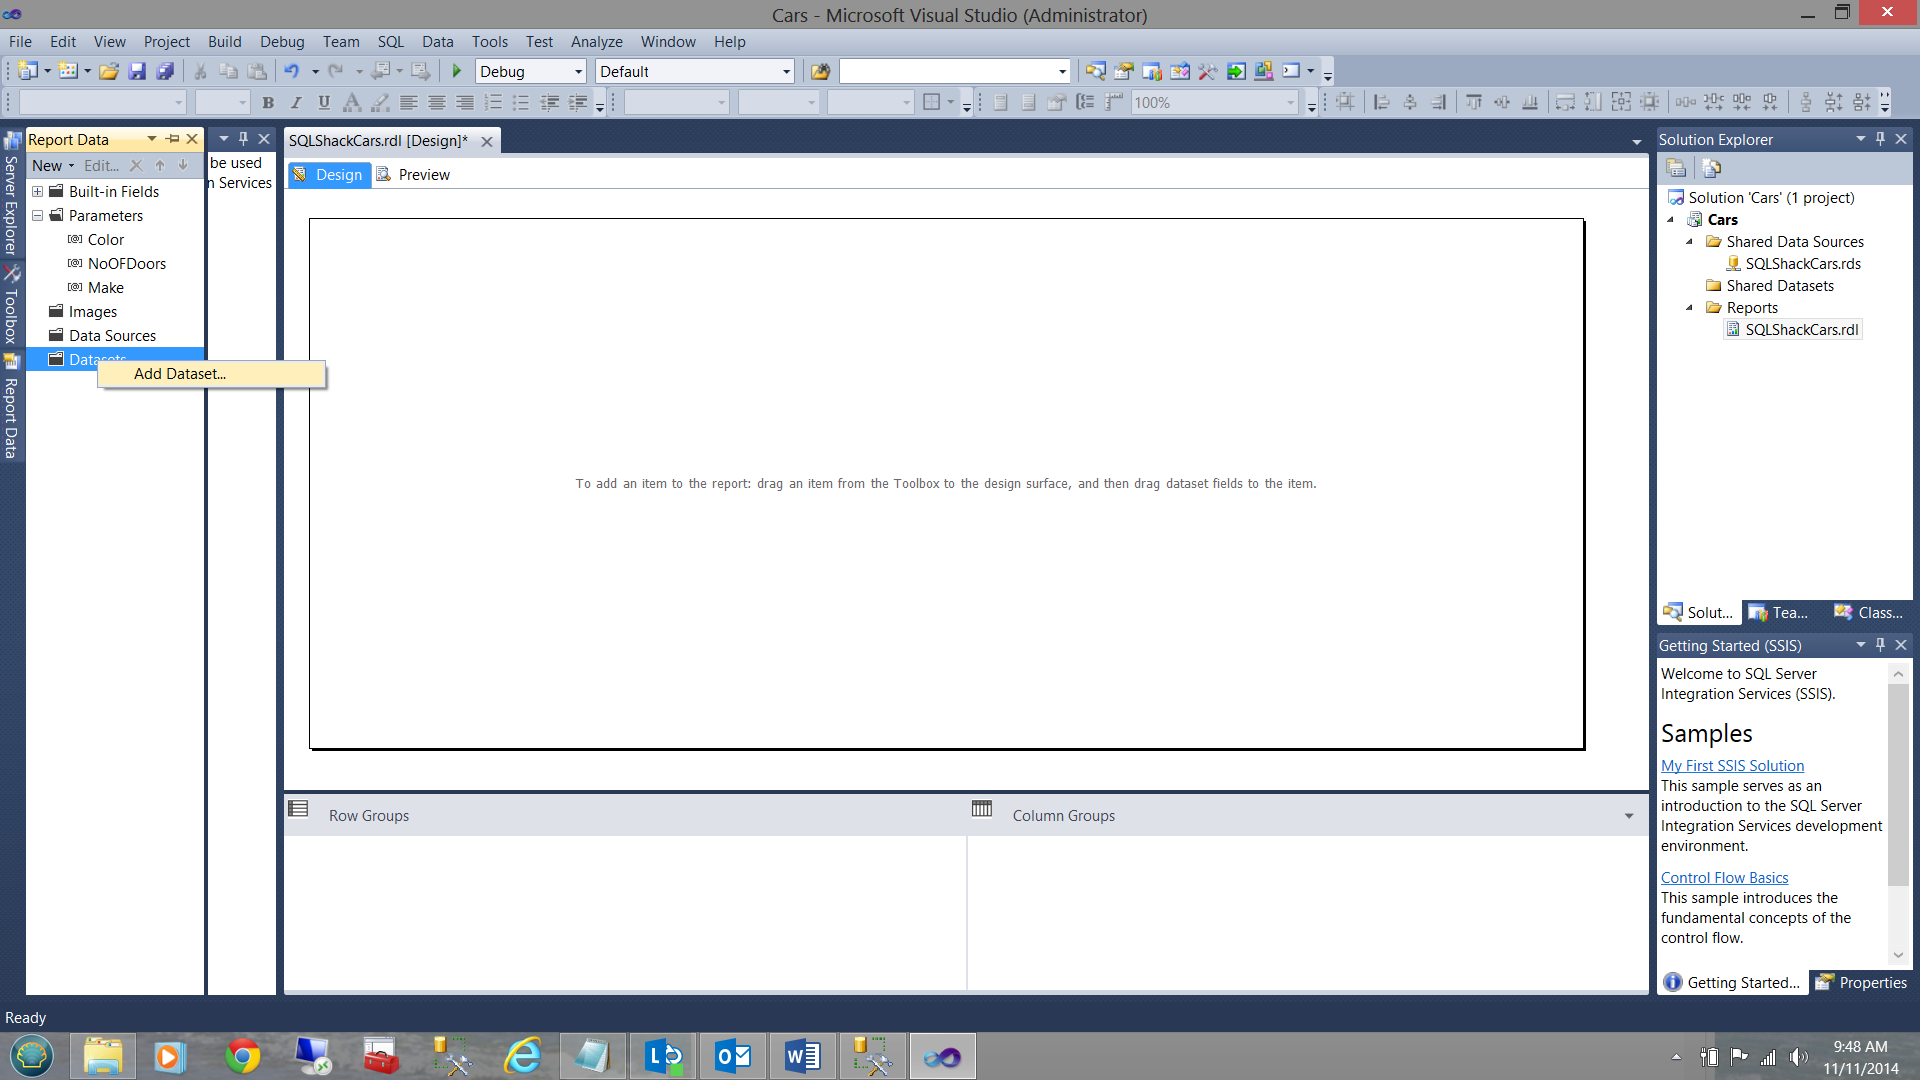
We now click on ‘Add dataset’. Our next data entry screen is then displayed.
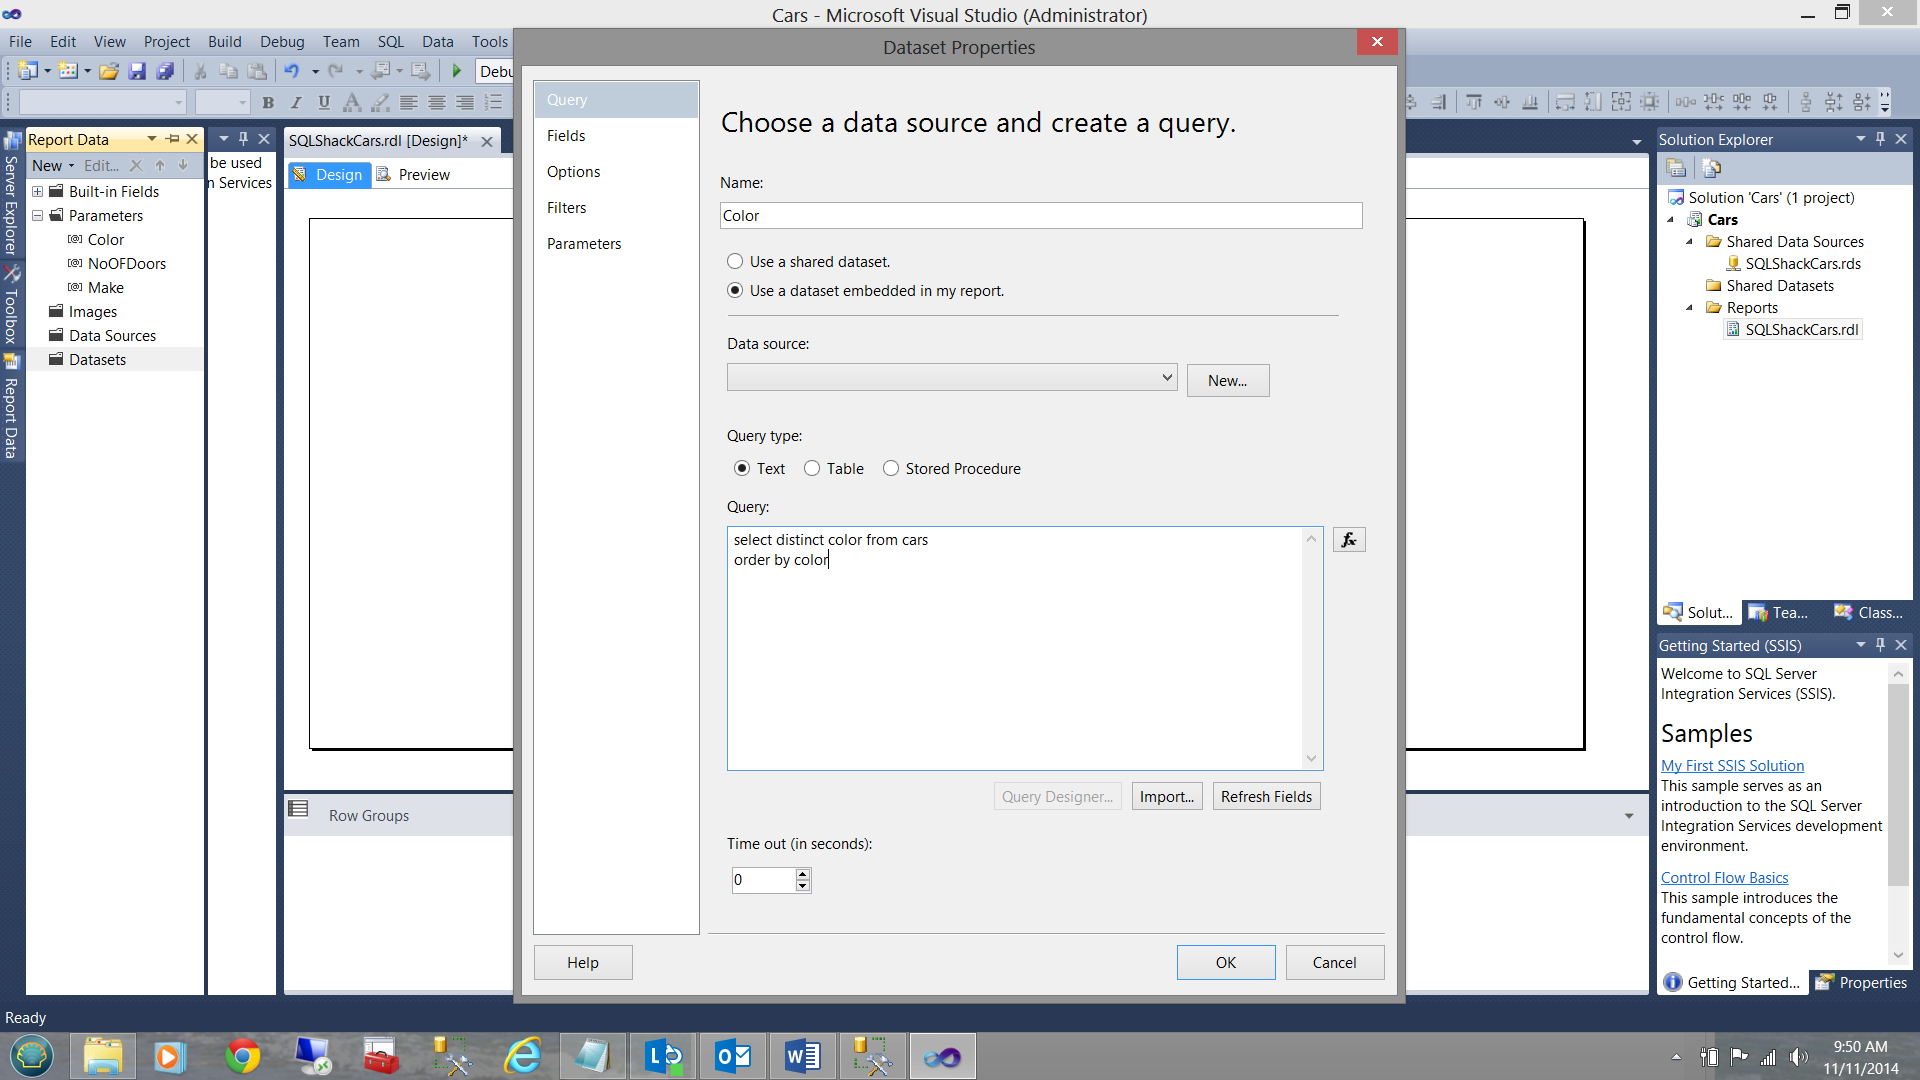
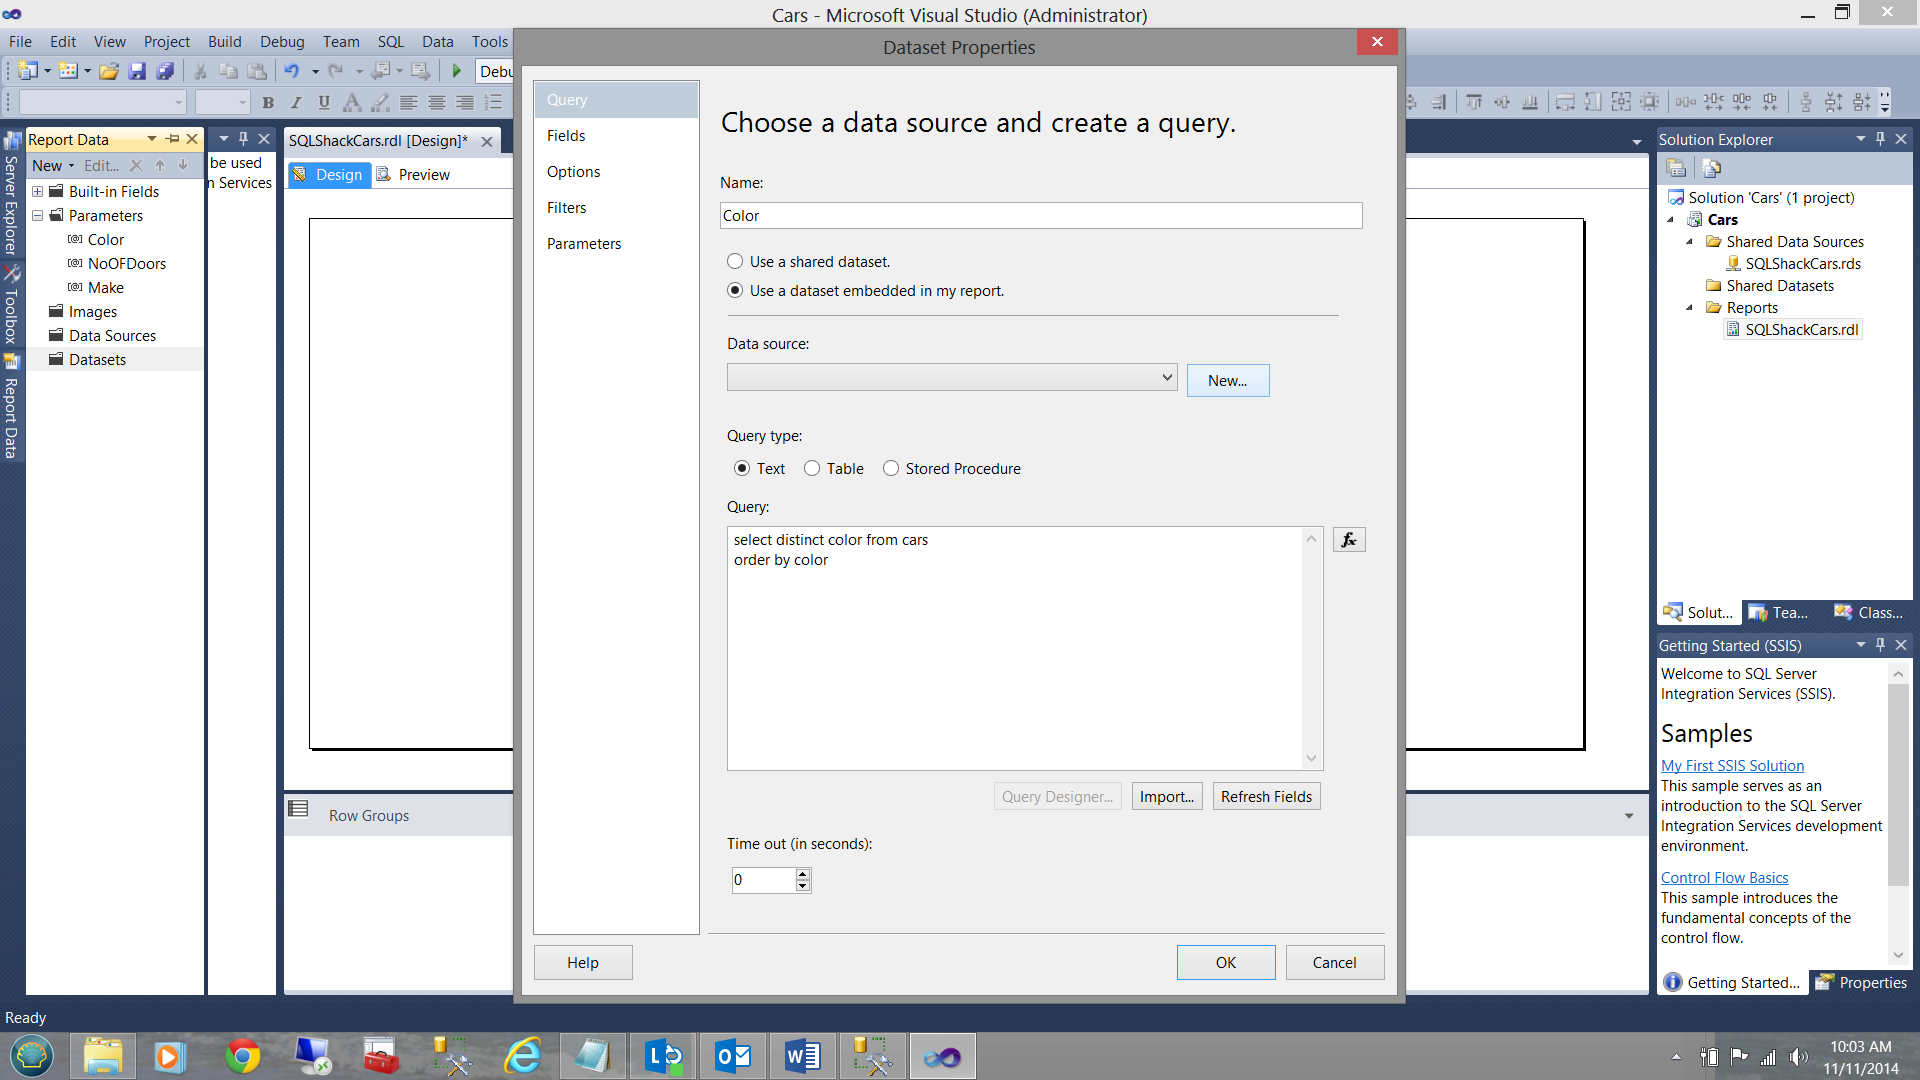
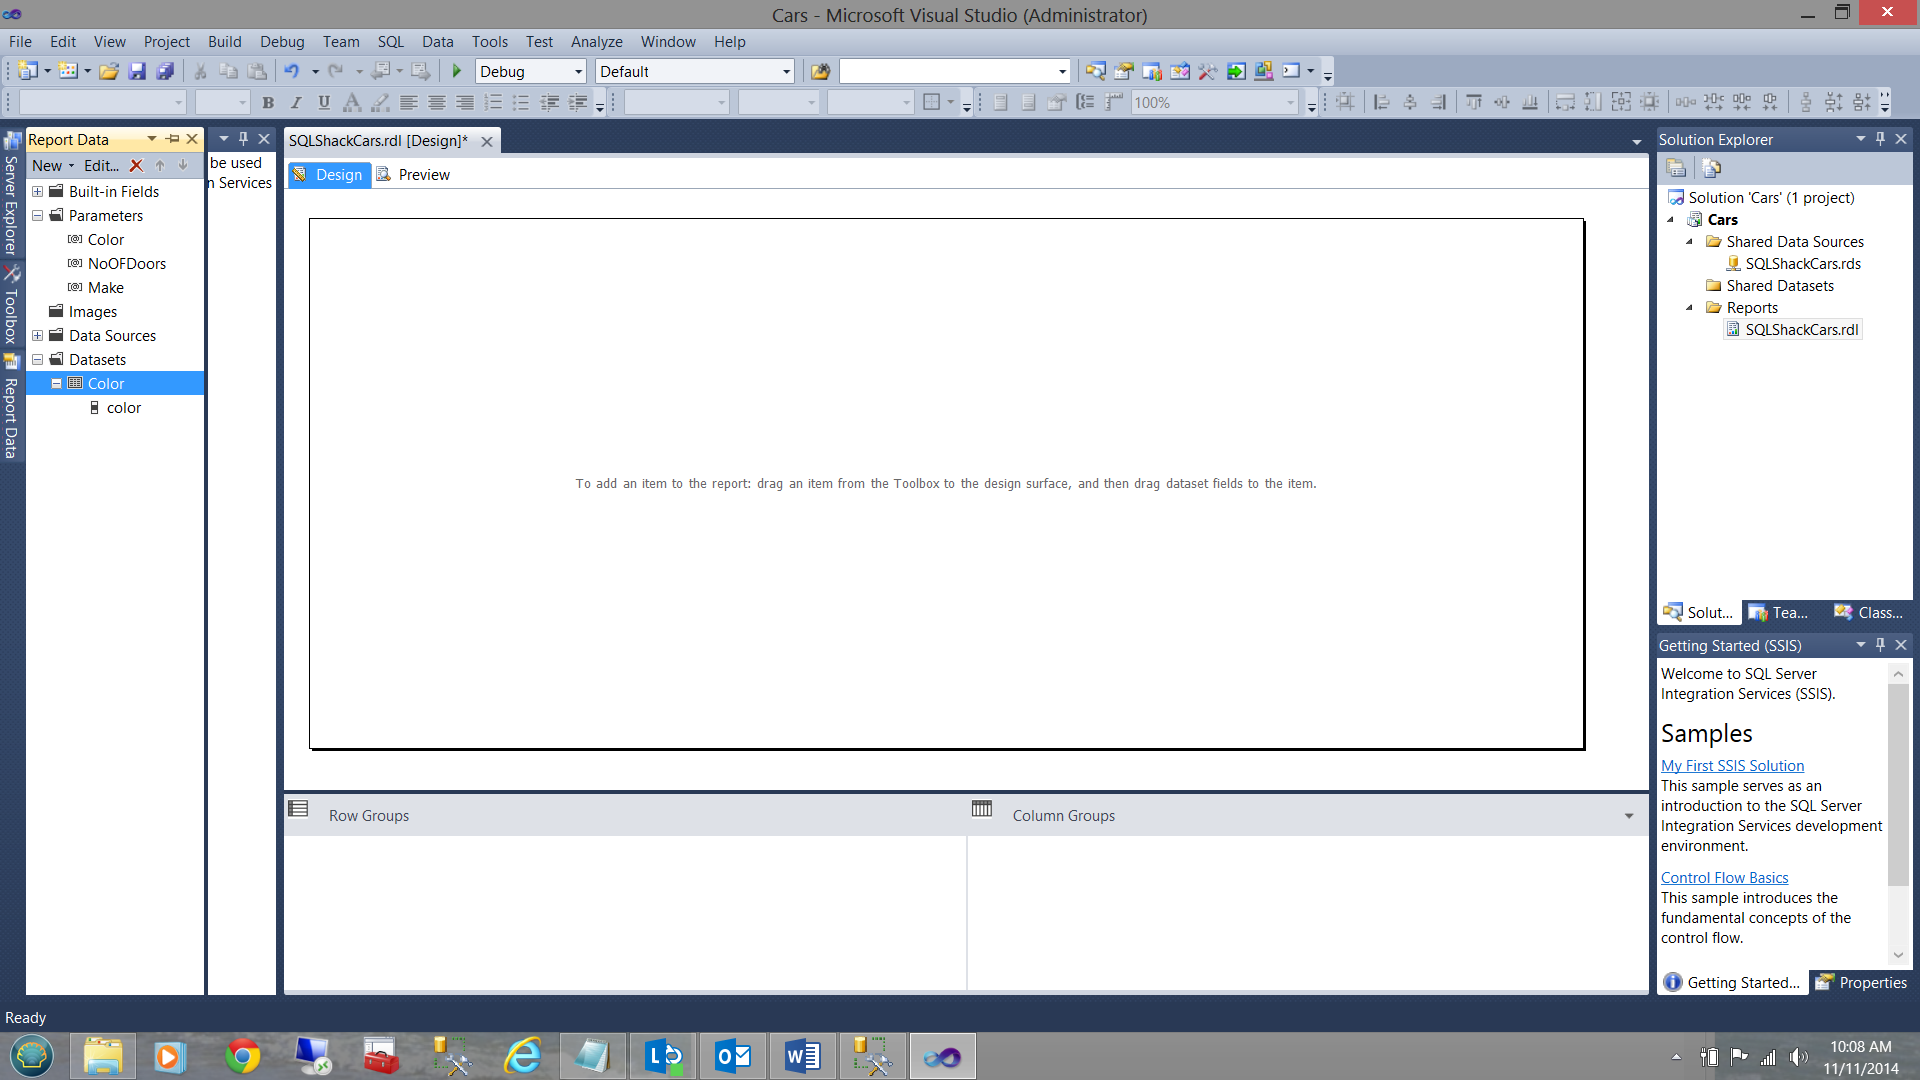
We now give our dataset the name ‘Color’ and select the ‘Use a dataset embedded in my report’ radio button. In my case I chose to enter a simple SQL statement to pull all the colors that we have available (within the ‘cars’ table). Note that not all cars come in all colors nor do all makes have all the ‘number of doors’ that may be selected. I am merely trying to pull all possible combinations to have them available for the end user, knowing that some selections may return an empty dataset.
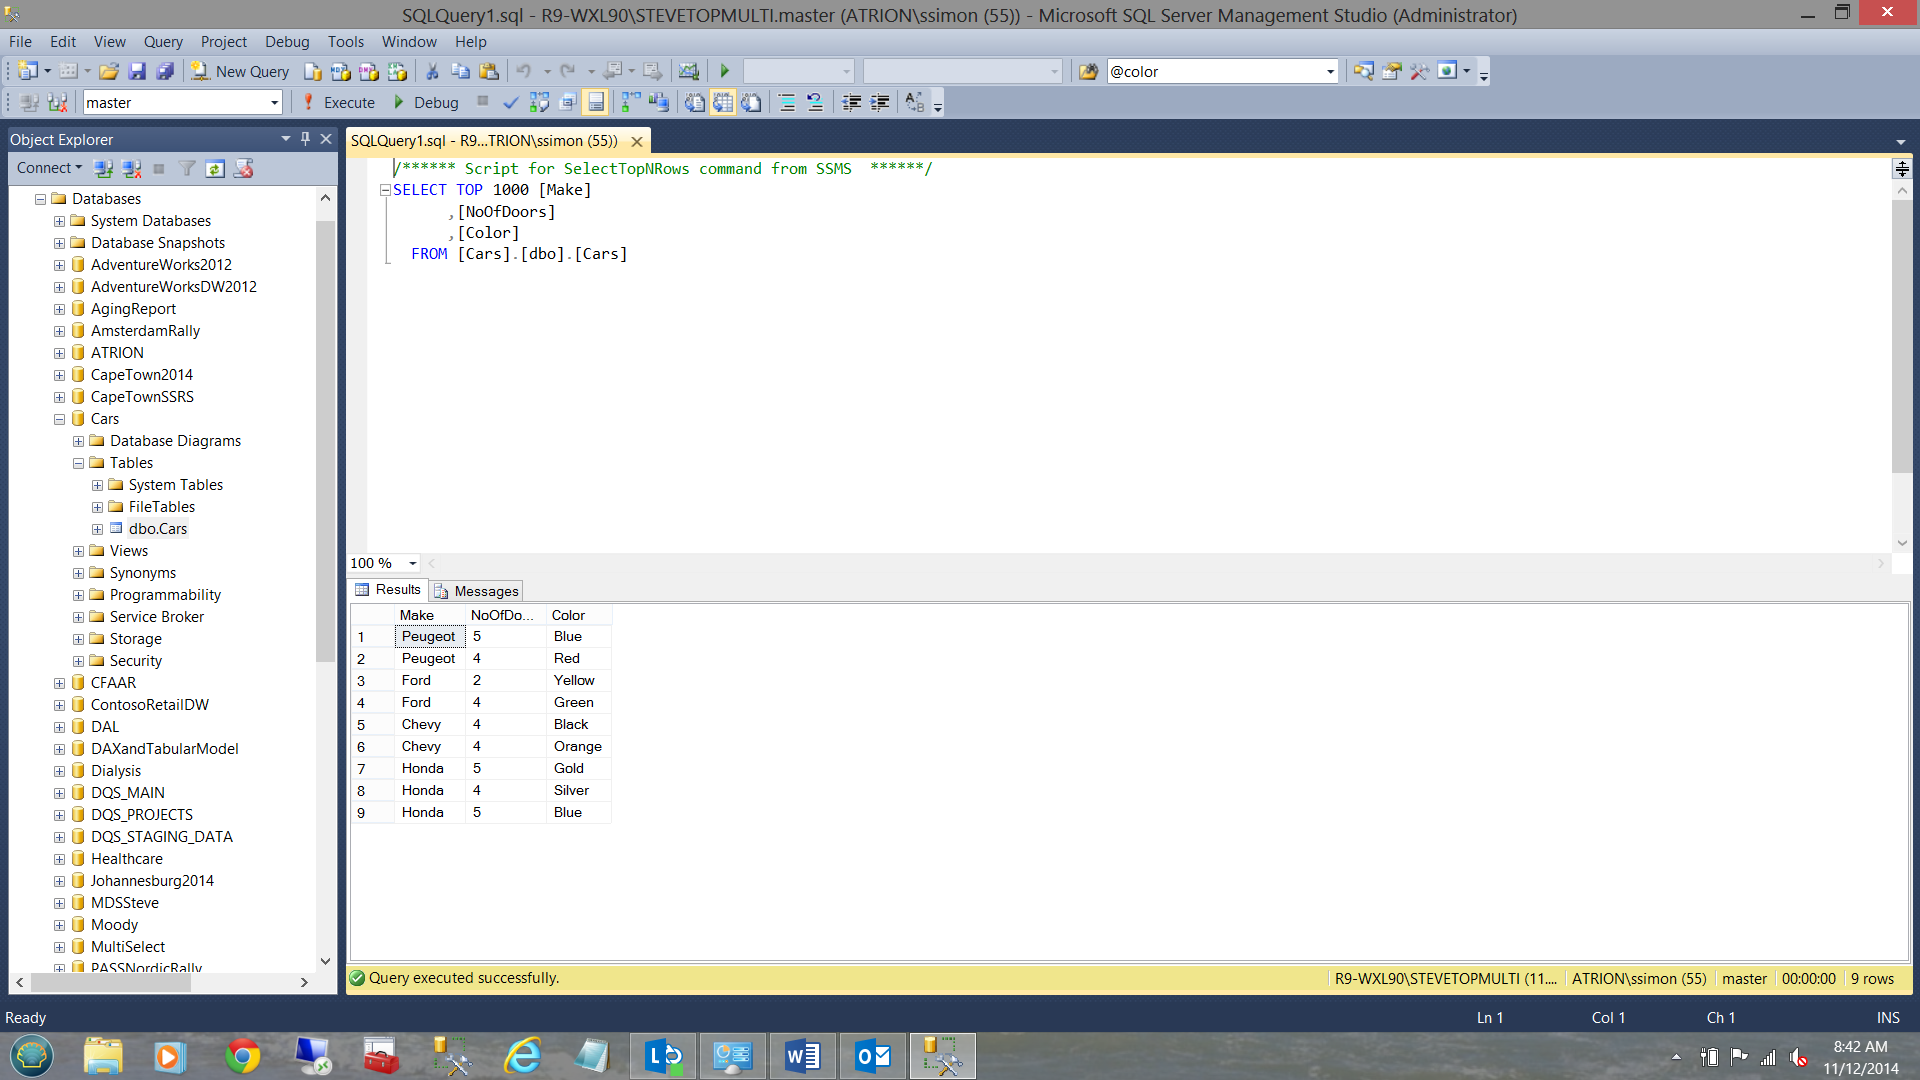
The contents of the Cars table may be seen immediately below.
Creating the LOCAL data source that will call for the data via its ‘Mother’, our global data source ‘SQLShackCars’ (within the dataset tab)
In order to obtain the necessary data we must now create a local data source which will communicate with the global data source which will pull the necessary data from the table.
Simply click on the ‘New’ tab shown above and the ‘Data source’ dialog box will open.
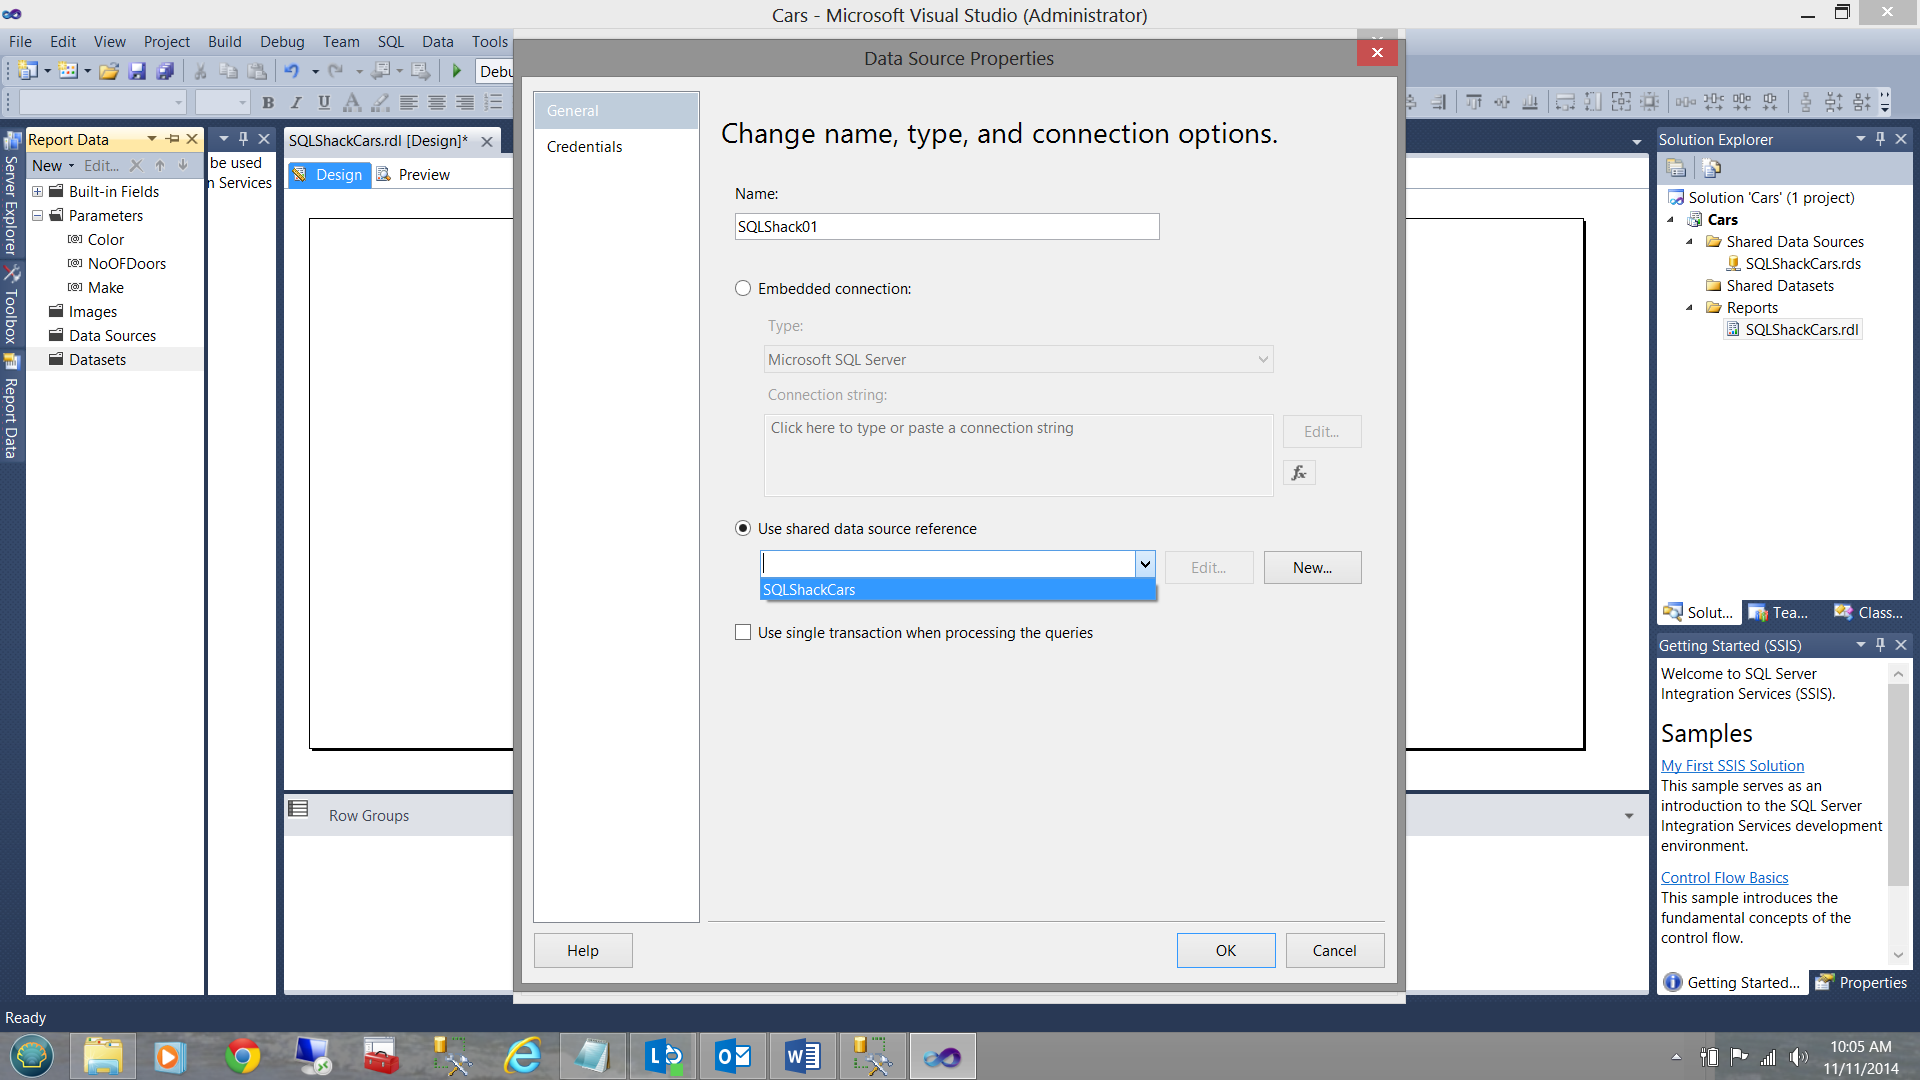
I have once again taken the liberty of completing the necessary data fields. I called the local data source ‘SQLShack01’. I then selected the ‘Use shared data source reference’ tab and I selected our ‘SQLShackCars’ global data source.
I click OK, and OK to close out.
We can see our finished dataset in the screen dump below:
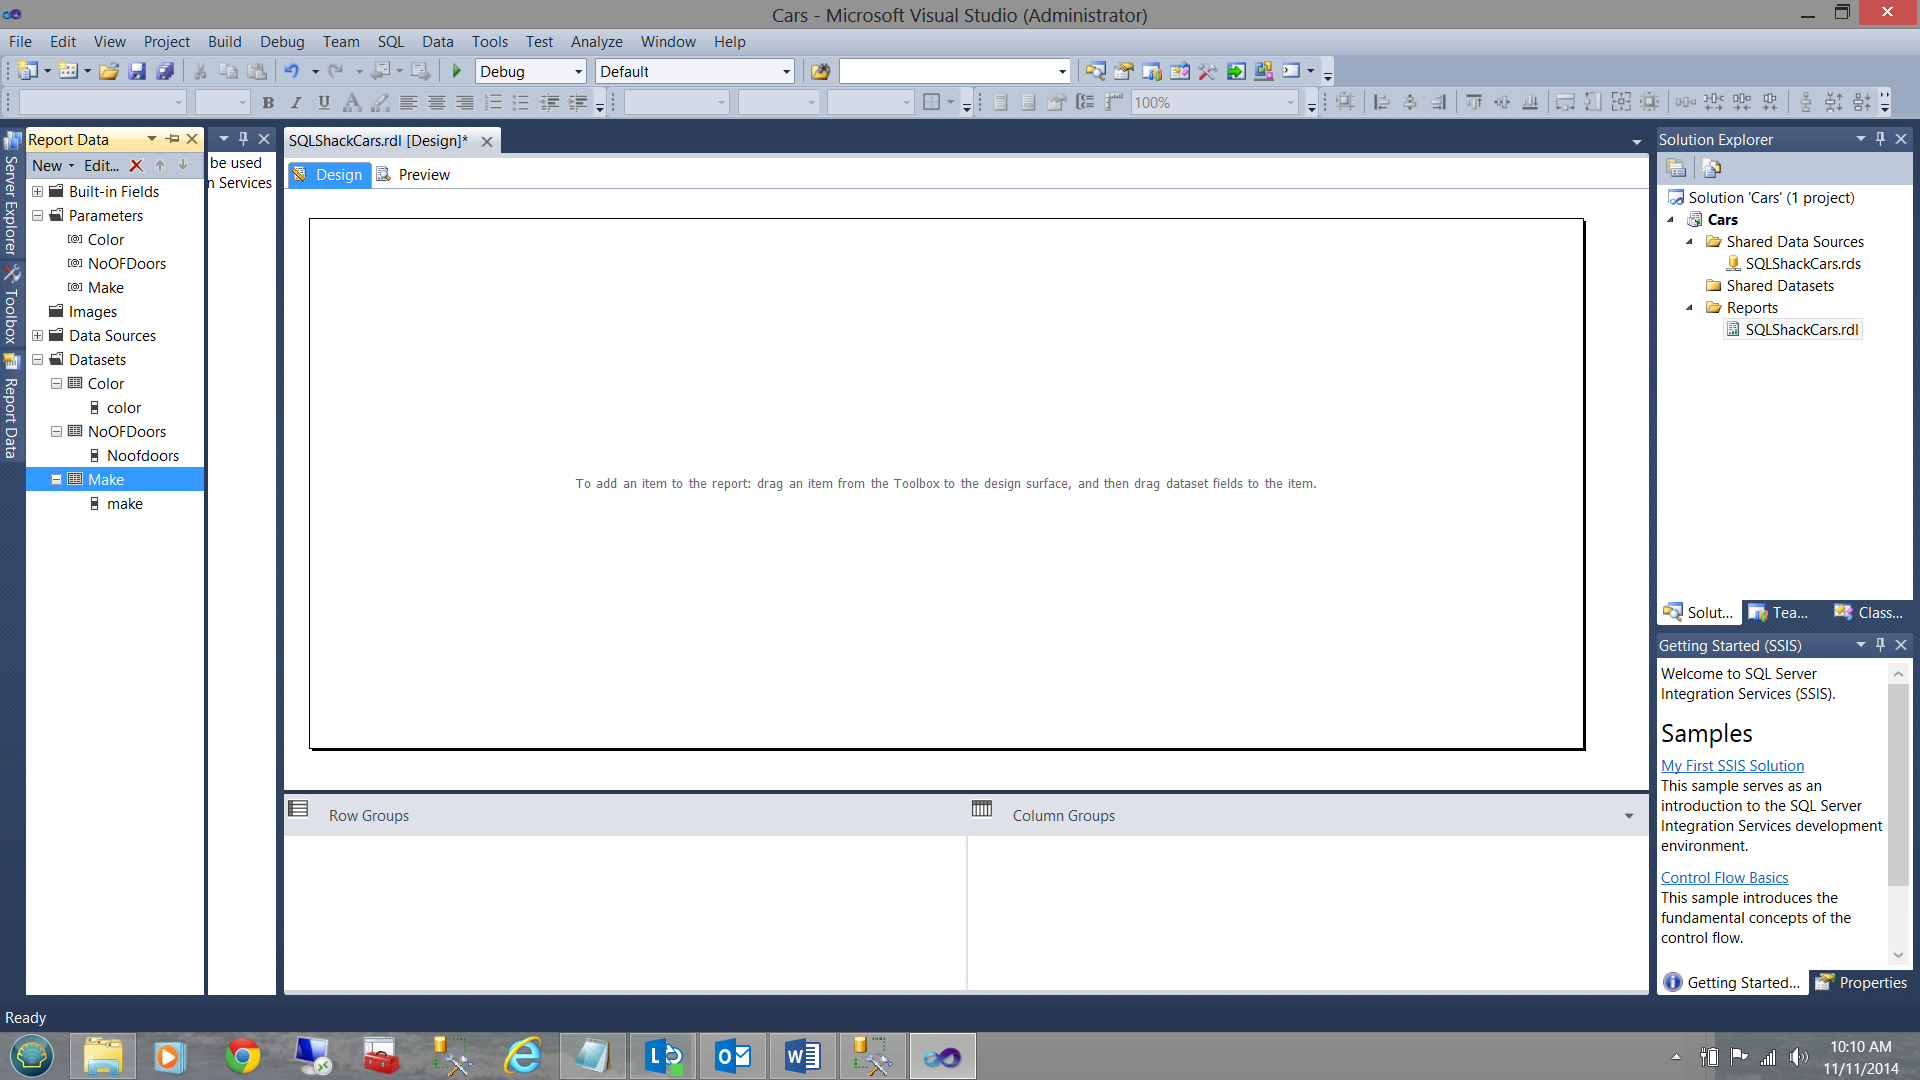
In a similar manner we may create the ‘Number of doors’ and the ‘Make’ datasets UTILIZING the local data source (SQLShack01) that we just created above. This is left to the reader HOWEVER when you do go to create these datasets, you will find that the local data source (SQLShack01) is NOW available for you to use.
Our workspace with the three datasets may be seen below:
Populating our parameter drop down lists
Returning to our ‘Color’ parameter, I double click on the ‘word’ Color and the parameter dialog box is displayed once again.
This time however I select the ‘Available Values’ tab.
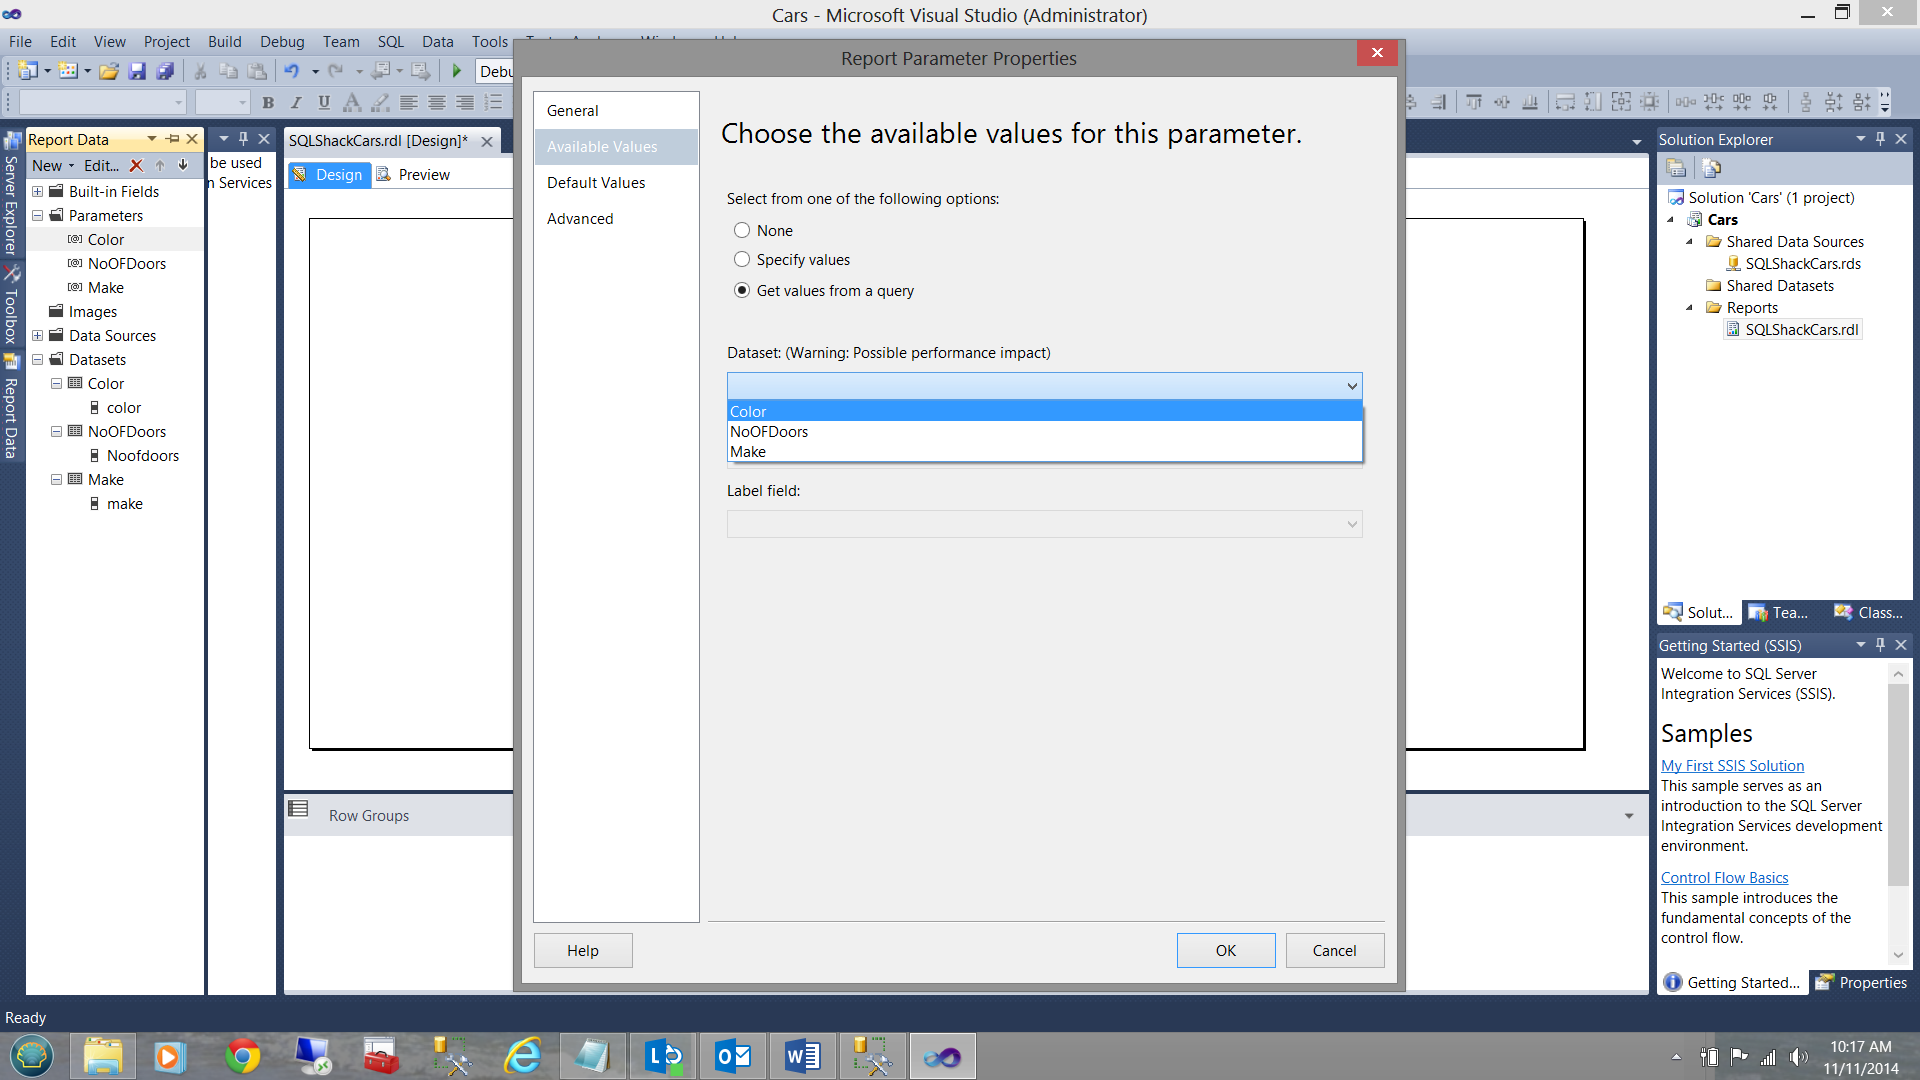
Note that I have opted for the ‘Get values from a query’ radio button. By opening the ‘Dataset’ tab we note that the three datasets that we created in the steps above are present. Merely select ‘Color’.
Having selected ‘Color’ we can finalize our setup as shown below:
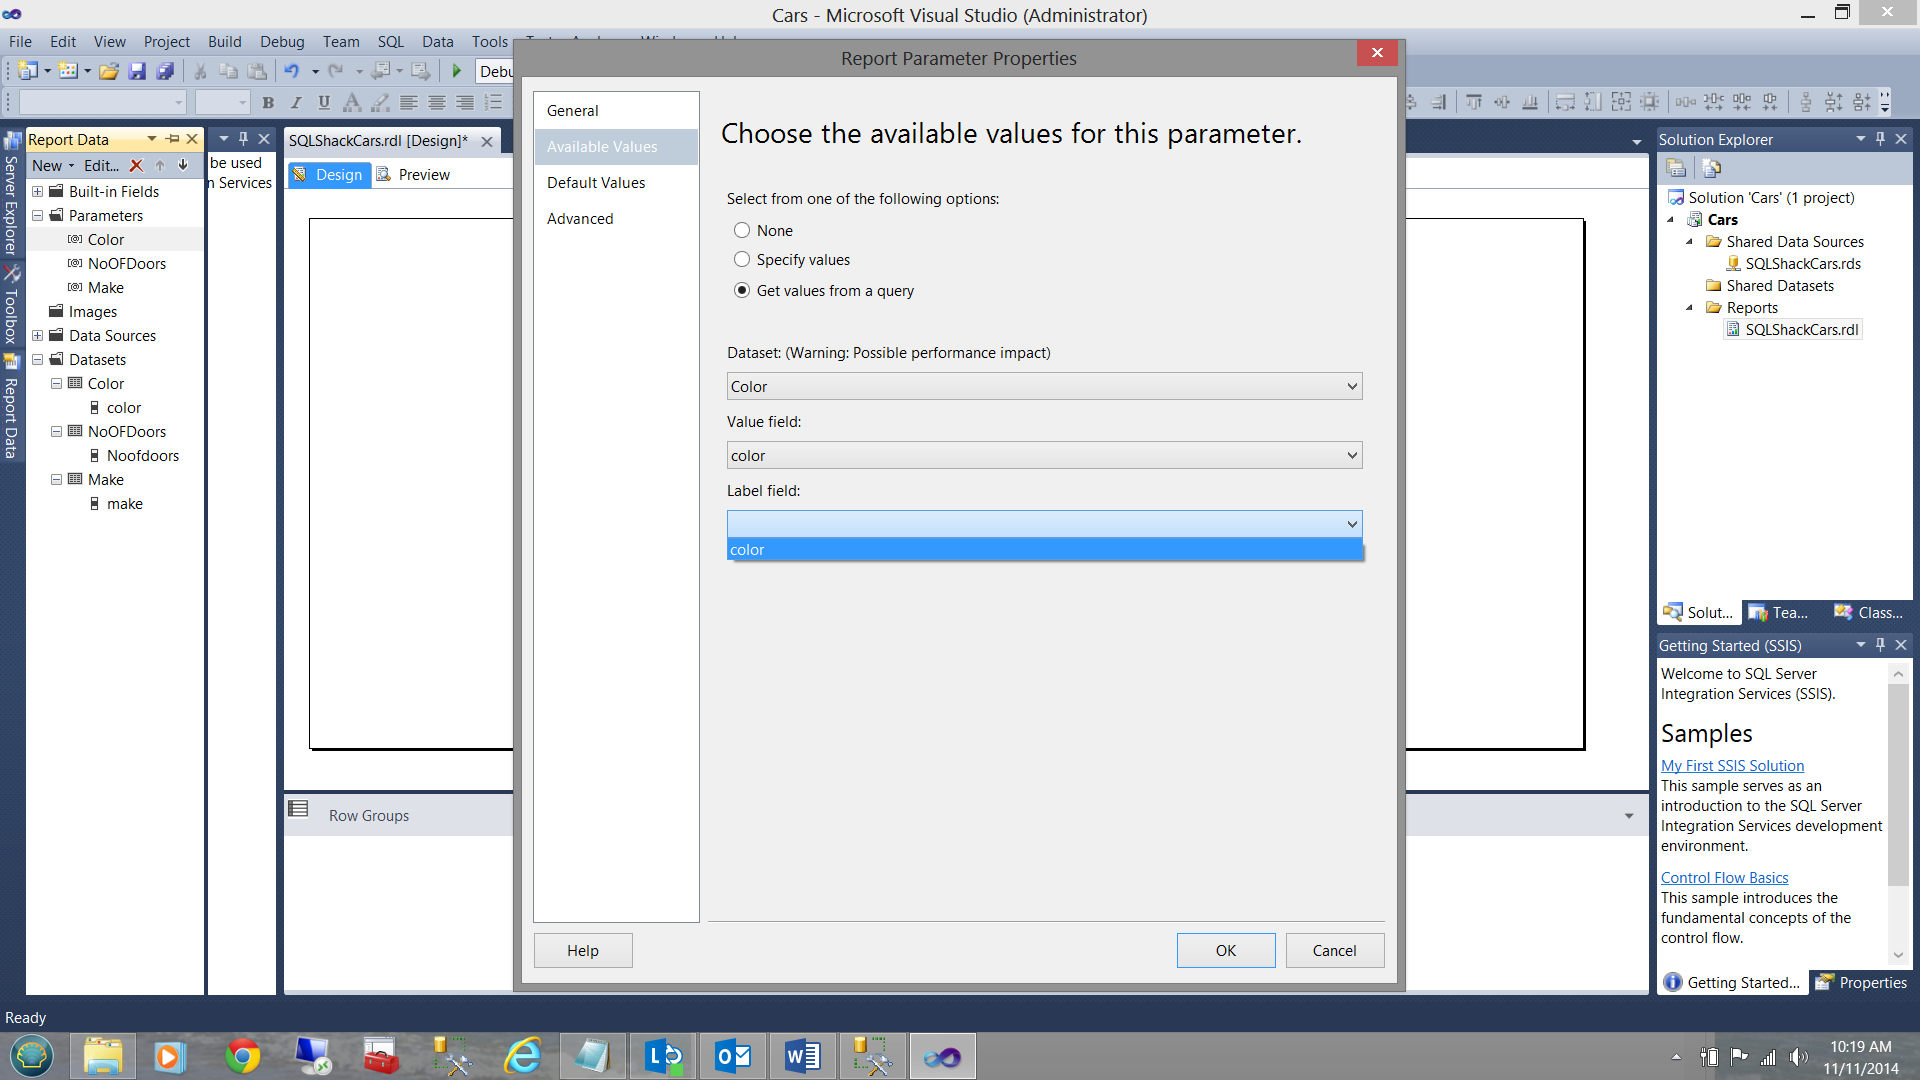
The reader will note that I have selected Color for the ‘Label’ field and for the ‘Value’ field. I now click OK to accept and leave the parameter set up properties dialog.
It is left up to the reader to configure the ‘Number of doors’ and ‘Make’ parameters in the same manner as just described.
Taking it for a ‘test drive’
Alright, let us have a quick look at what we have thus far.
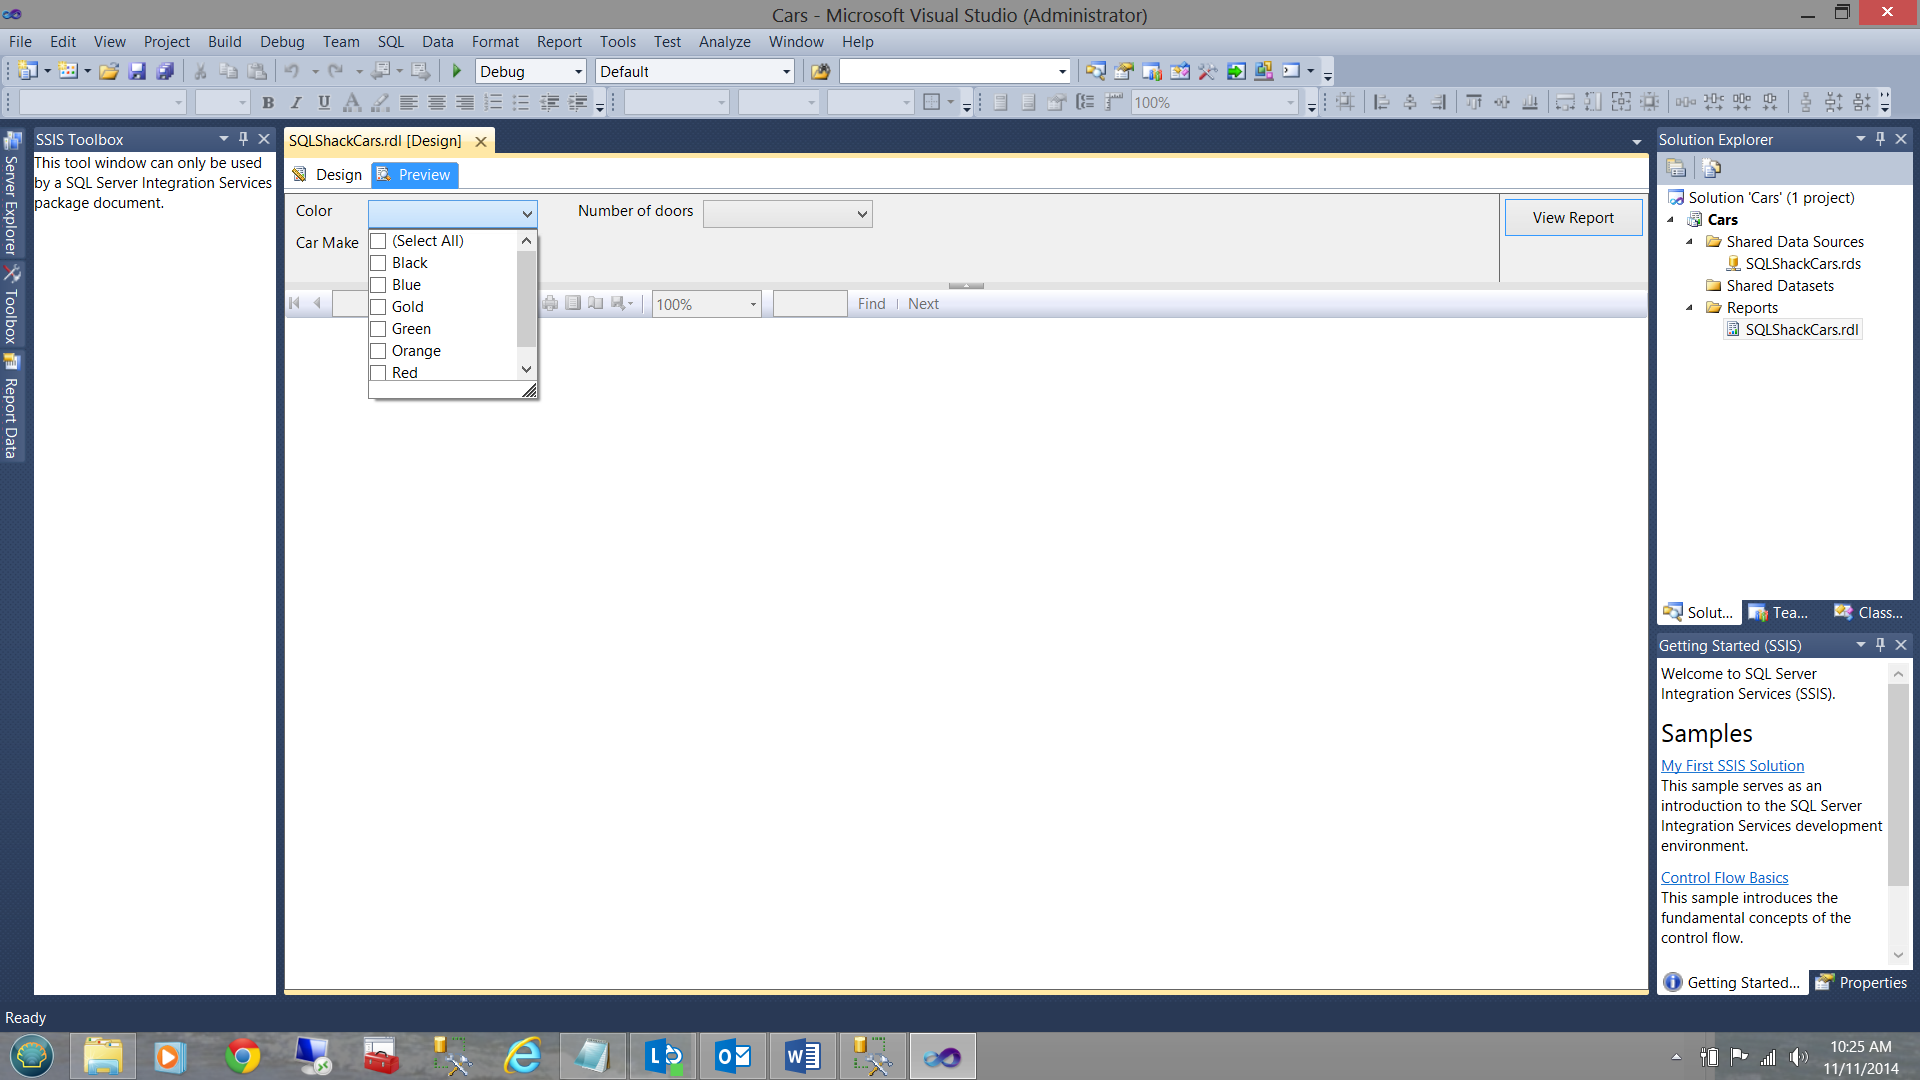
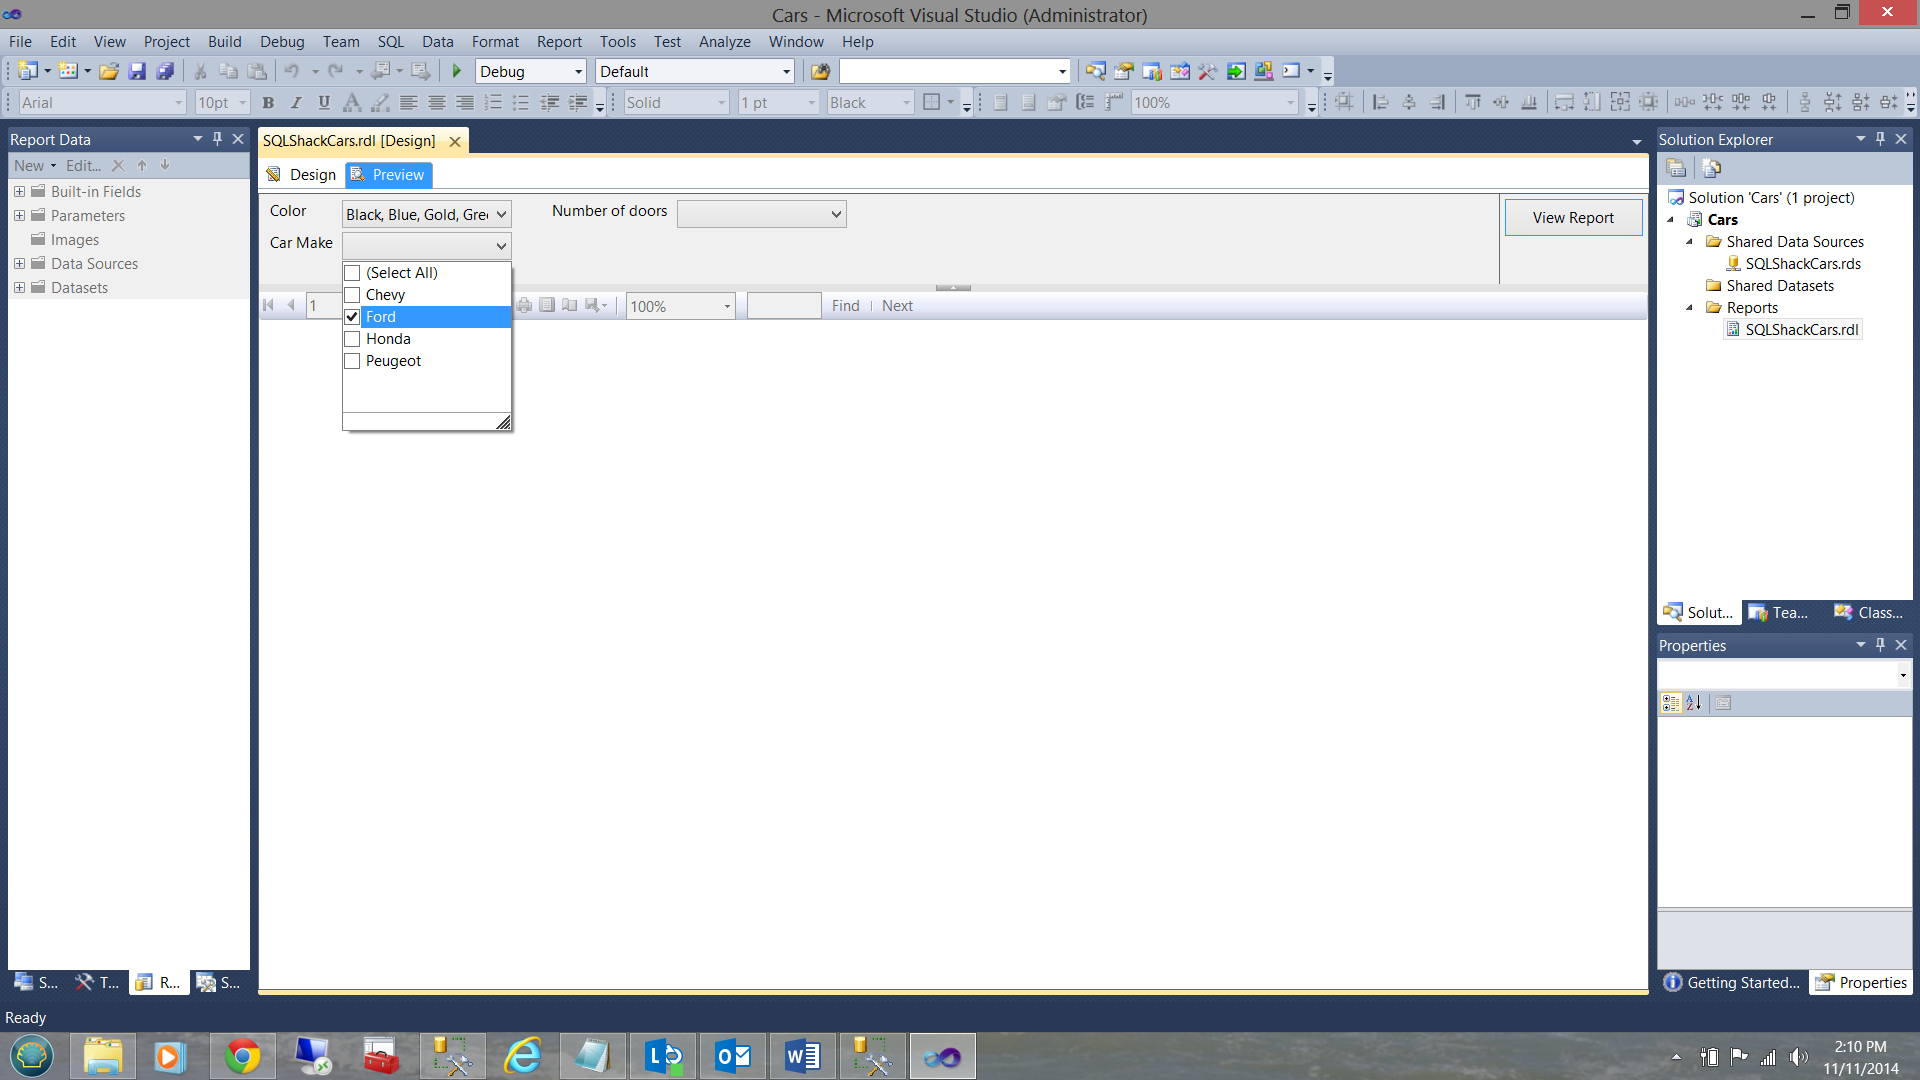
By clicking the ‘Preview’ tab we shall see that the parameter boxes have been populated.
Color
Make

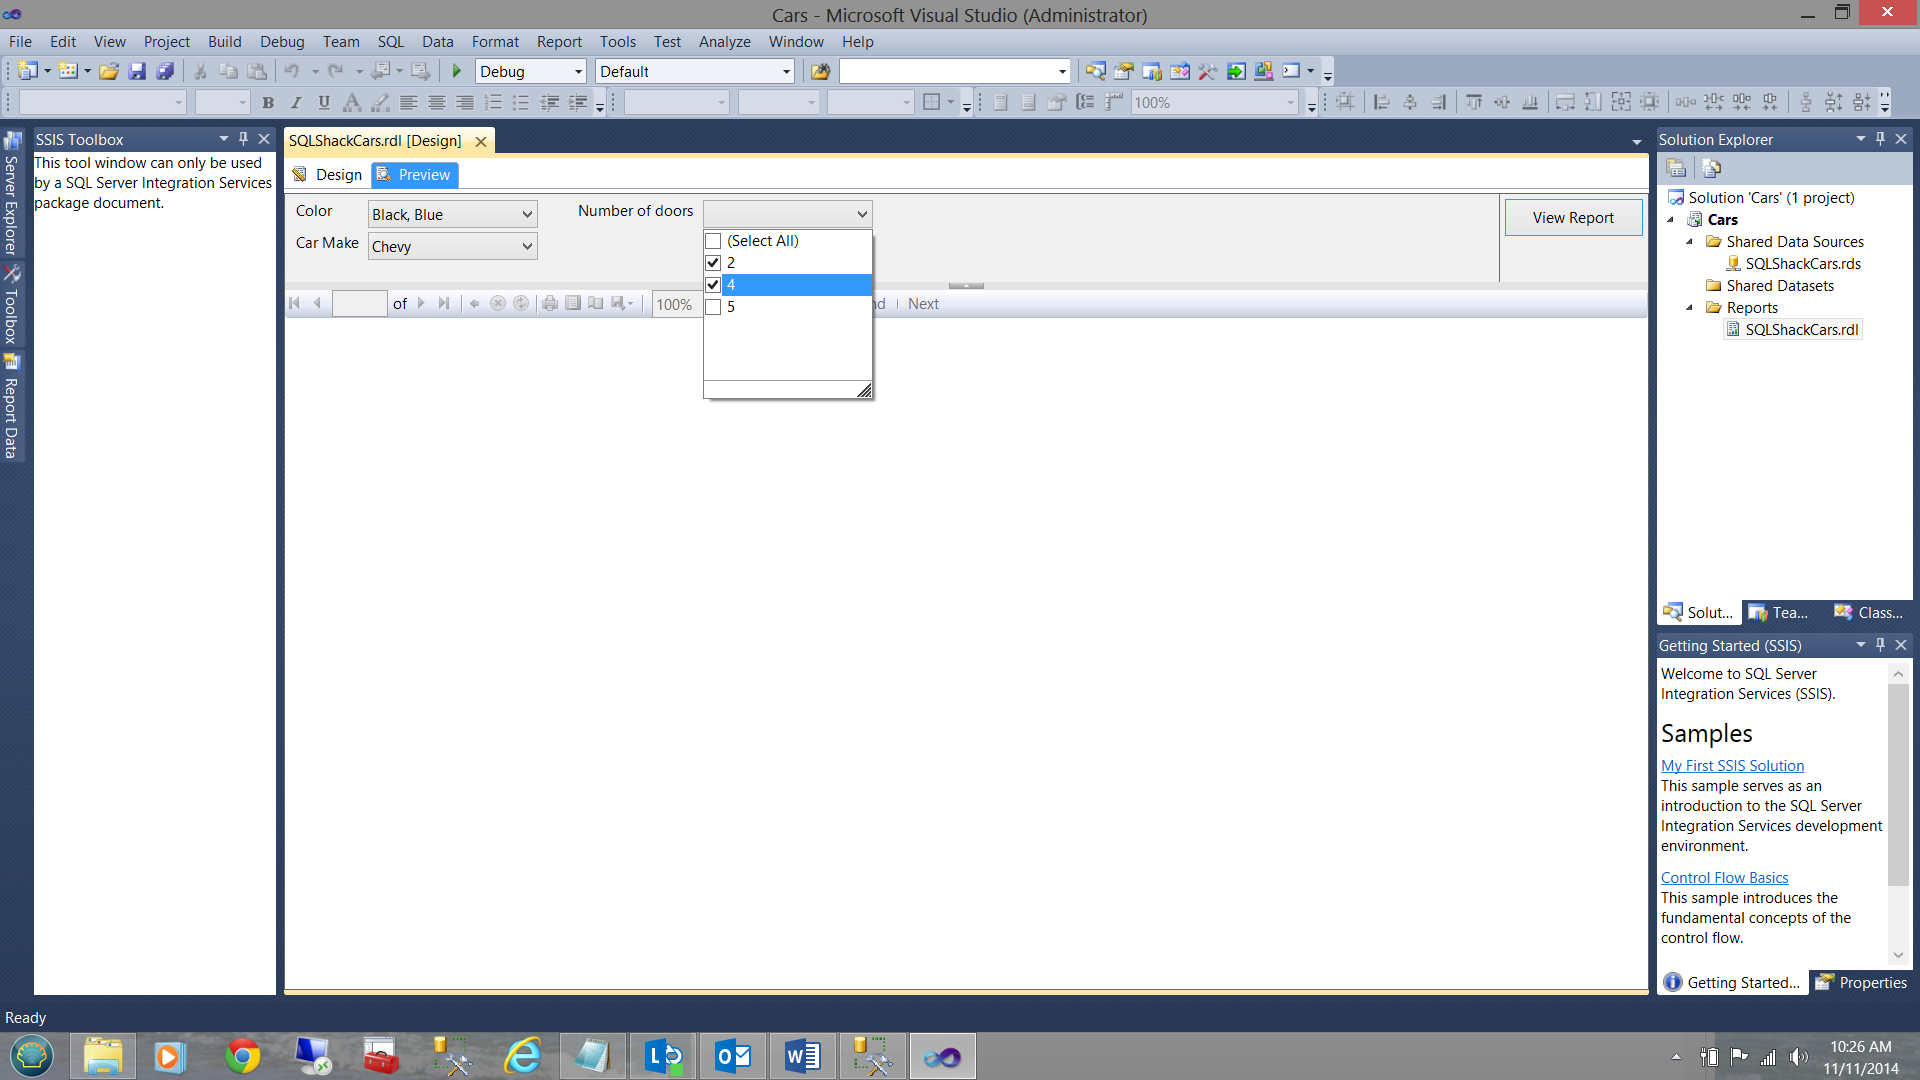
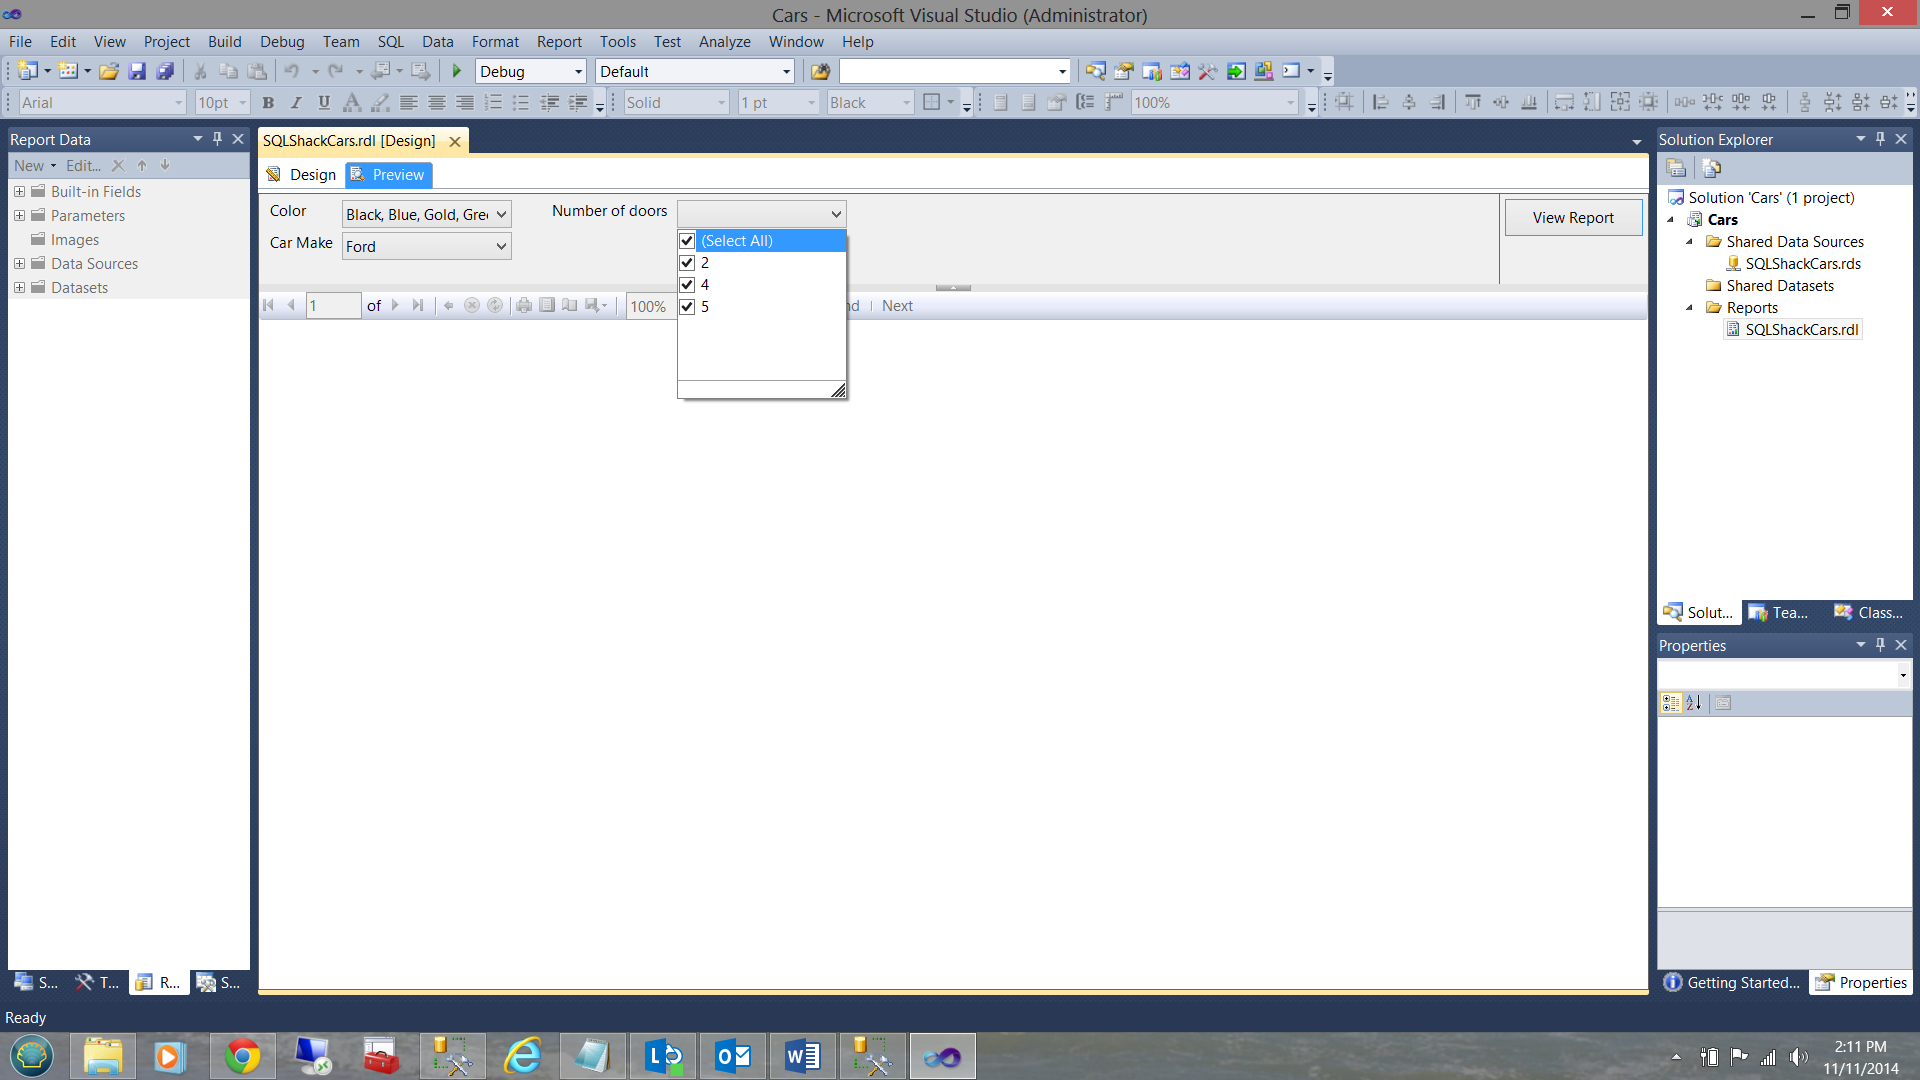
And Number of Doors
Great!!!! Here comes the real fun!!!
Meanwhile back in SQL Server Management Studio
The most critical part of our report has yet to be created. This is the dataset that will hold our final results. To channel the data to our fourth and final dataset, we shall create a stored procedure that will accept three incoming parameters (Color, Make and number of doors). These parameters will be used within the predicate and will filter out records that do not match the search criteria.
To do this we create a new ‘query’ within SQL Server Management Studio.
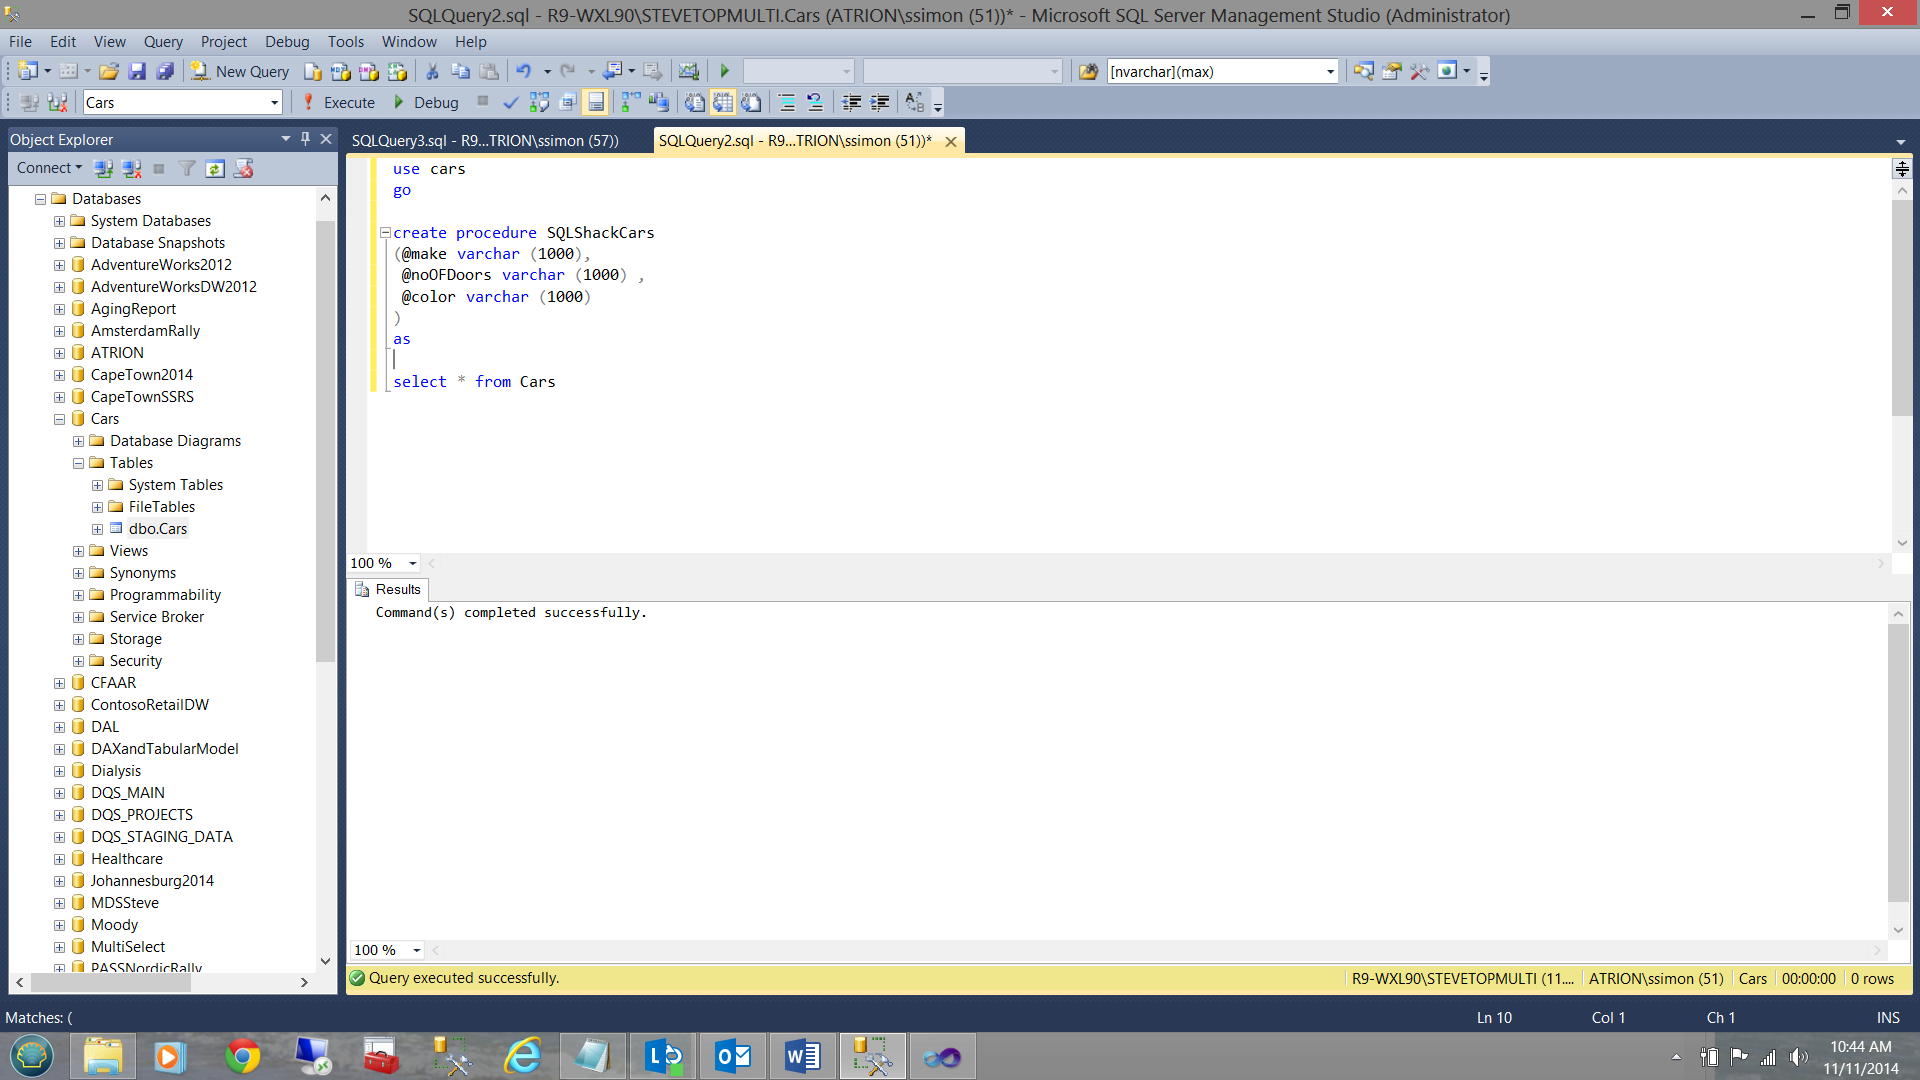
The reader will note that I have created the ‘header’ for our stored procedure (see above). You will also note that I have placed the query prototype within the code. BUT WAIT!! IF we were to pass through a single valued request such as where the color is ‘red’, the number of doors is ‘2’ and that the make was ‘Chevy’ then the predicate / where clause would be ‘where NumOFDoors = @NumOFDoors i.e. 2 and Make = @Make (Chevy) and Color = @Color (red)’
We would then be cooking with gas!
Unfortunately it is not that simple when comes to multiple selections.
Our plan of action
What is required, is to pass the stored procedure a COMMA DELIMTED STRING containing the arguments that the end user has selected. In other words should the user wish to see green, red and yellow cars then the argument value passed to the parameter would be GREEN, RED, YELLOW. We shall see how this is achieved when we return to our report project.
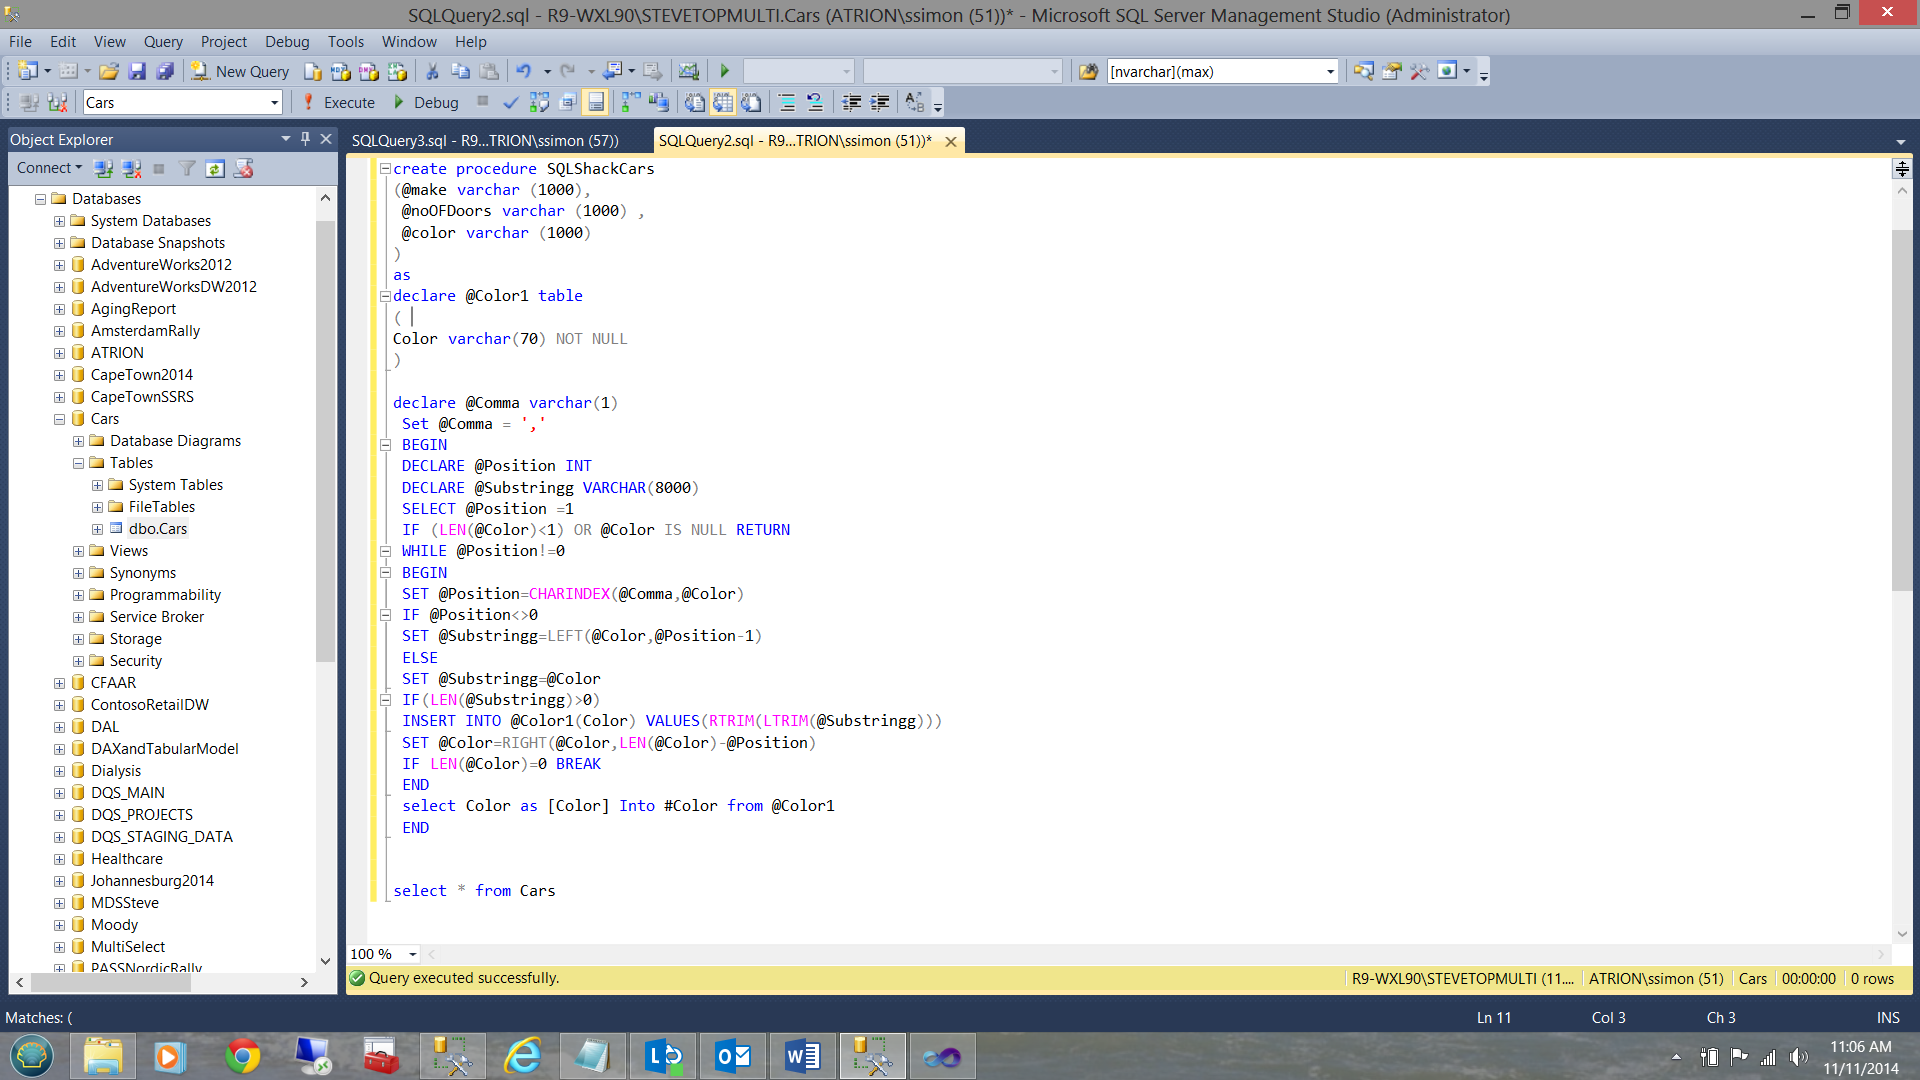
In the interim, we need to program our stored procedure to handle a comma delimited string and this is how I LIKE to achieve this task.
The code below accepts the value of @Color and splits the string of the color values, placing the values one by one into a table variable. Placing these values in a table variable permits us to iterate through the string stripping the string of the color that was just processed, shortening the string and doing so until the entire string is processed.
|
1 2 3 4 5 6 7 8 9 10 11 12 13 14 15 16 17 18 19 20 21 22 23 24 25 26 27 |
declare @Color table ( Color1 varchar(70) NOT NULL ) declare @Comma varchar(1) Set @Comma = ',' BEGIN DECLARE @Position INT DECLARE @Substringg VARCHAR(8000) SELECT @Position =1 IF (LEN(@Color)<1) OR @Color IS NULL RETURN WHILE @Position!=0 BEGIN SET @Position=CHARINDEX(@Comma,@Color) IF @Position<>0 SET @Substringg=LEFT(@Color,@Position-1) ELSE SET @Substringg=@Color IF(LEN(@Substringg)>0) INSERT INTO @Color1(Color) VALUES(RTRIM(LTRIM(@Substringg))) SET @Color=RIGHT(@Color,LEN(@Color)-@Position) IF LEN(@Color)=0 BREAK END select Color as [Color] Into #Color from @Color1 END |
The effect of this piece of code is to convert ‘ Yellow, Red, Green’ into
Yellow
Red
Green
Note that in the last step I moved all the values from the table variable into a temporary table. I do this by habit as I may have to issue a GO statement further down within the code. Issuing a GO statement clears any table variables that may exist whilst temporary tables persist until the end of the code.
Placing this code snippet into our stored procedure we have now catered for the color parameter. It is left up to the reader to create the necessary code for the number of door and the make of car.
Looking at the data structure of our table we find the following:

Our finished stored procedure is similar to the one shown below:
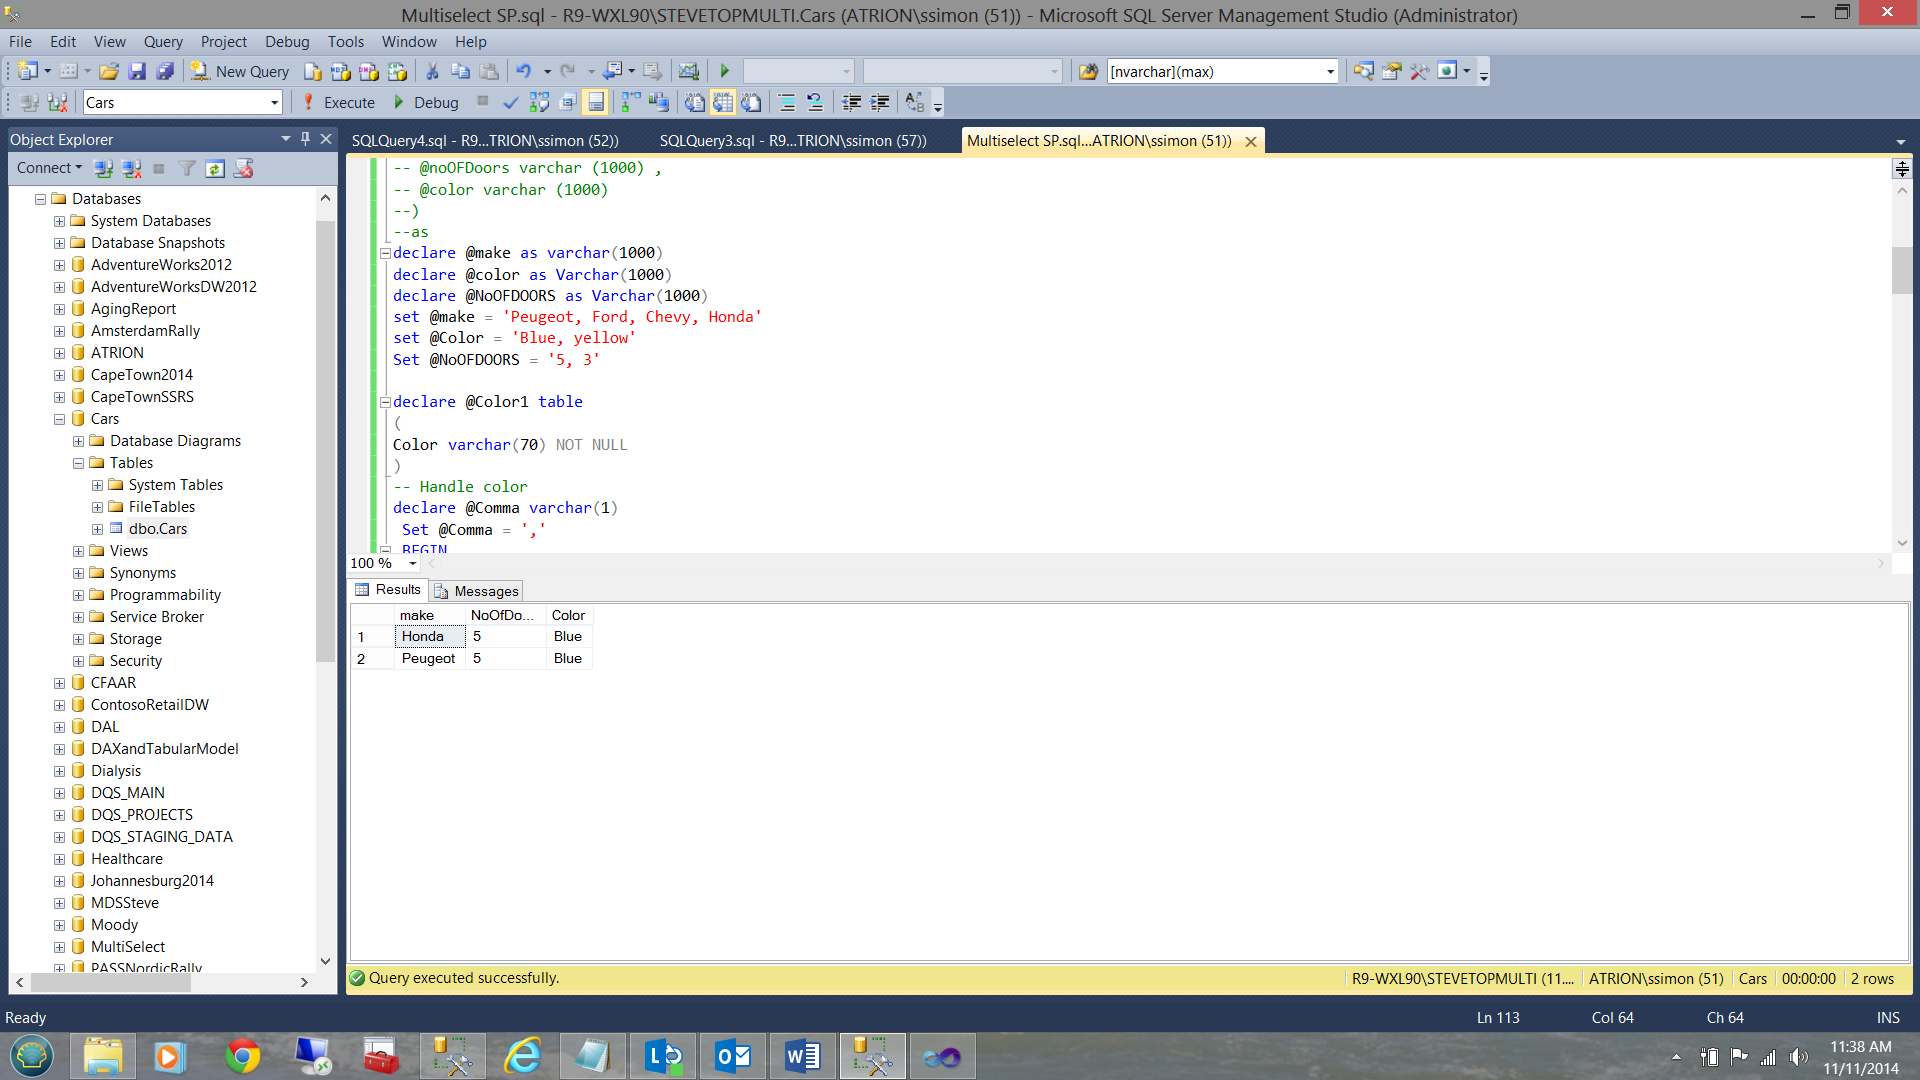
The actual final query is shown immediately below:
|
1 2 3 4 5 6 7 8 9 |
select cars.make, cars.NoOfDoors, cars.Color from Cars cars inner join #make make on rtrim(ltrim(cars.Make)) = rtrim(ltrim(make.Make)) inner join #Doors doors on rtrim(ltrim(cars.NoOFDOORS)) = rtrim(ltrim(doors.NoOfDoors)) inner join #color color on rtrim(ltrim(cars.Color)) = rtrim(ltrim(Color.Color)) |
Once again, the astute reader will note that I have used inner joins as a predicate (i.e. the where clause). Now wait a minute!!! Why not use where color in ( ‘Yellow’, ‘Green’ etc). The reason being that one may ONLY HAVE 1000 “in’s”. Any more, say 1001 will cause a query to fail. This is true in SQL Server and Oracle. By using inner joins, the number of filter choices are virtually limitless.
REMEMBER THAT IF YOU ‘SELECT ALL’, it is quite possible for the number of values to exceed 1000.
Putting the pieces to talk to one another
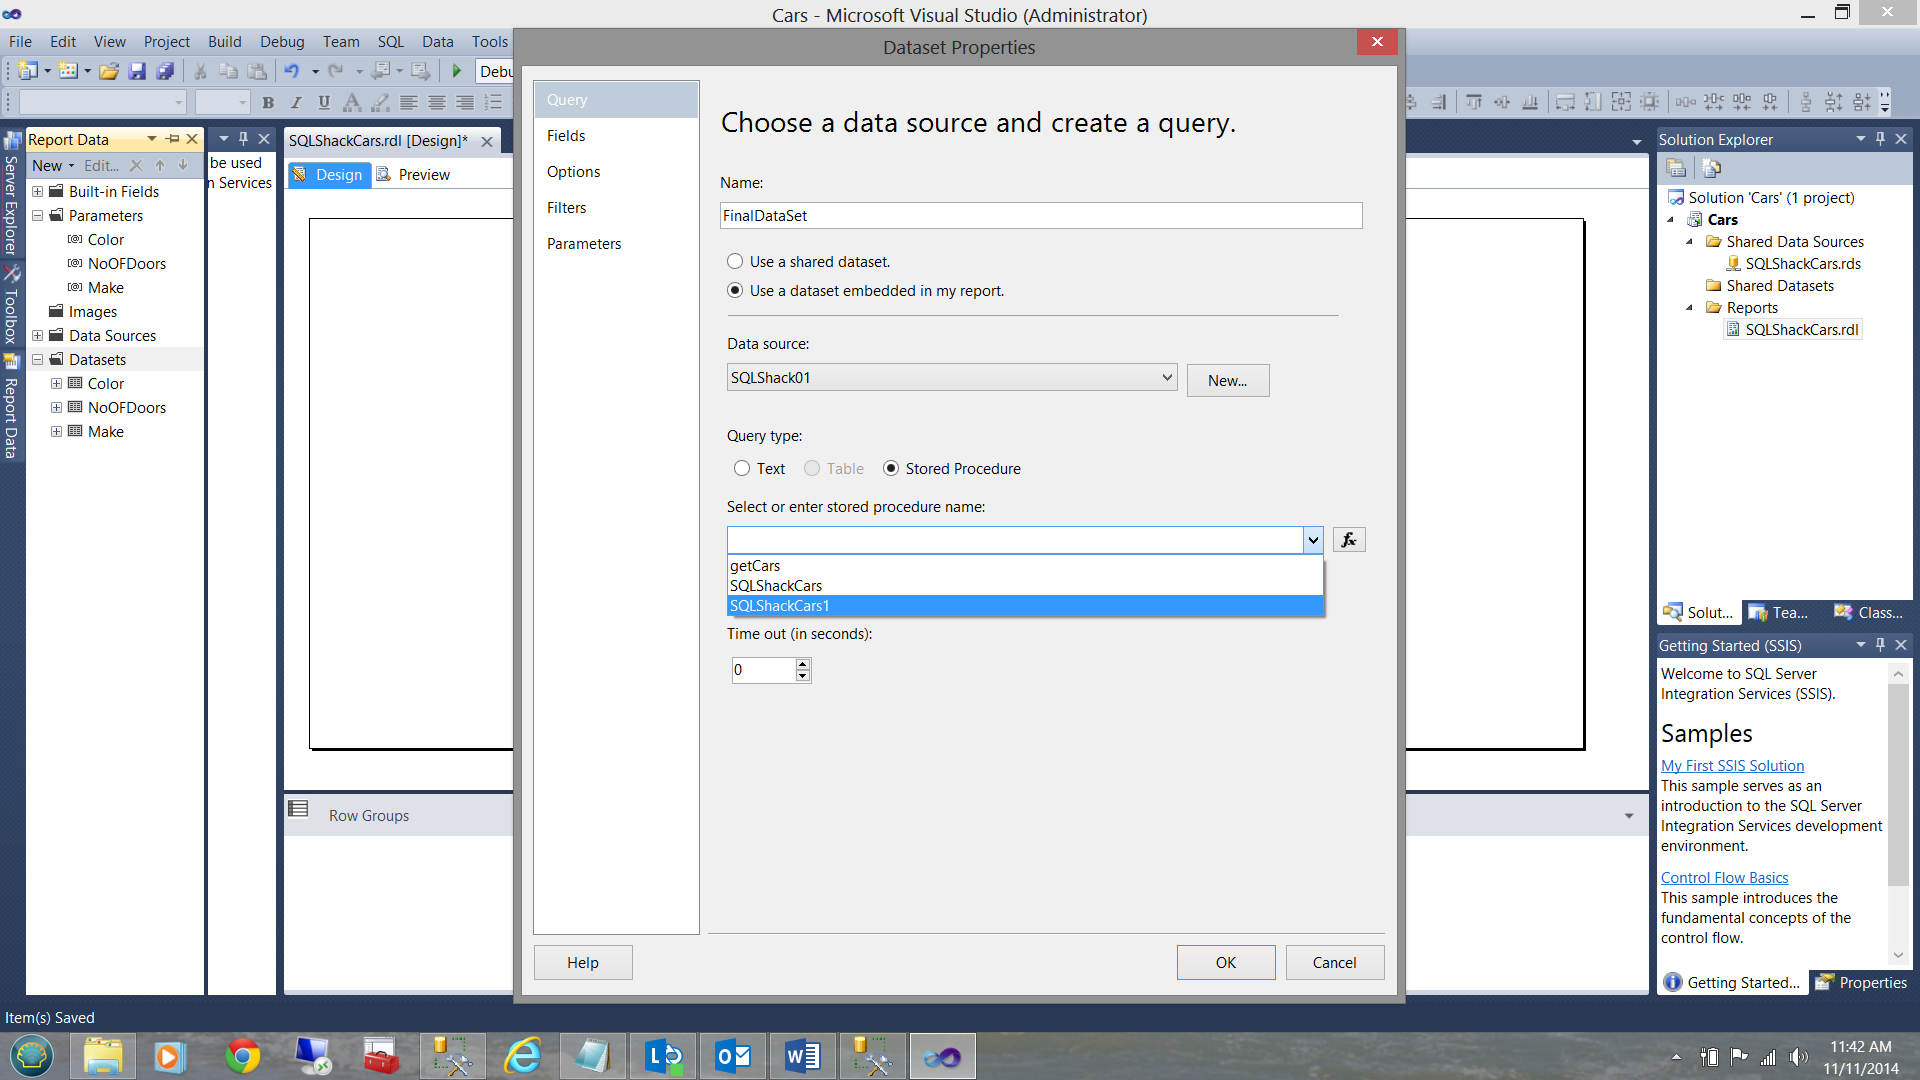
Now that the store procedure has been created, we must create a fourth and final dataset within our reporting services project. This dataset will contain the client requested filtered data.
Back in our reporting services project we create a dataset which I call ‘FinalDataSet’ which will source its data from the return from the stored procedure (SQLShackCars1) that we just created. Once again we right click on ‘Datasets’ and select ‘Add dataset’. This opens the dataset properties data entry screen. Note that I have completed the stored procedure data capture box with the name of the stored procedure that we just created. The completed properties screen may be seen below:
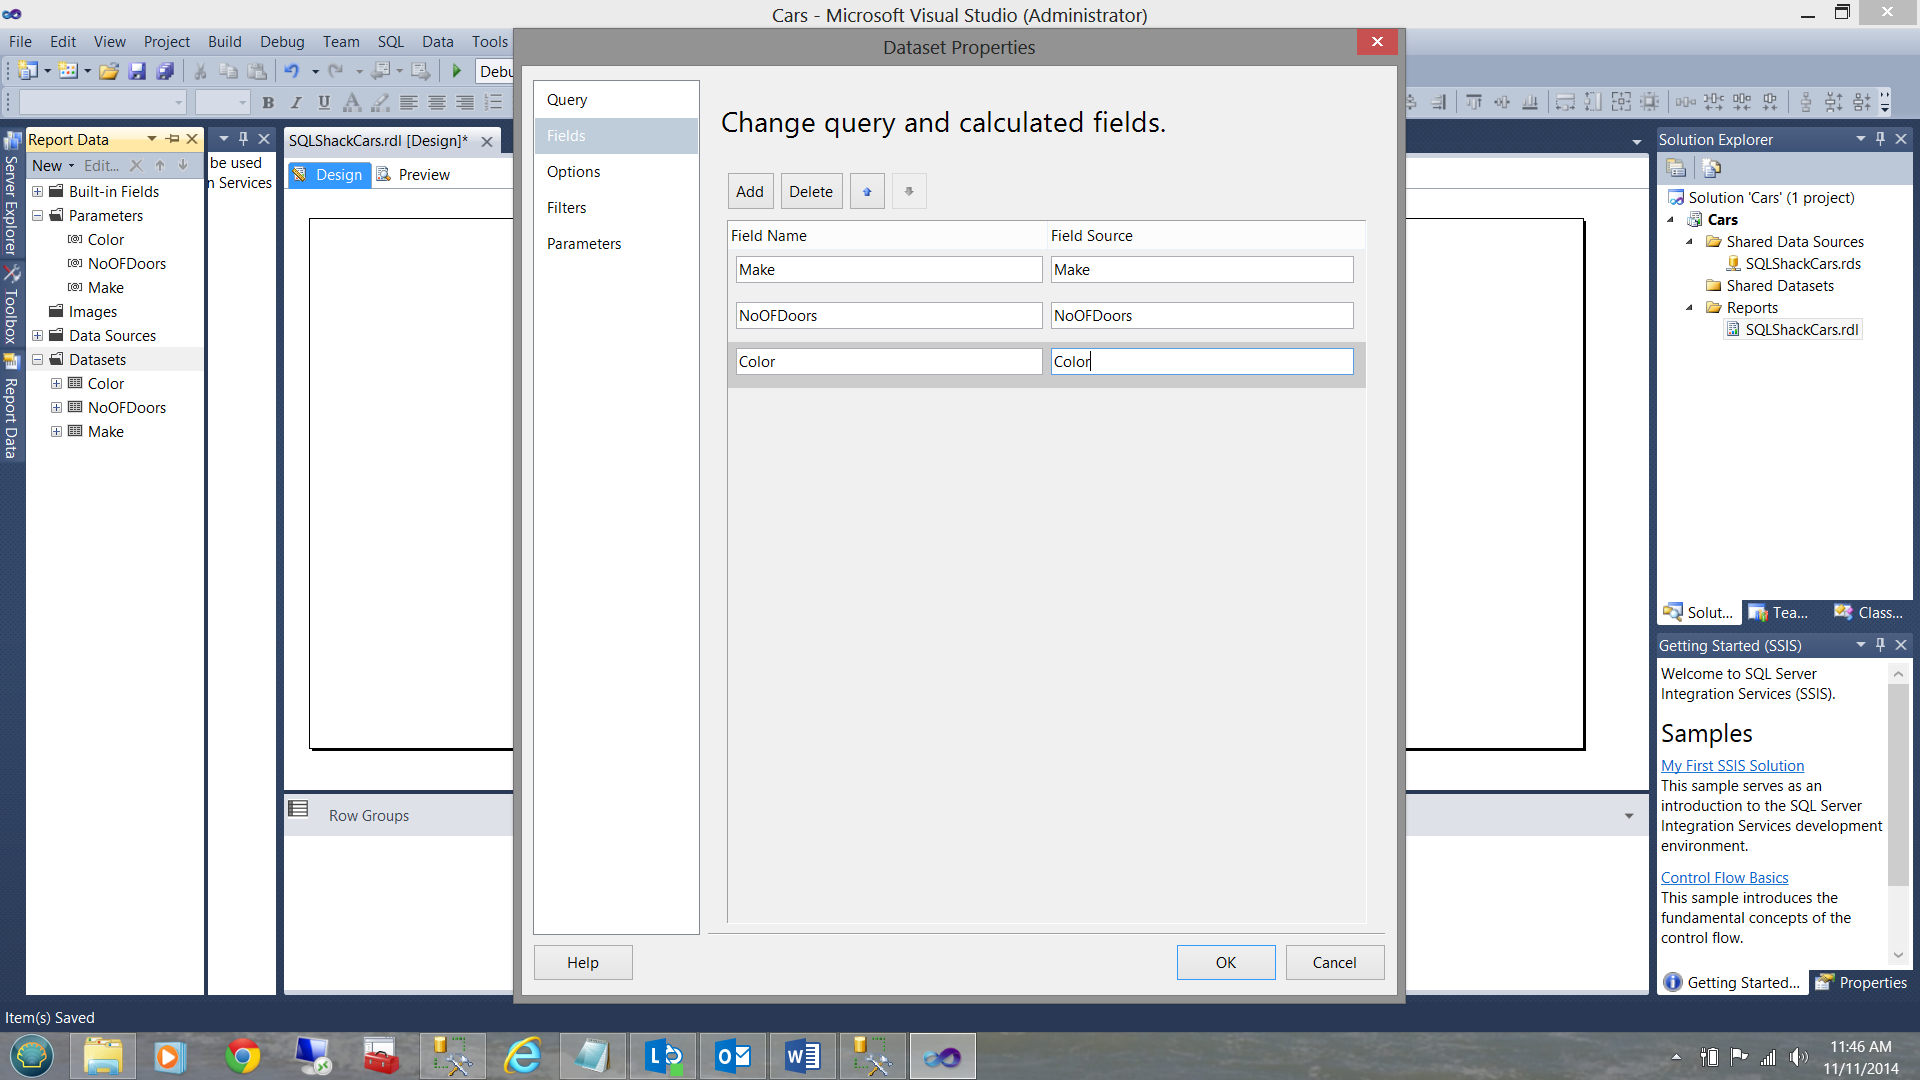
Clicking on the ‘Fields’ tab (see the screen dump above upper left), we shall see that the fields that the query returns, are present on your screen(see below).
As we shall be passing a string (to the stored procedure) which potentially contains more than one value i.e. “Green, Yellow), we must change the format of the parameter values for Make, NoOFDoors and Color.
Right now they reflect as ….
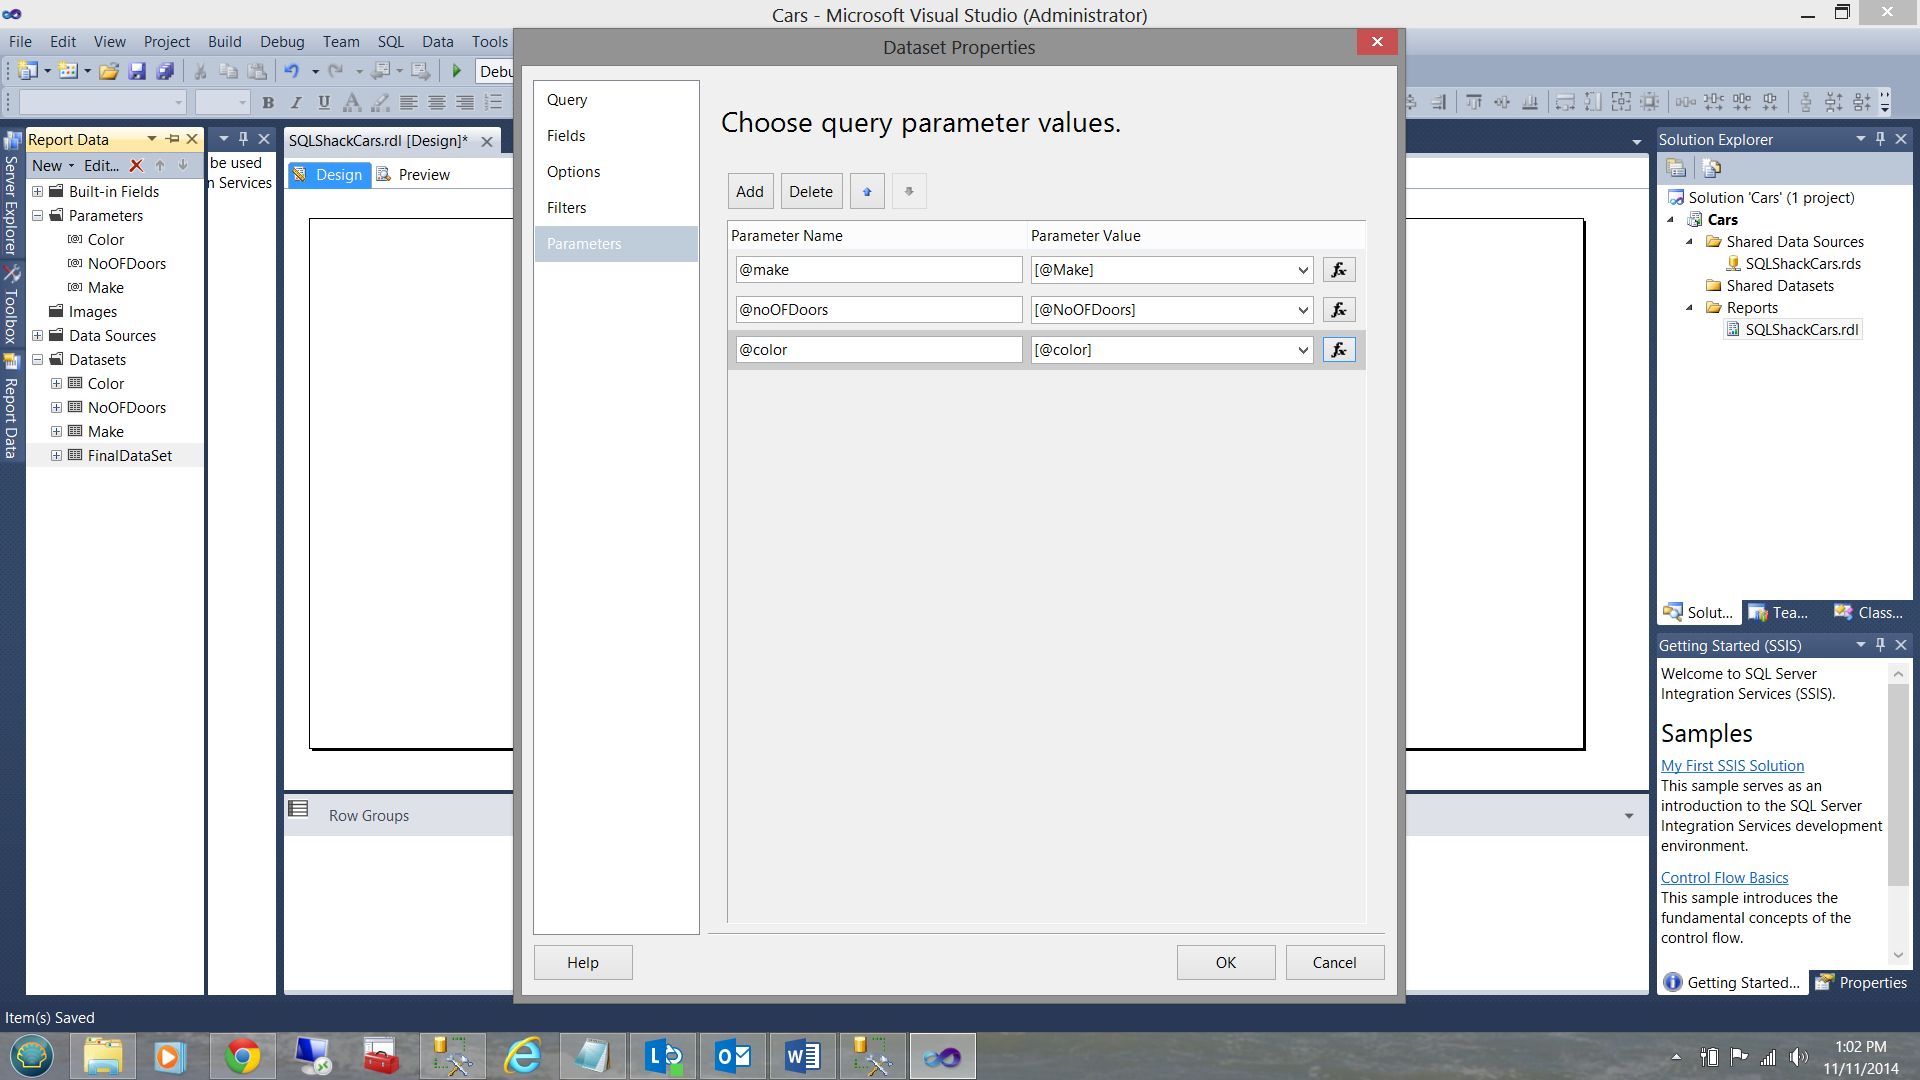
Note the value [@Make], [@NoOFDoors] and [@color] (see above).
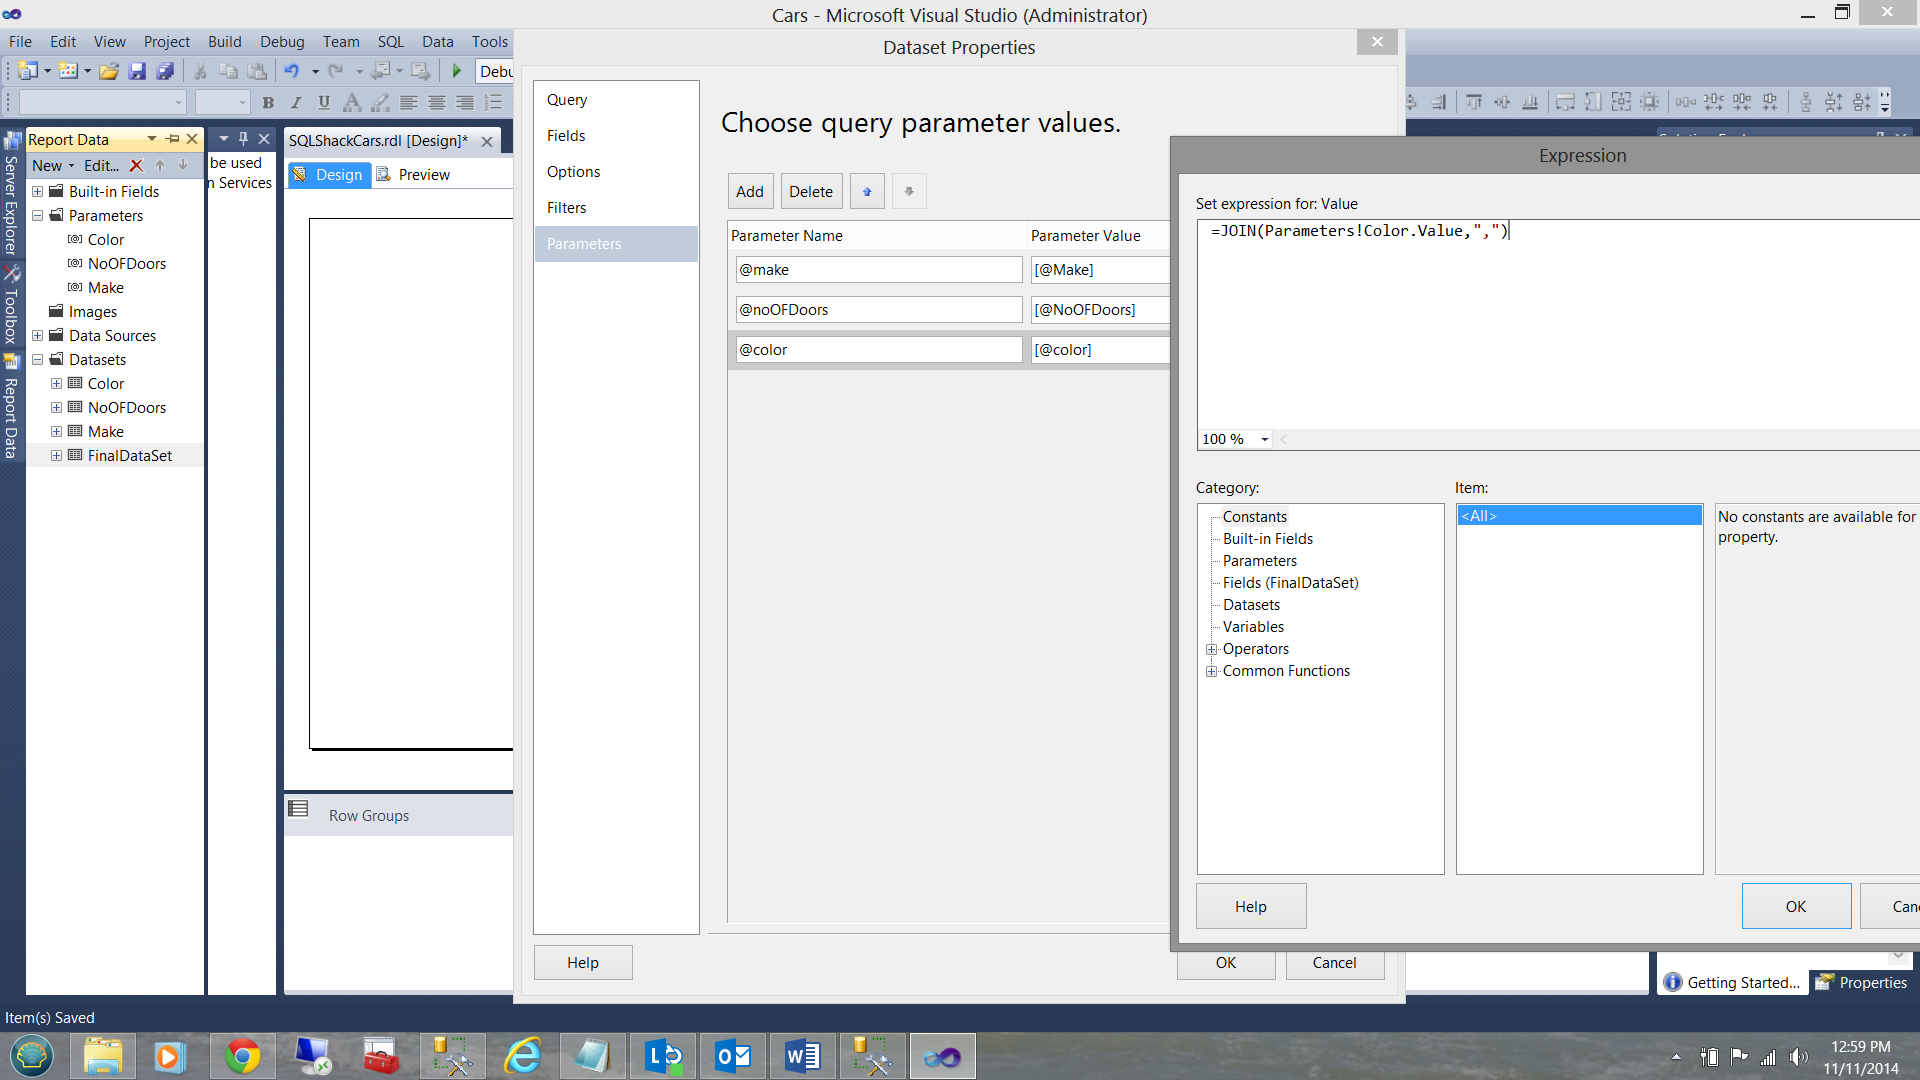
We modify [@Make], [@NoOFDoors] and [@color] to be
|
1 2 3 4 5 |
=JOIN(Parameters!Make.Value,",") =JOIN(Parameters!NoOFDoors.Value,",") =JOIN(Parameters!Color.Value,",") |
The change to ‘color’ is shown below. Make and NoOFDoors are processed in a similar manner.
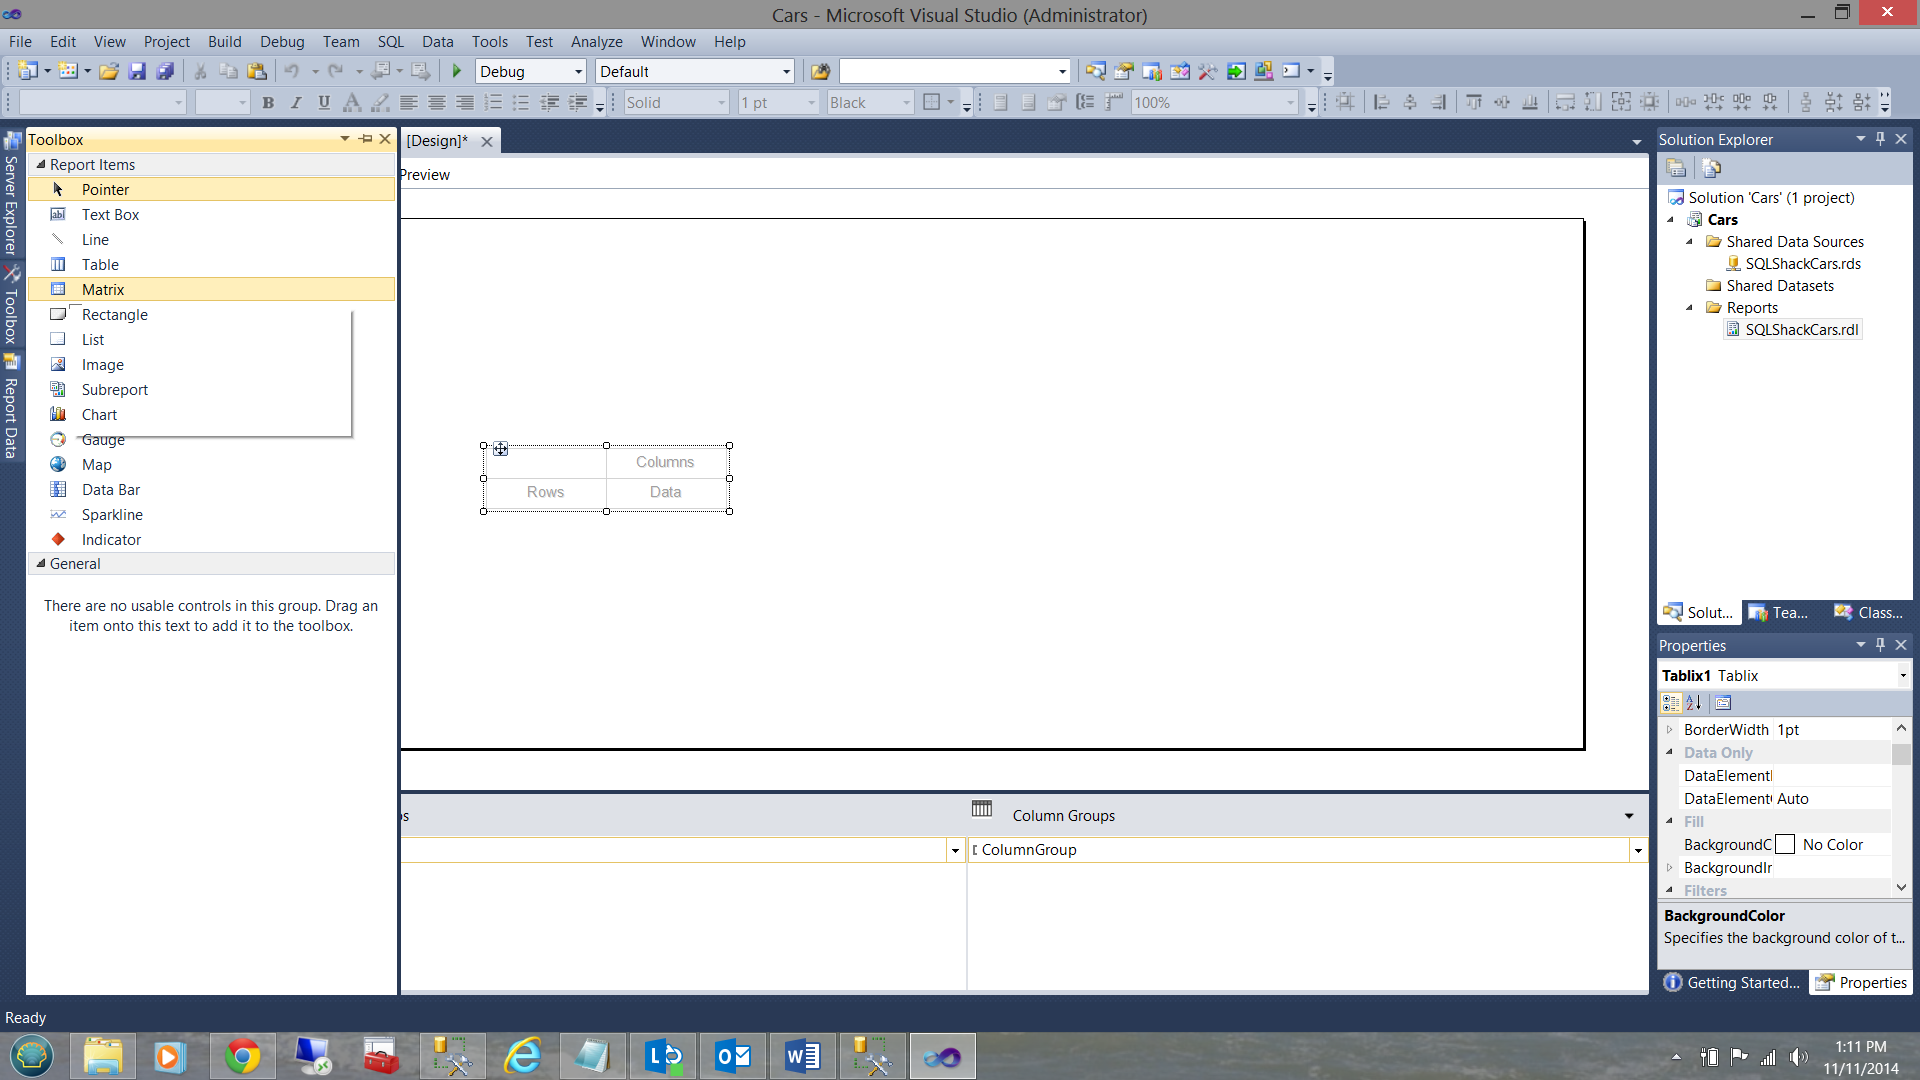
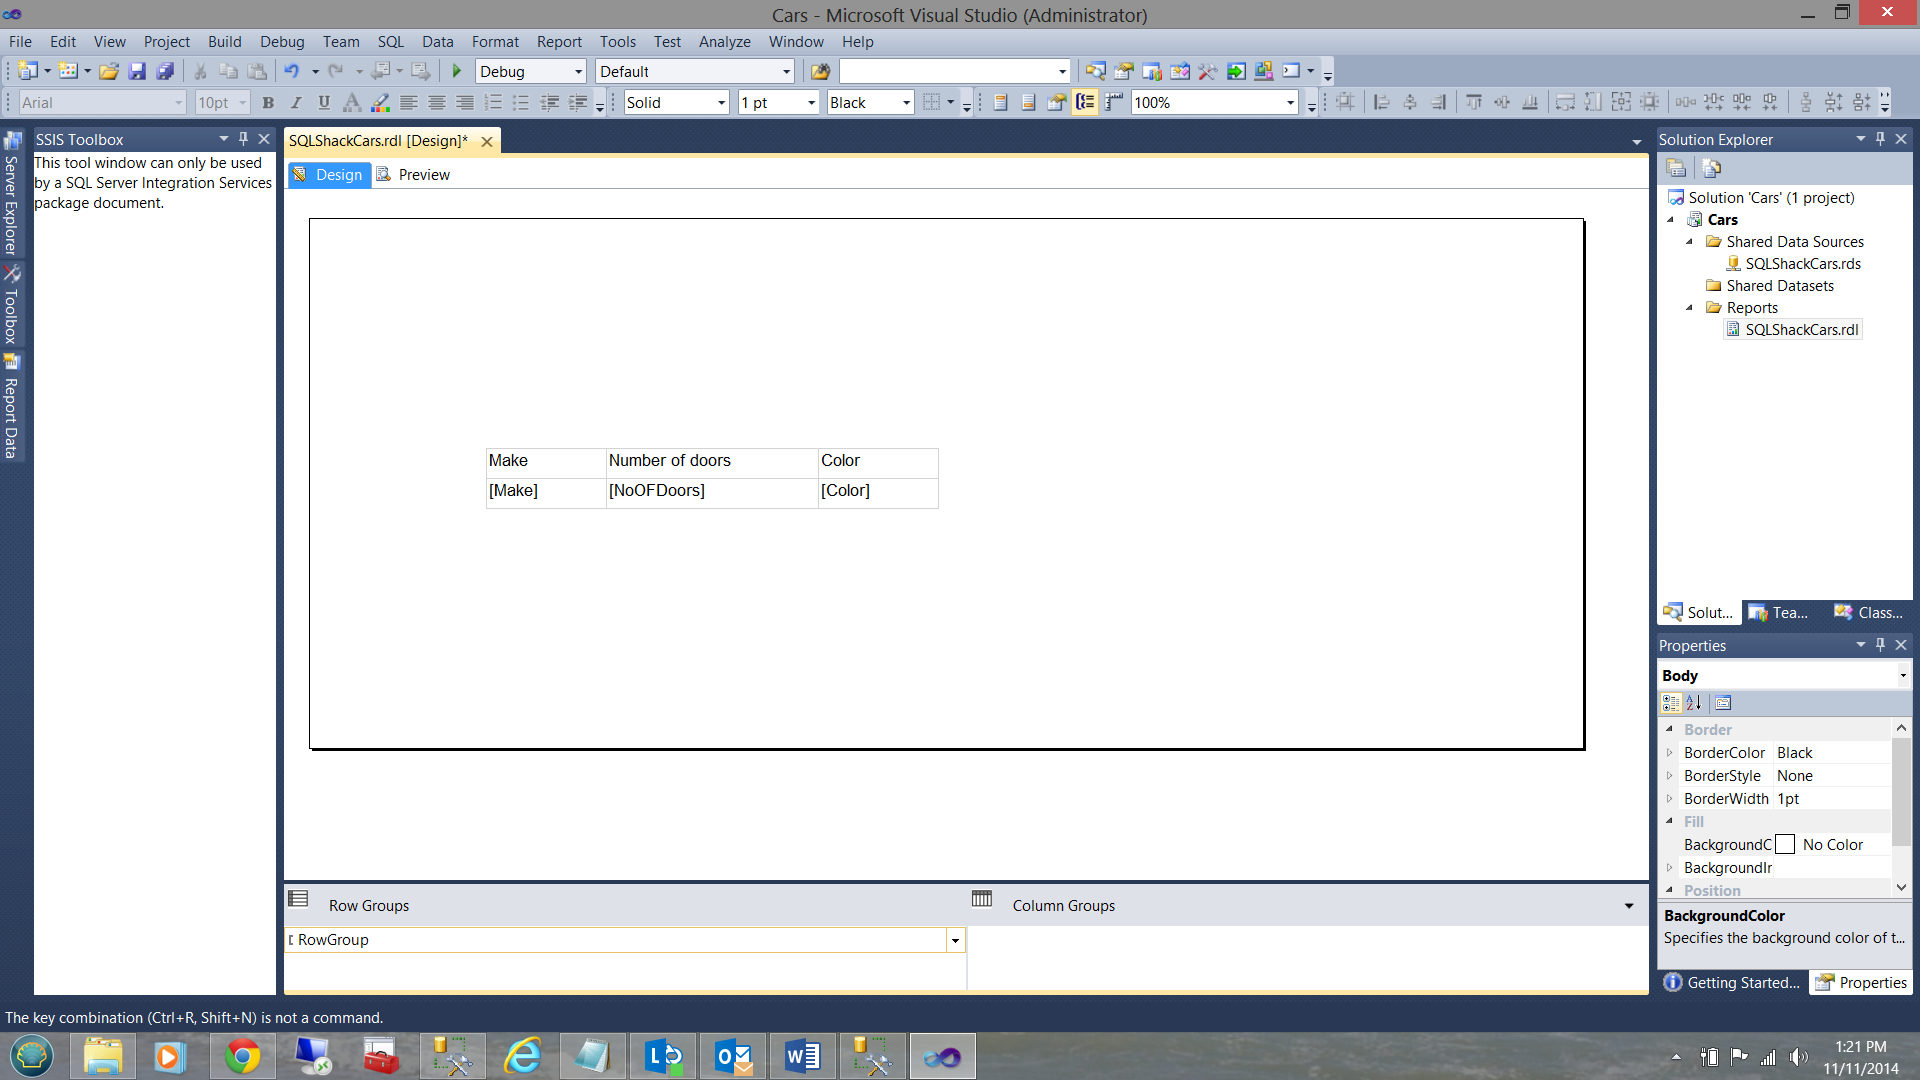
Back on our project surface, we drag in a MATRIX/TABLIX control from the tool box.
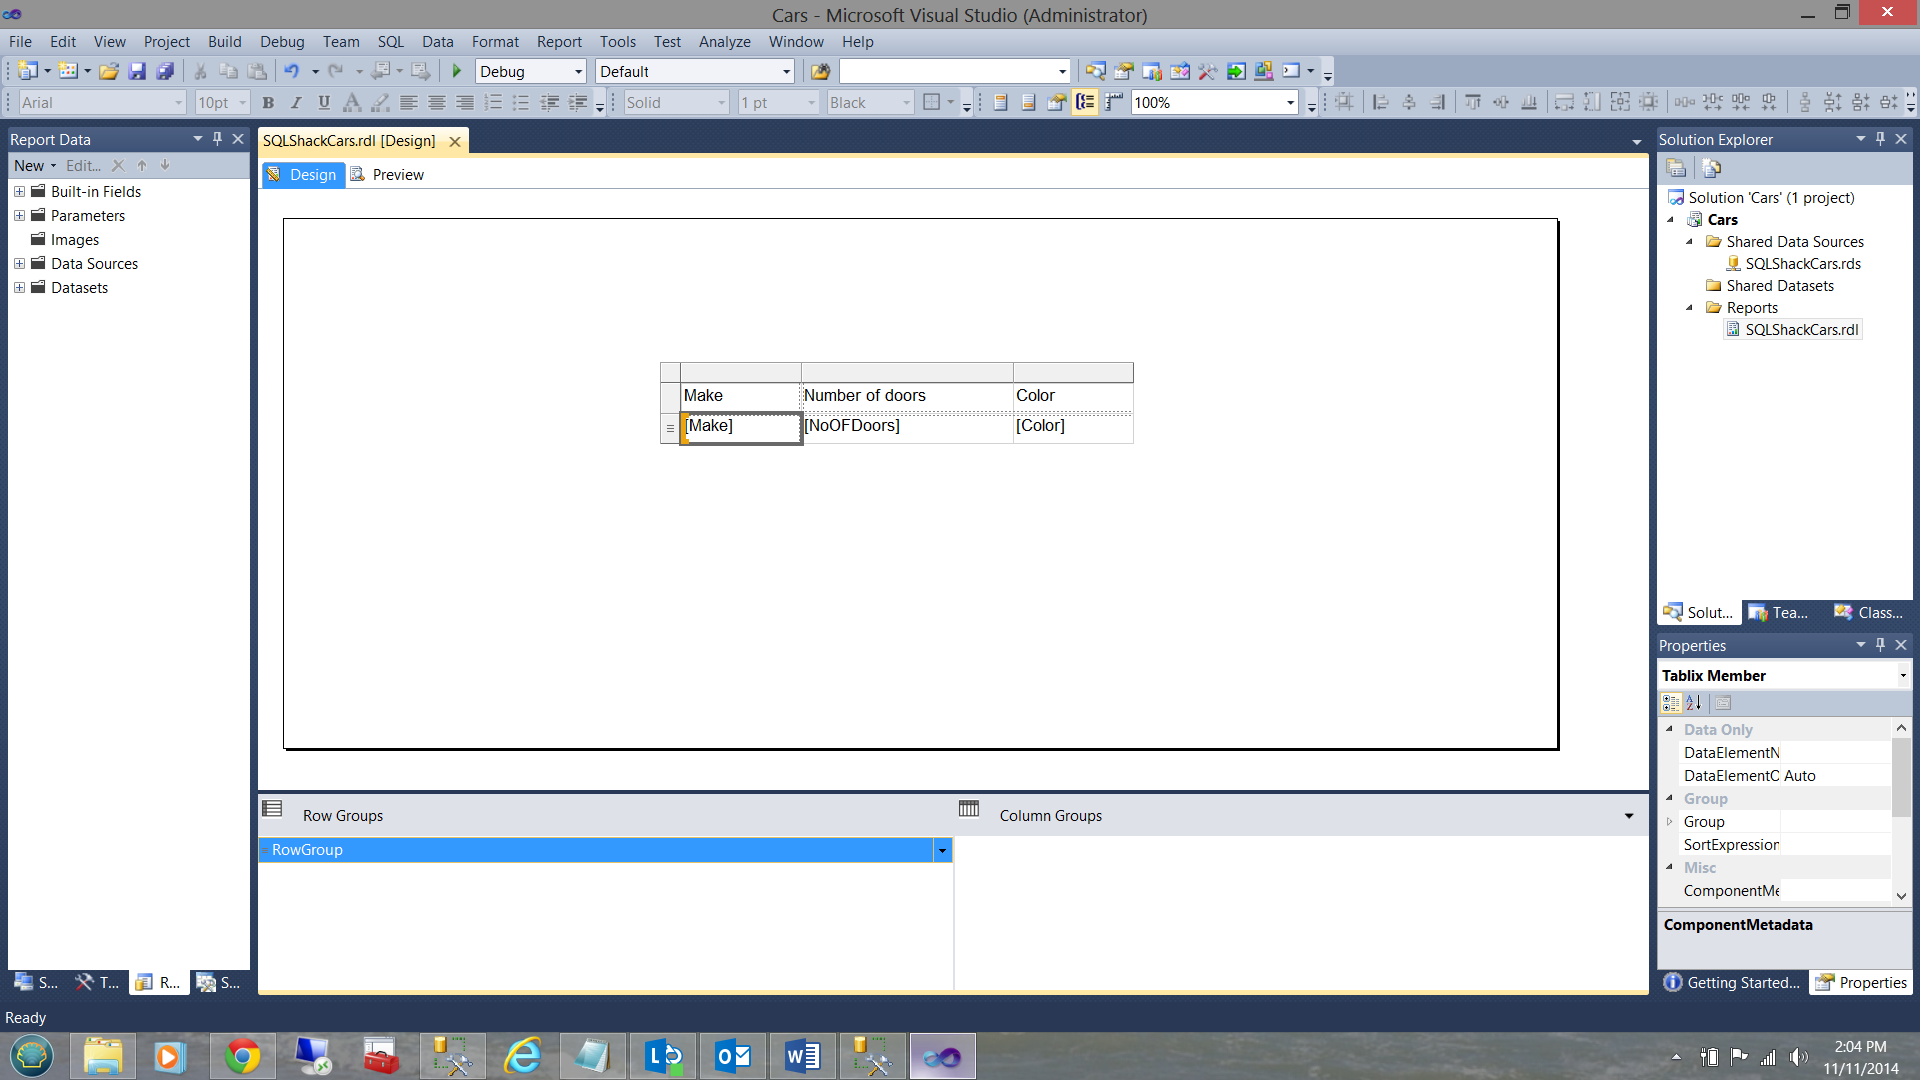
We set the ‘dataset name’ property of the control to FinalDataSet (see below lower right)
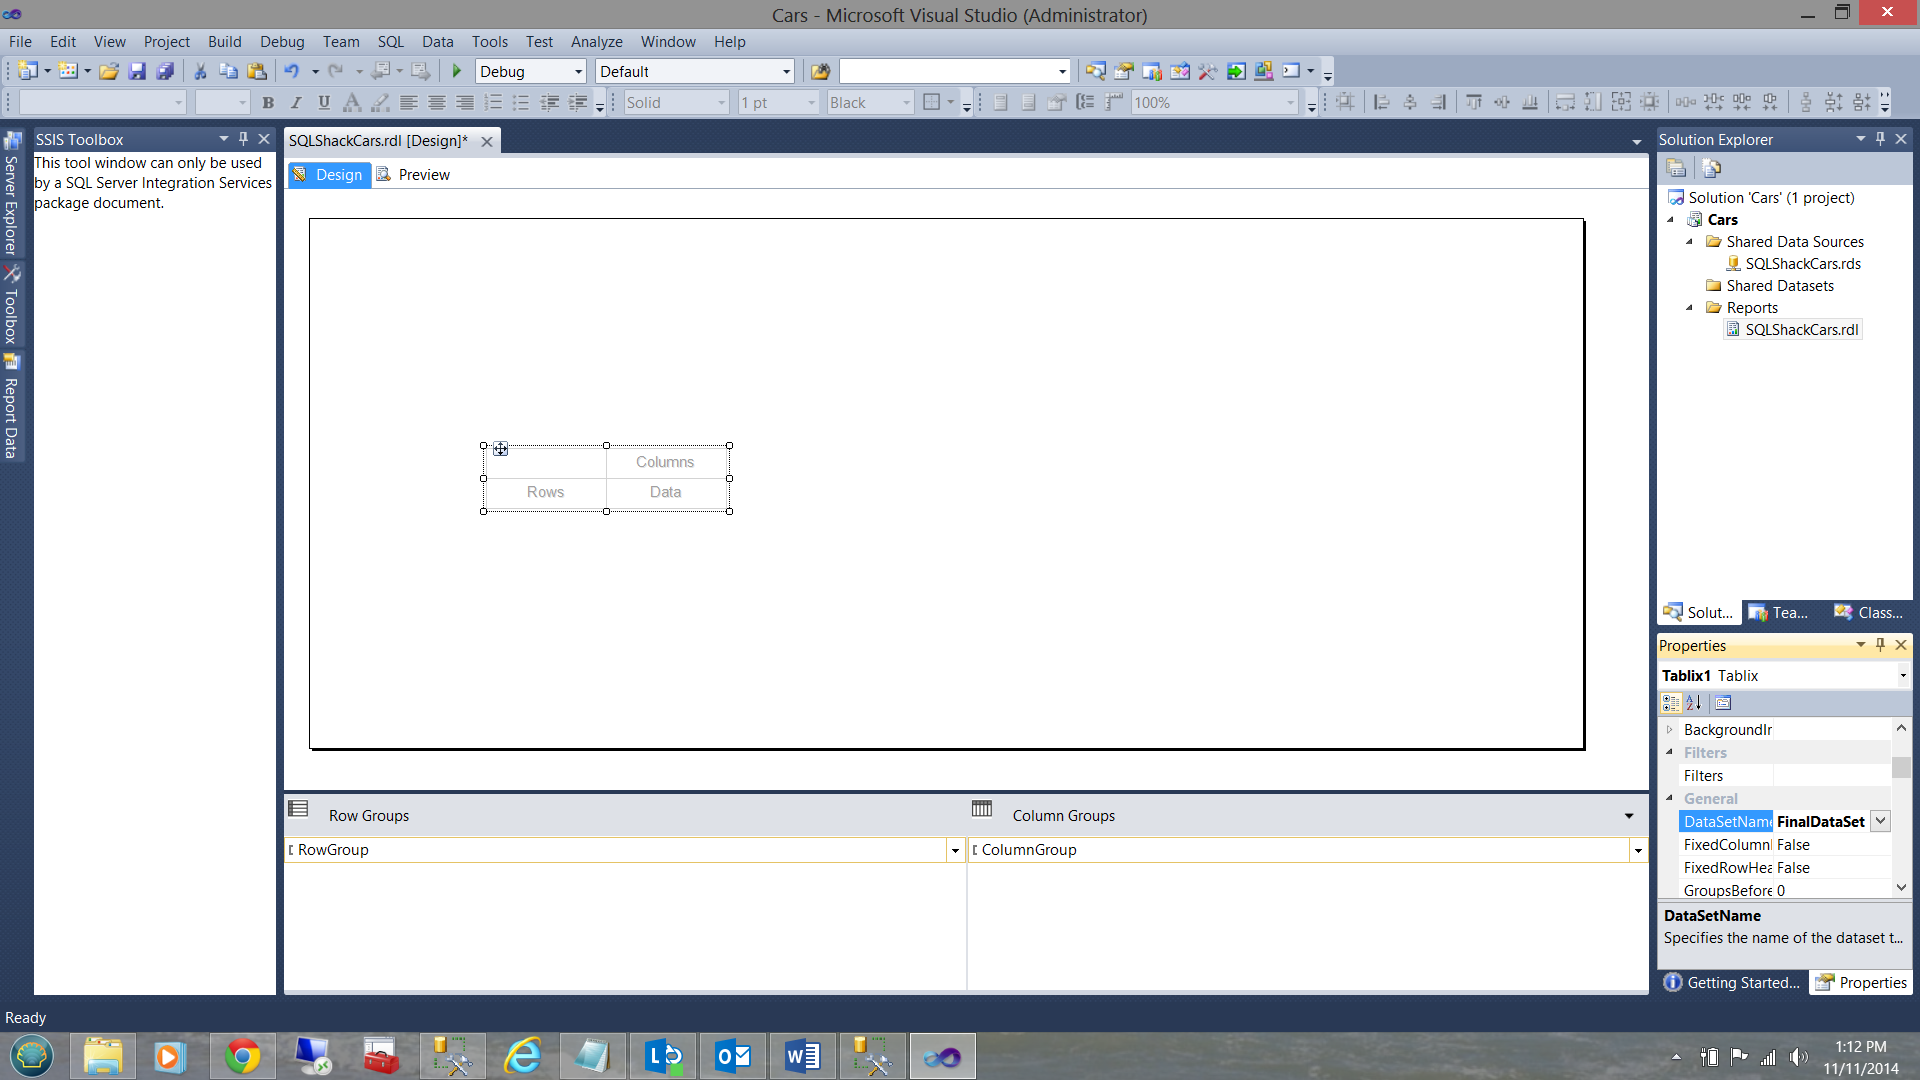
We leave the row grouping box untouched. The reason being, that we do not wish to aggregate the extracted values. Quite the contrary, we wish to view the entries as they are. (See below)
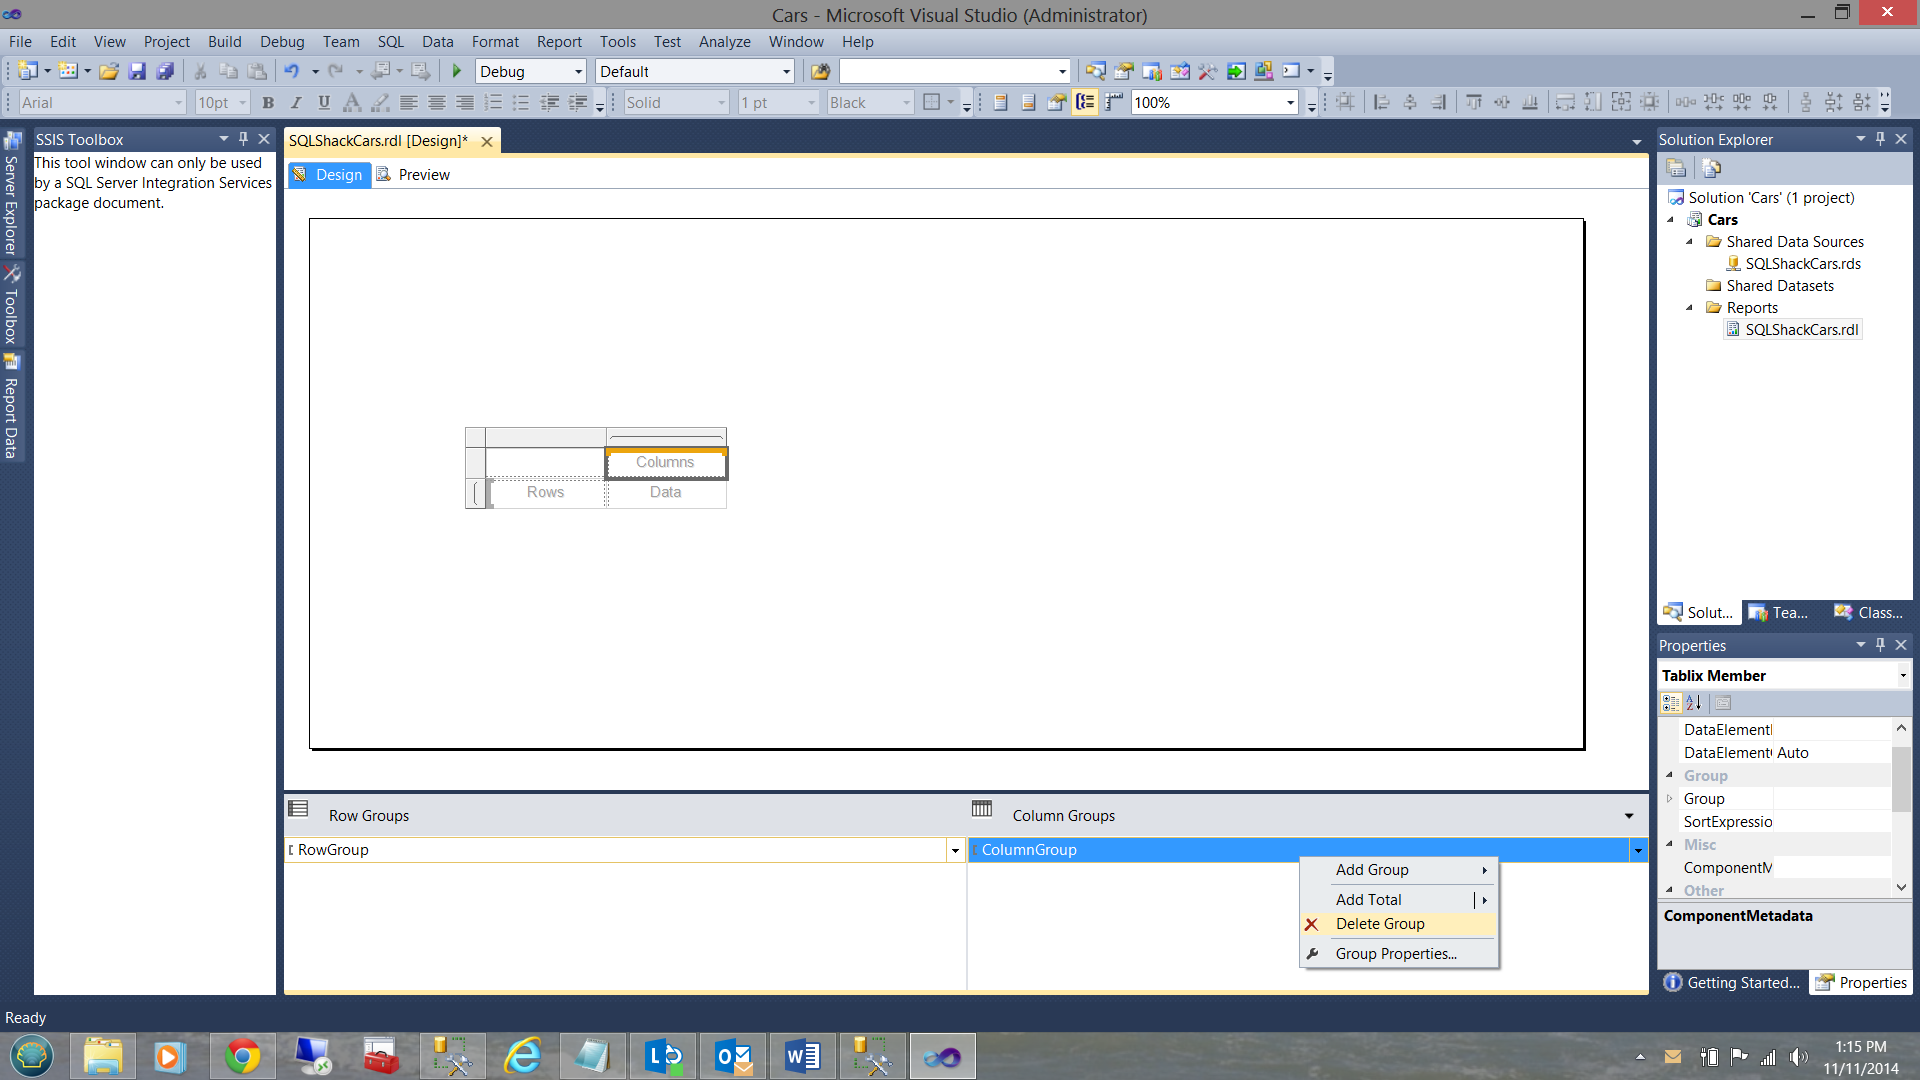
Next, right click on the ‘Column Grouping’ box. We click ‘Delete Group’ (see below)
We are then asked if we want to delete the ‘Group and the data’ or just the Group. We check the ‘Delete group only’ option (see below).
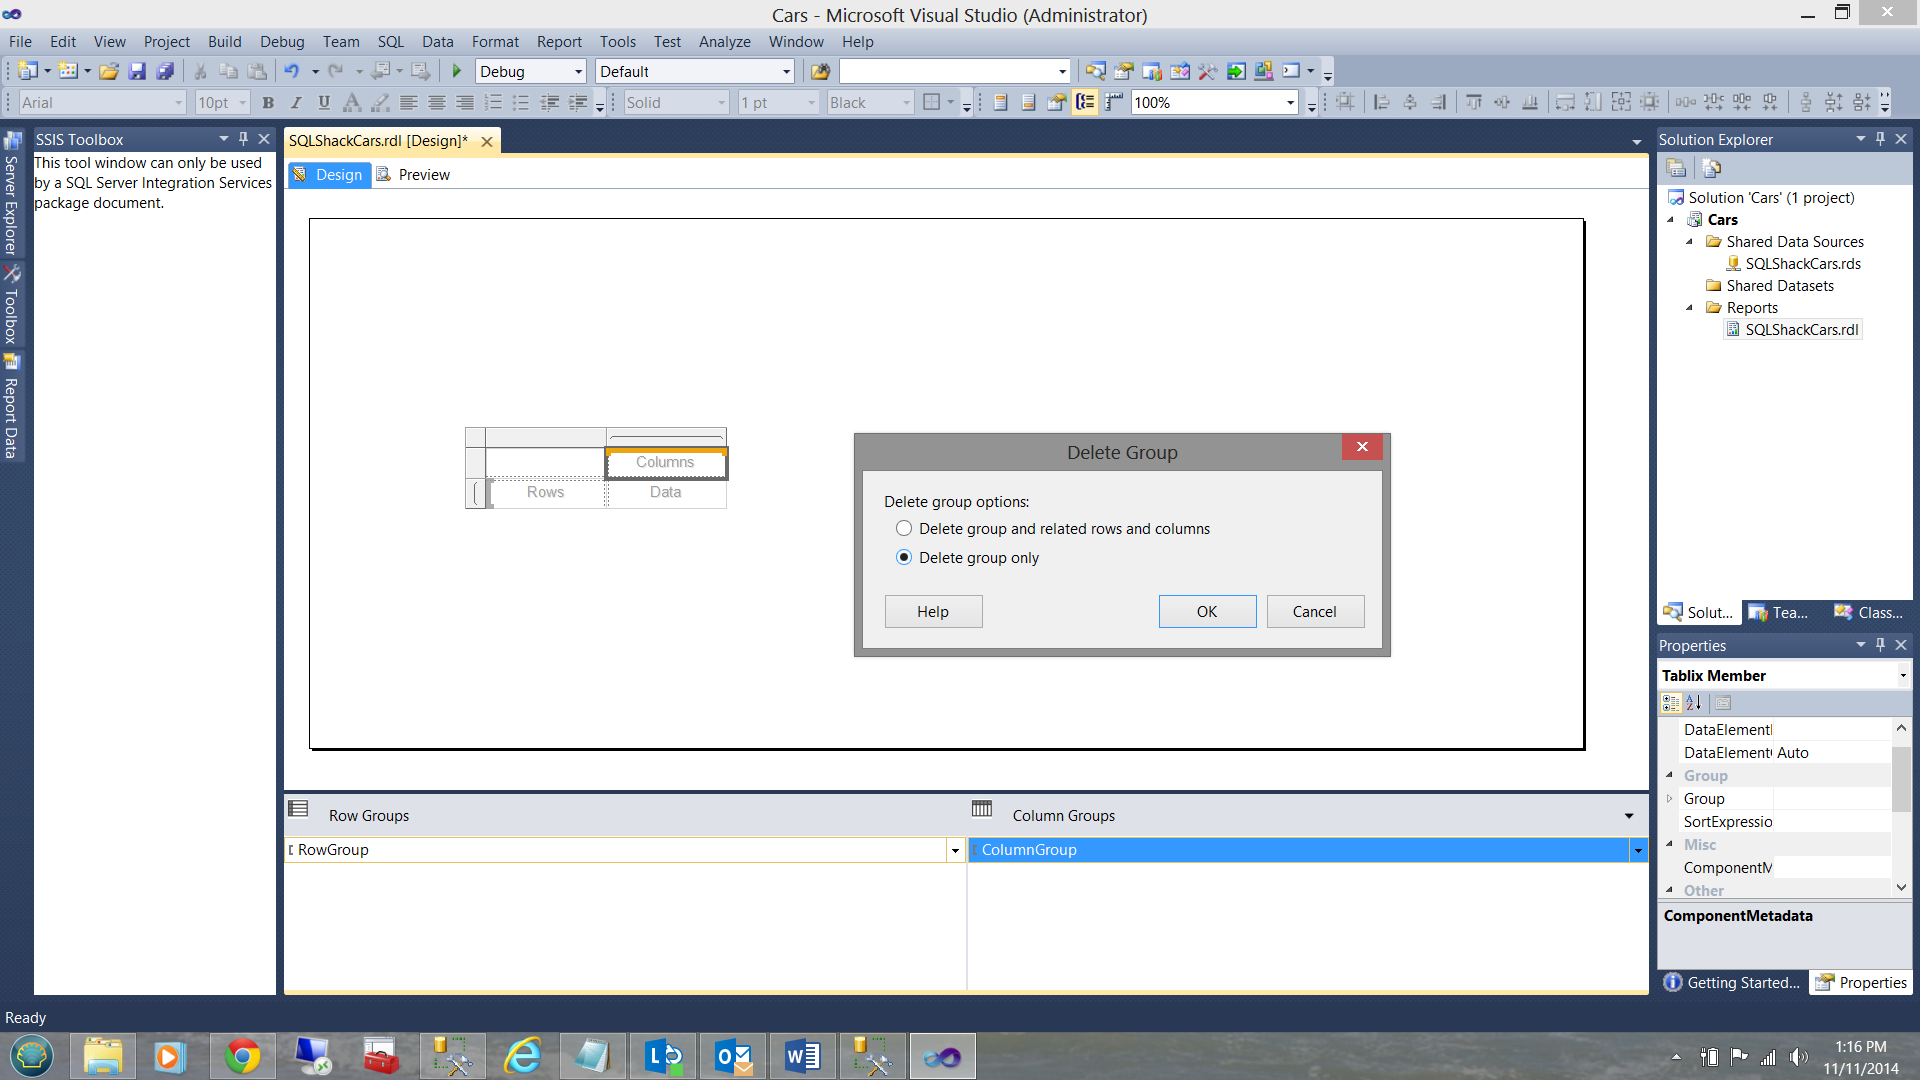
We click OK to finish this task.
We are now in a position to populate our table cells.
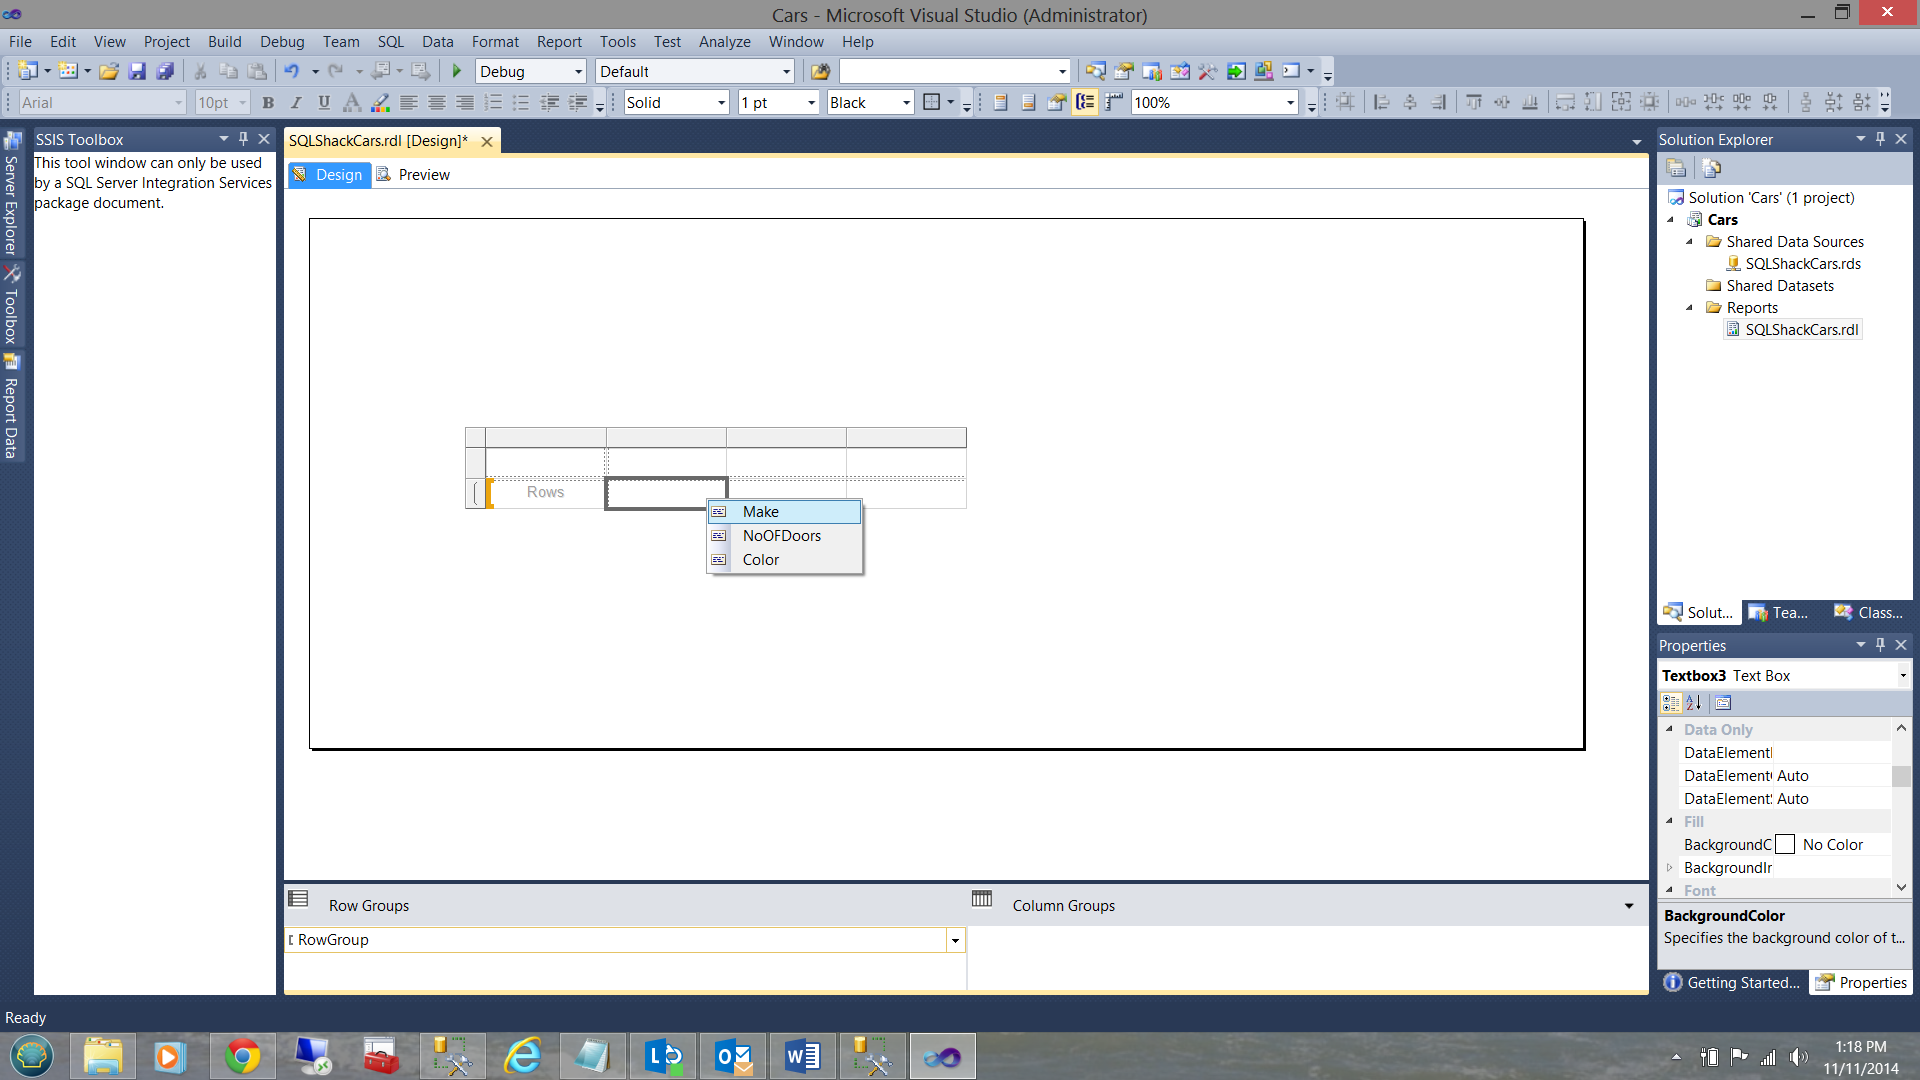
Above you will see the list of fields returned from the stored procedure. I remove the ‘Rows’ grouping box and then I place ‘Make’ in the first text box, ‘NoOFDoors’, in the second and ‘Color’ in the last text box. Please remember that they fields may be in any order. Further, the header name for the fields may be modified to something more meaningful.
The final Matrix layout may be seen below:
Testing and running our completed report
Once again, we click the preview button. Our parameter capture screen appears. We select all the colors (see below)

Next we set the ‘Car Make’. We only wish to see “Fords”
And last but not least we set the number of doors to “Select All”
The result of this query may be seen below:
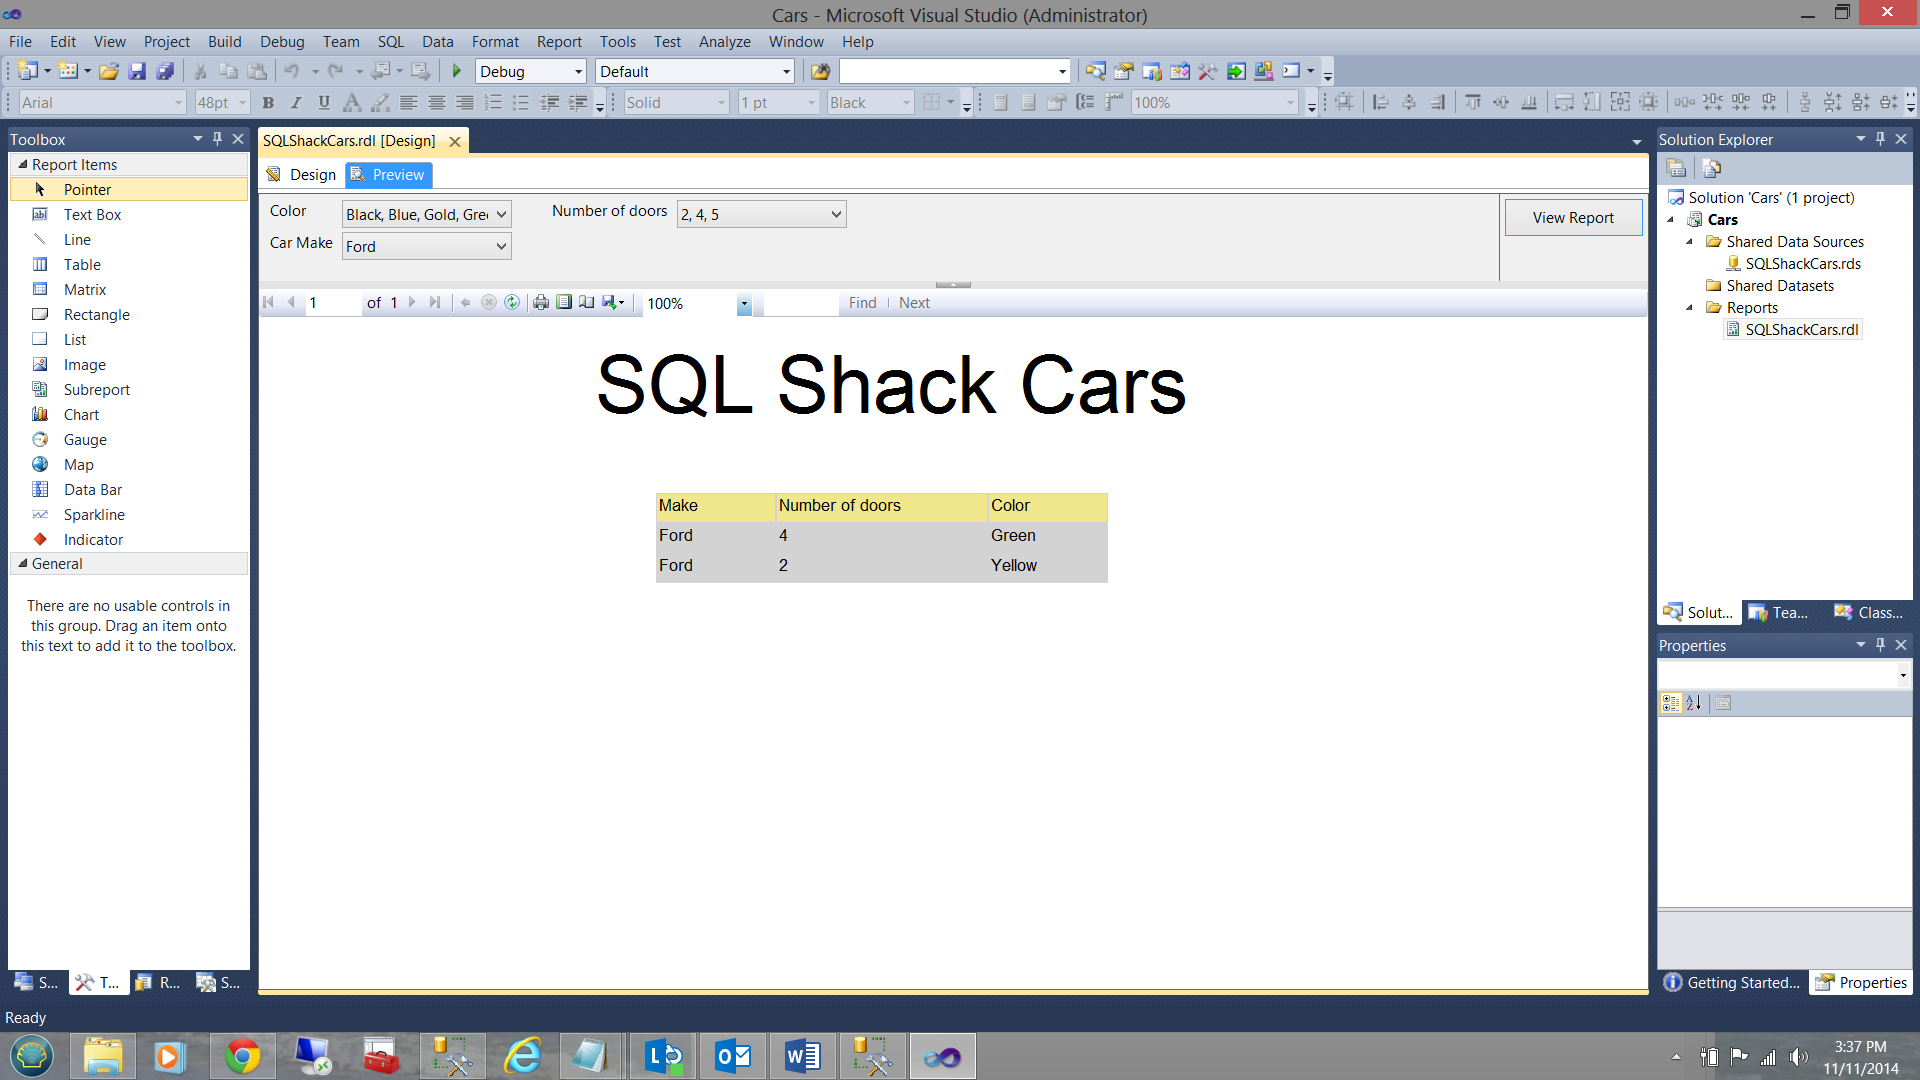
Thus we have completed our final report.
Conclusions
With development costs consistently on the rise and with more being demanded with fewer resources, we (as developers) must think outside the box and try to construct our reports etc. with a view to providing the end client with the best possible ‘user experience’. Often this requires making our reports more ‘all-encompassing’.
SQL Server Reporting Services combined with ‘Multiple Select’ parameters permit us to enhance our reports and provide users with this ‘ultimate experience’.
A last thought
The database and the Reporting Services package used in this article are available on request. They are complete, small and give you a feeling for what you could really achieve. Why not take them for a test drive?
Happy programming.
Steve has presented papers at 8 PASS Summits and one at PASS Europe 2009 and 2010. He has recently presented a Master Data Services presentation at the PASS Amsterdam Rally.
Steve has presented 5 papers at the Information Builders' Summits. He is a PASS regional mentor.
View all posts by Steve Simon
- Reporting in SQL Server – Using calculated Expressions within reports - December 19, 2016
- How to use Expressions within SQL Server Reporting Services to create efficient reports - December 9, 2016
- How to use SQL Server Data Quality Services to ensure the correct aggregation of data - November 9, 2016