

This article explores various ways to use a Web data source in Power BI Desktop reports.
Introduction
Information is widespread these days. You might get required data from Excel, CSV, text, PDF file, various relational and non-relational databases, SharePoint, etc. As you know, the internet provides us with an ability to view any data from any part of the World using web pages. We do not want to copy data from a webpage in an excel and then import it in Power BI Desktop.
Power BI gives you a lot of options to import data and prepare reports, visualizations for data interpretation. We can import data directly from a webpage using the Web data source.
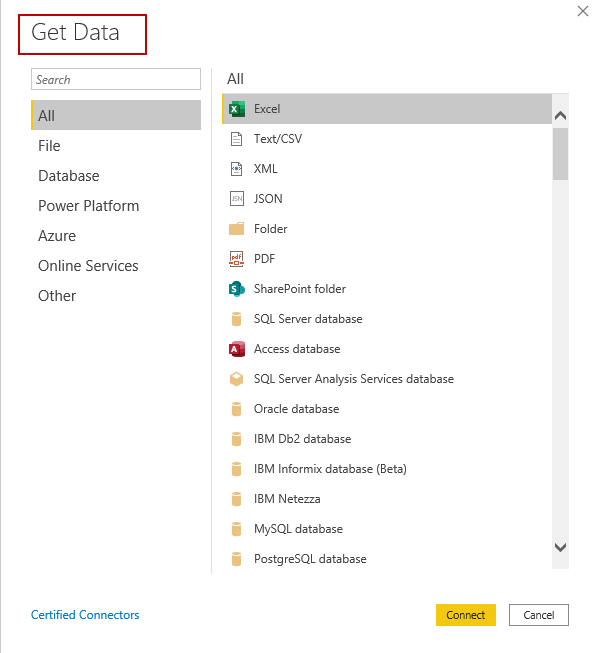
To view available data sources, launch Power BI Desktop and go to Get Data.
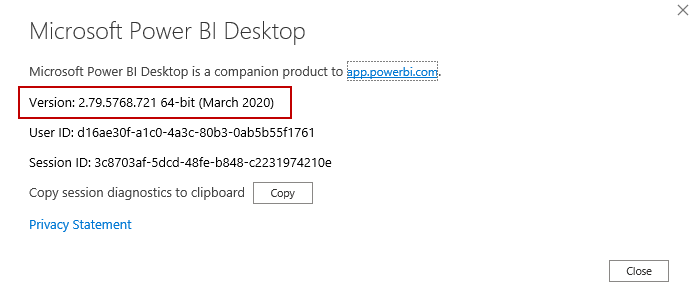
- Note: In this article, I use the March release of Power BI Desktop. You can use the URL to download the
latest version. It is always good to use the latest version to use all available features.

Import tables from a Webpage using a Web data source
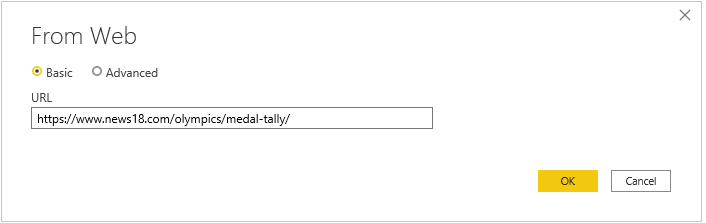
Suppose we are creating a report that uses Olympic 2016 medals tally data source. We need to get data from a web page. For this click on Get Data -> Web for it. Specify URL.
Click OK and allow anonymous access to the web page.

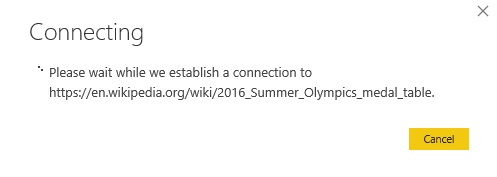
Once we click on Connect, it establishes a connection to the URL specified.
You get a list of autodetected tables from the web page. Select the appropriate table, get a preview and use it further.
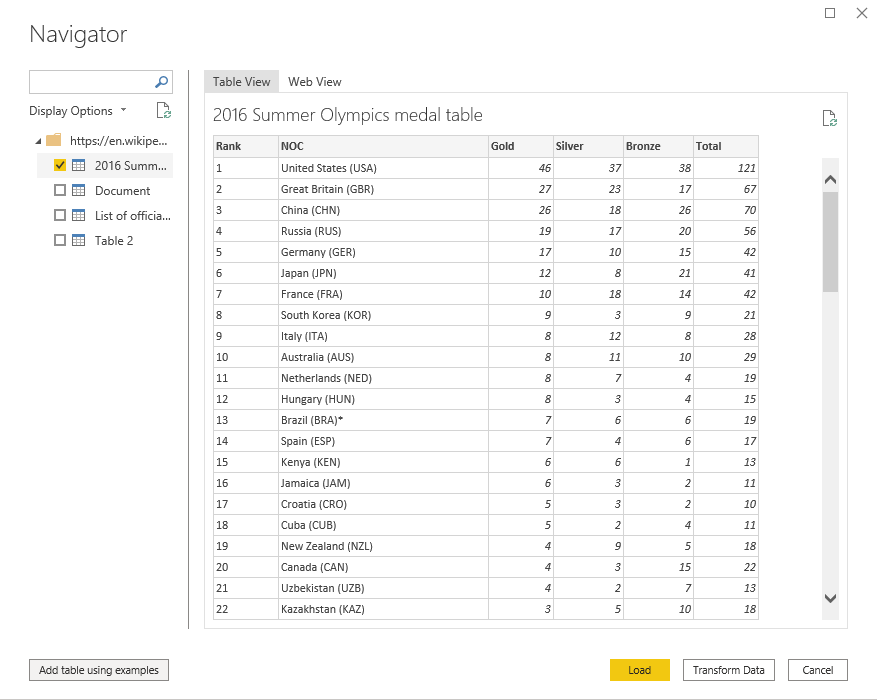
You can select the required table and load the data for creating a visualization. We use Transform Data to customize data based on our requirements. It allows us to remove duplicate values, create new columns, define table headers, use calculated columns etc.
We can create the report as it is out of scope for this article. You can refer Power BI articles on SQLShack for more details.
Add table using examples
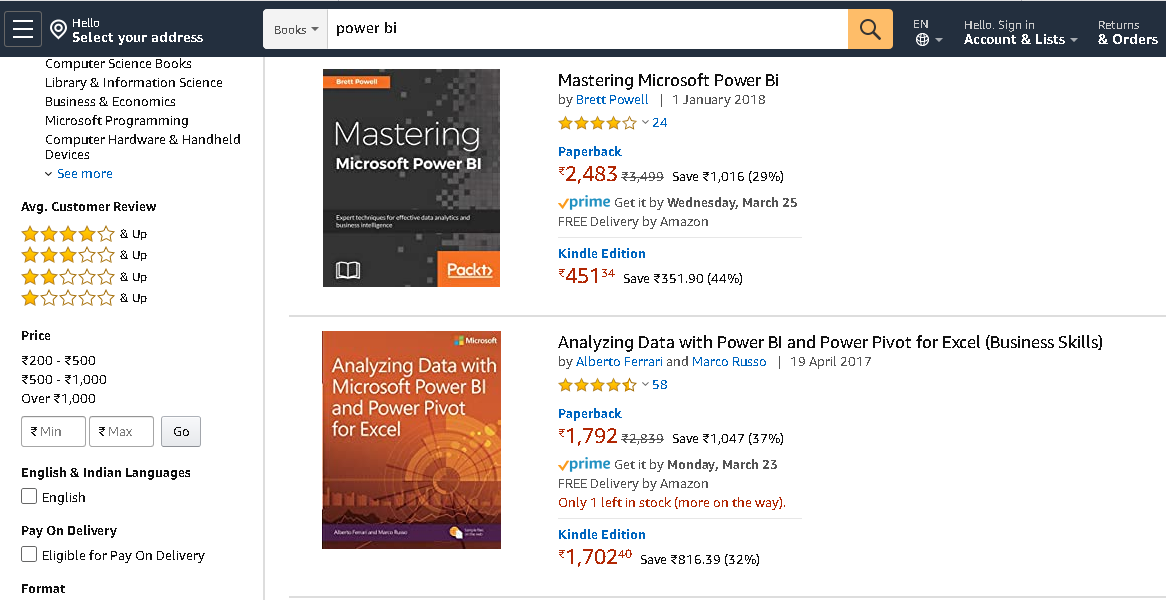
Suppose you want to explore the product and their prices from an online shopping website such as Amazon. Here, the web page does not contain any tables that we can import.
In the following screenshot, we have books listed on Amazon. We require to get the following field in a tabular format.
- Book Title
- Author Name
- Paperback book price
- Kindle edition price
As you know, we do not have this data in a tabular format on Amazon so think of a question – Can we import required data from Amazon for visualization?
Yes, we have a solution for it. Let’s explore it.
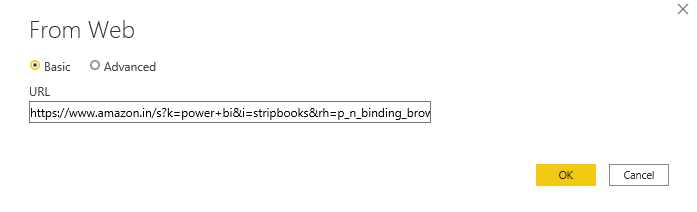
Click on Get Data-> Web. In the From Web, pop-up box paste into the web URL box that you copied from the web page.
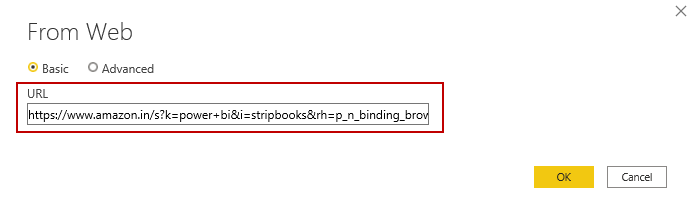
Click OK and see if it gives any tables to import data. We get a few tables, but it does not contain any useful information that we required in the source data.
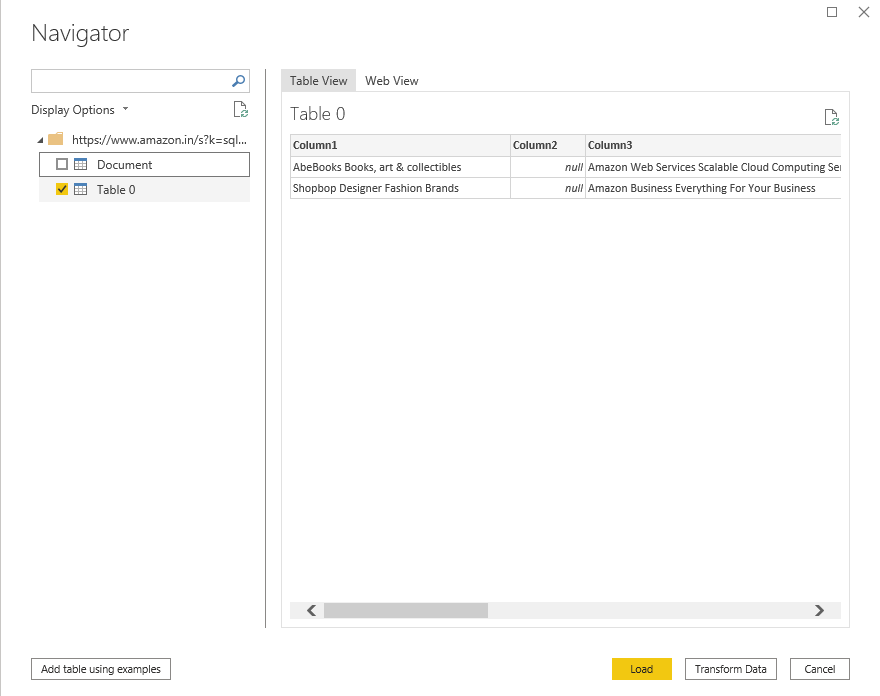
Look at the option Add table using examples in this data preview page.
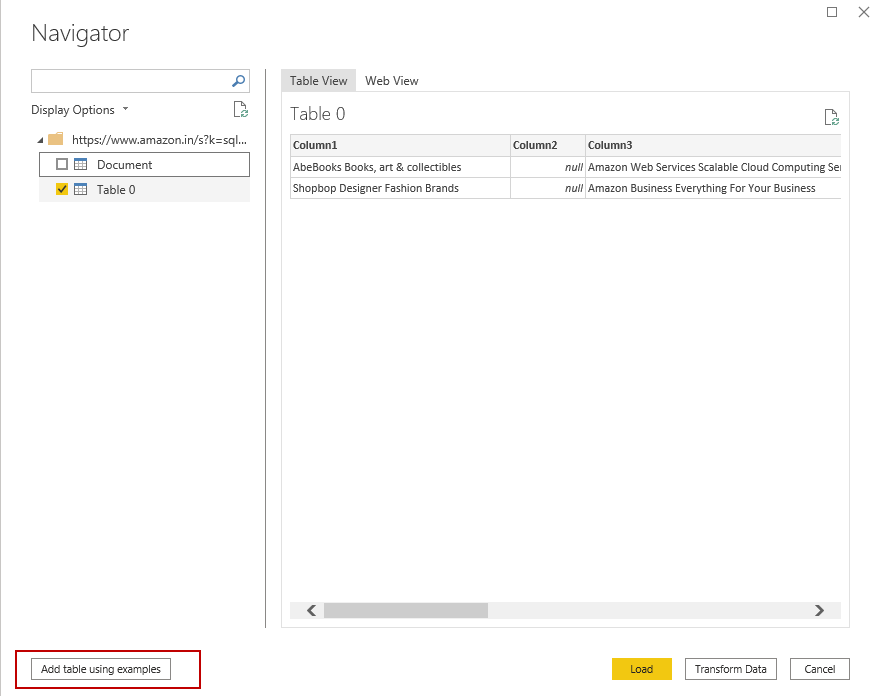
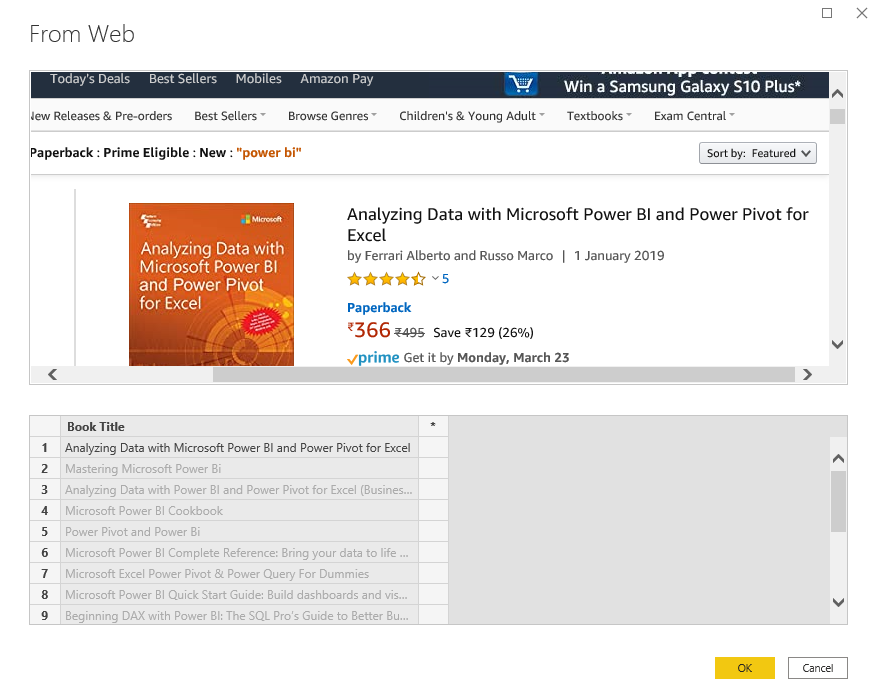
Click on the highlighted option, and you get an interactive window with the following information.
- First part shows the web page
- The second part shows an empty table. initially, it shows a single column
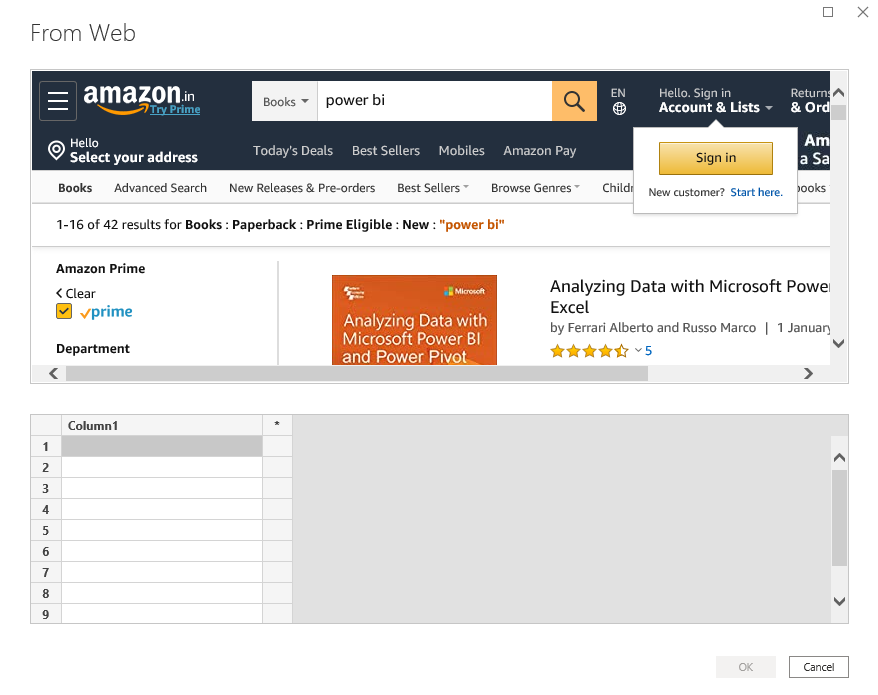
In the second part, we need to specify a sample of data that we wish to import. For example, we require a book title in this column.
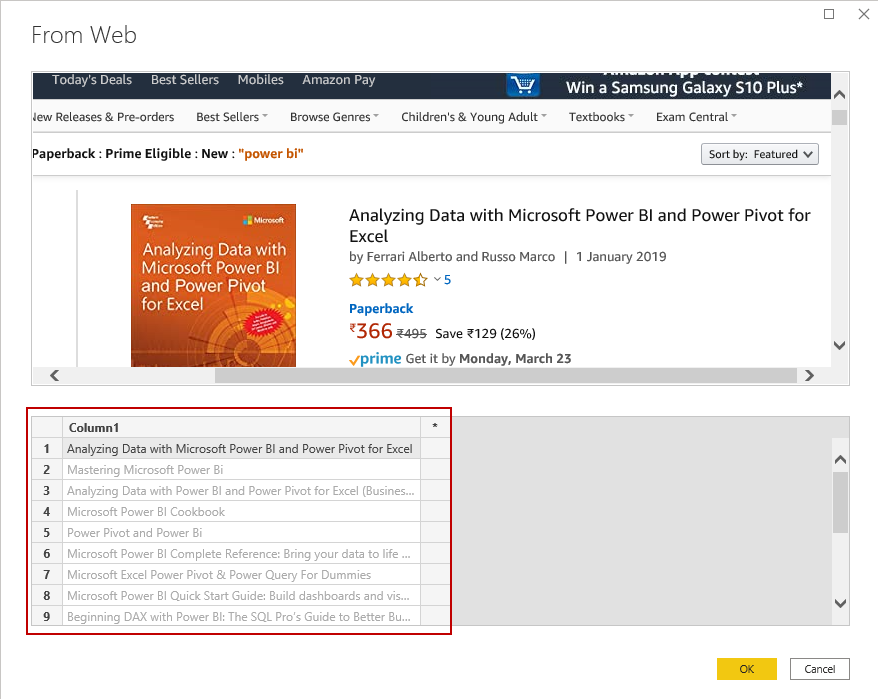
In column 1, type the text, and it gives suggestions for data from the web page. Select the required book title from the drop-down list.
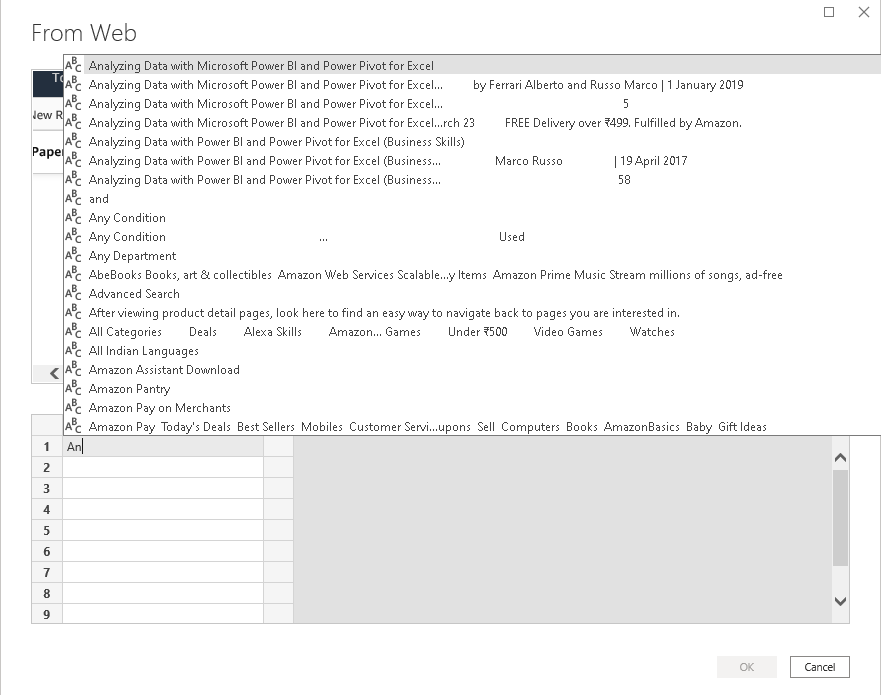
Once you select a value for column 1, Power BI automatically fills similar kinds of values (in this case book title) for other rows.
We can easily distinguish user entry and automated populated values. It shows user text in the regular font, but automated populated values are faded.
Double-click on column 1 and rename it to give an appropriate name. Here, we give it the name Book Title.
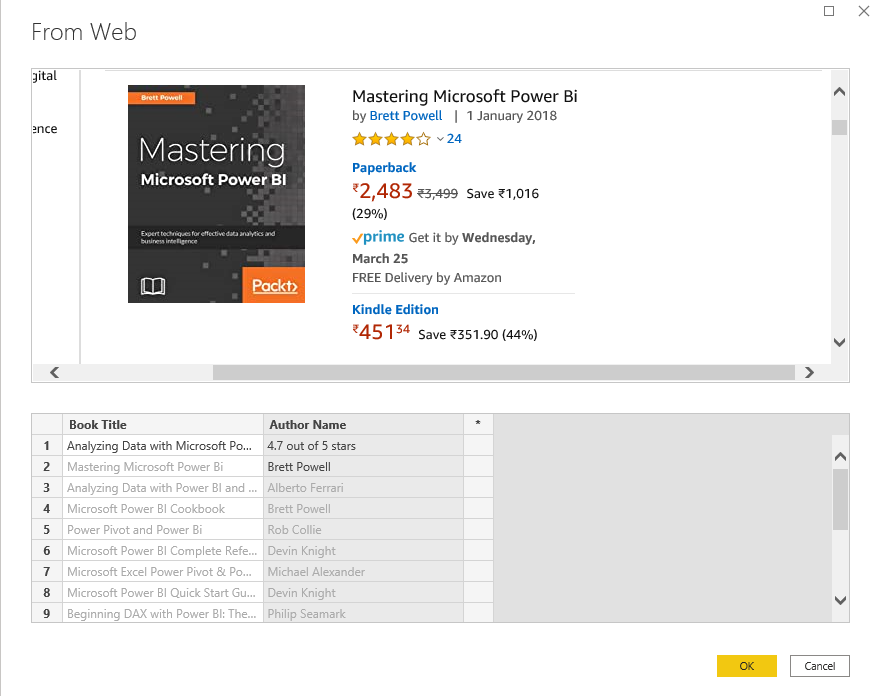
In the next column, we require a book author. Click on *, and it adds a new column in the dataset. It uses a few functions to look for data from the web page.
In the following screenshot, check that for row 1, we entered the star rating (4.7 out of 5 stars) while for the second row, we entered the author name. You might need to look at a few combinations to get the proper data. We can modify data later using the power query editor.
In the third column, add the cost of the paperback edition. Some of the books contain Kindle edition as well. The price for a kindle edition is different than the paper book. Let’s add a new column and type the price of a kindle book. Here, we get few blank rows because Web URL does not contain the relevant section (in this case kindle e-book price).
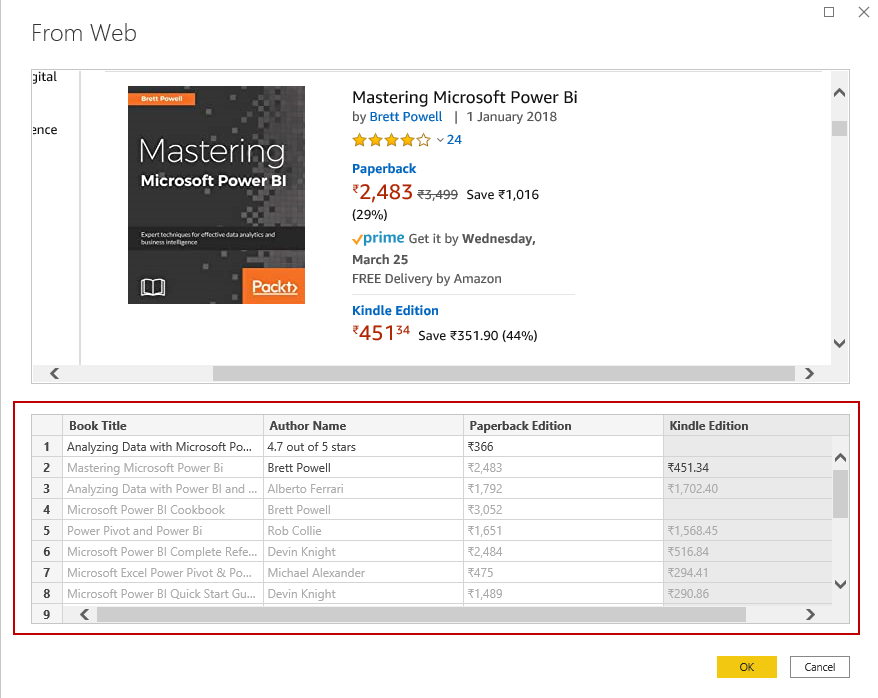
Now click OK, and it gives you a preview in the navigator window. You can directly load or transform data as per your requirements.
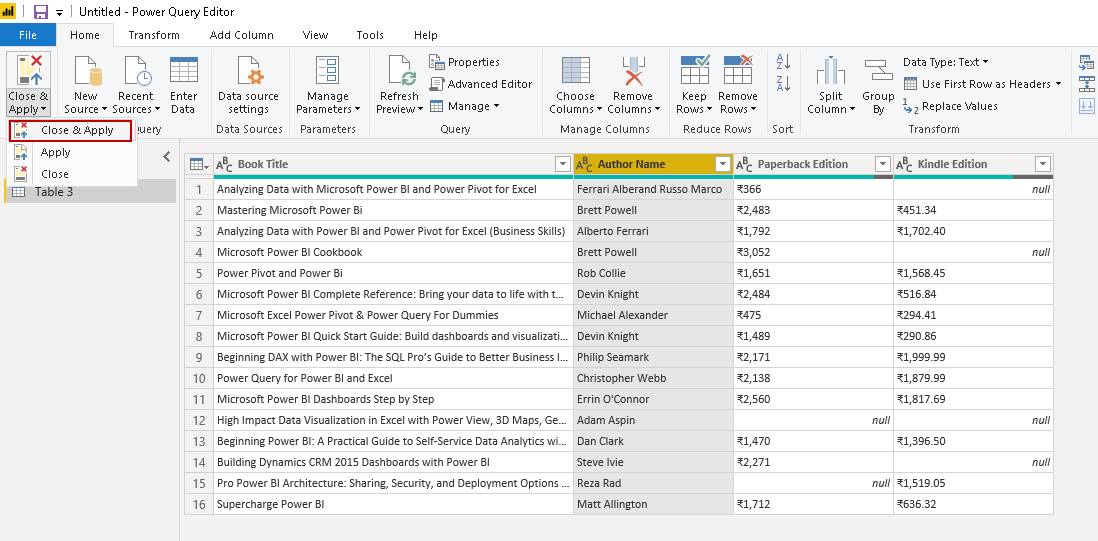
Click on Transform Data to edit the data in Power Query editor. Here, we have an incorrect Autor name in the first row.
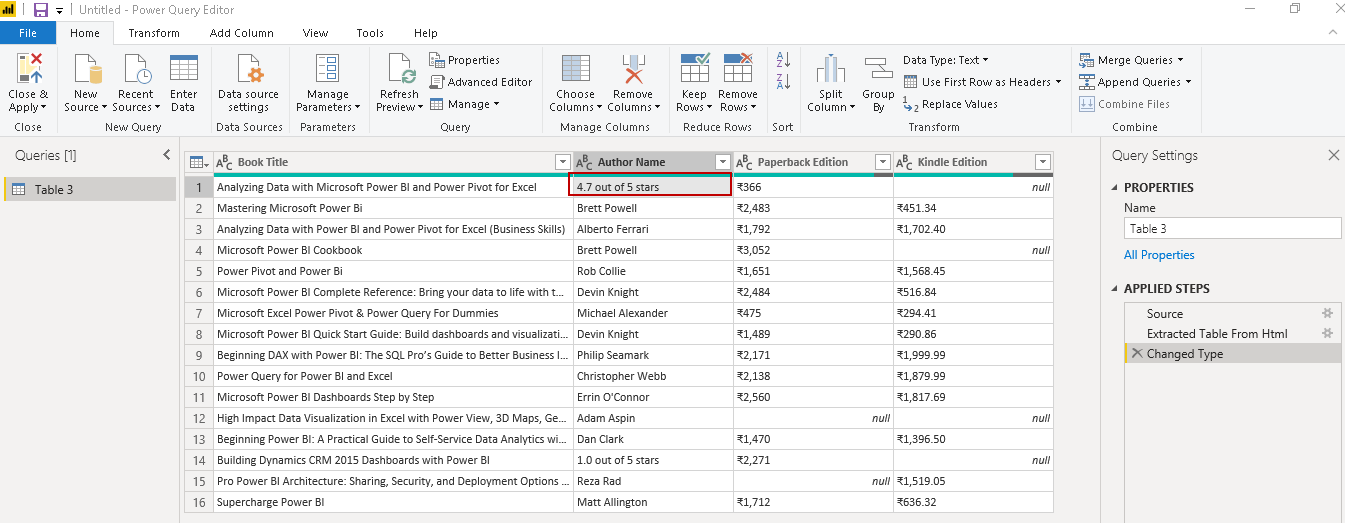
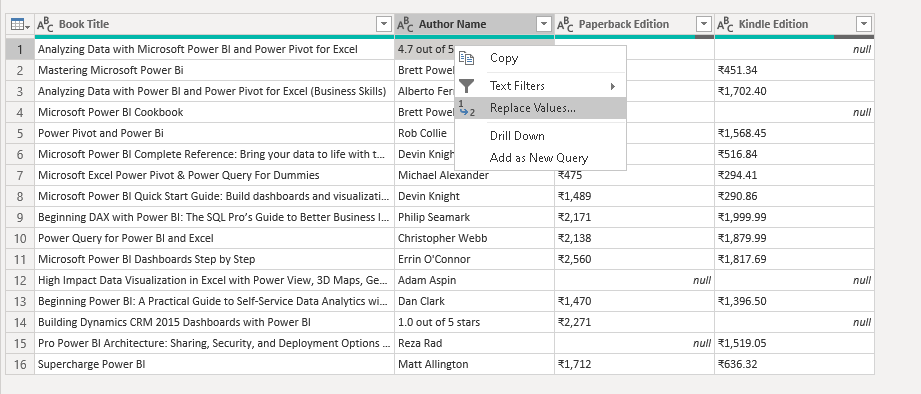
Right-click on the first row and replace the value.
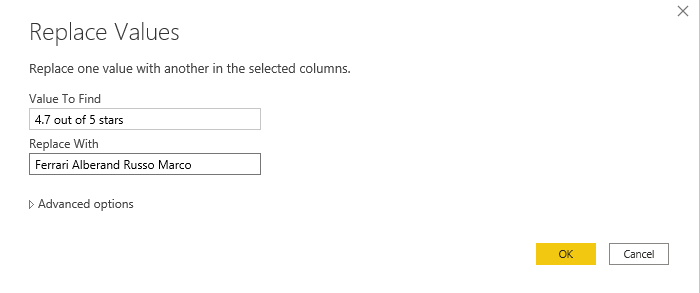
In the replace values, specify the new value to replace the existing value. You can verify the current value as well.
Similarly, I replaced the author’s name for row 13. We can see updated data, as shown below.
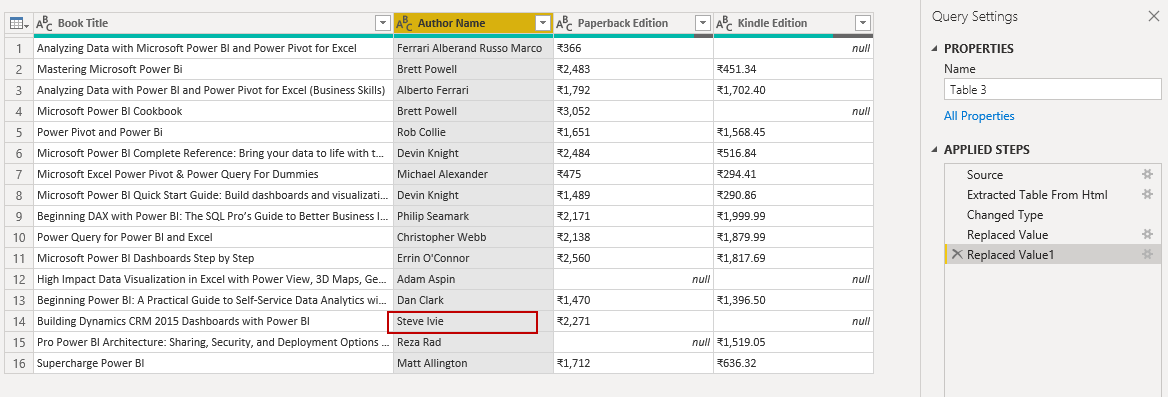
You can make further changes data as per your requirement. Once changes are done, click on Close & Apply to save the changes. If you want to discard changes, click on Close.
New Web table interference preview feature
In the above section, we saw that add tables using examples does not work correctly. We may need to try a specific combination to get table data. It cannot get accurate data after that. You may need to transform data, and it might be a tedious task for a large data set. In this section, we will look at the solution to this issue.
Power BI Desktop releases new features regularly in the monthly release. In these new features, few features come as a preview feature. We cannot directly start using the preview feature. To enable this feature, go to File-> Options and Settings -> Options. It opens various configuration options. Navigate to Preview features.
In the preview features list, put a check on New web table inference. It enables this preview feature.
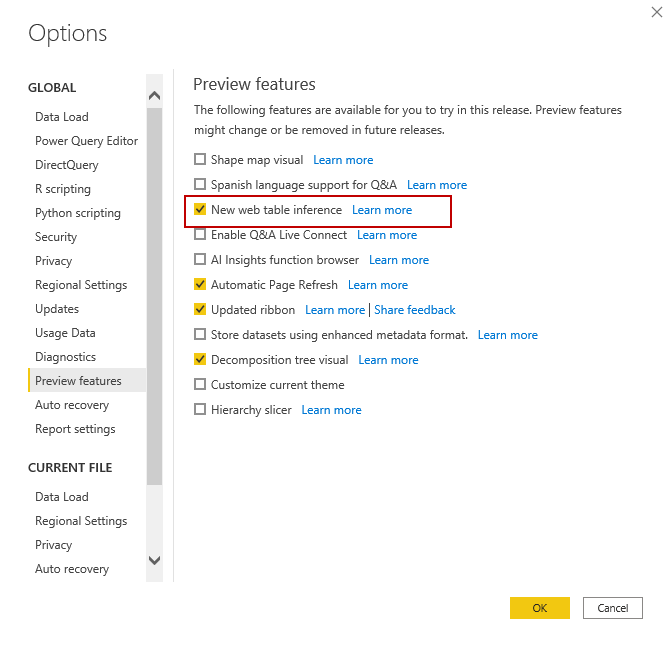
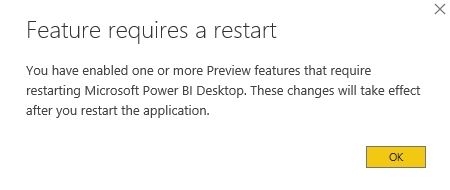
Click OK, and it asks you to restart Microsoft Power BI Desktop to use the recently enabled preview feature.
After a restart, again go to the web data source and specify the URL that we used in the earlier example.
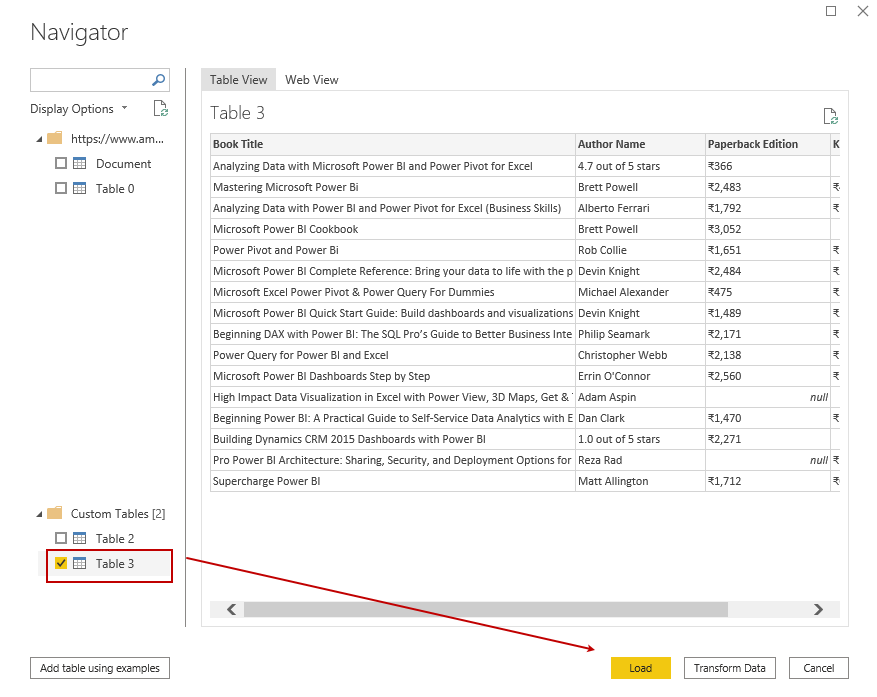
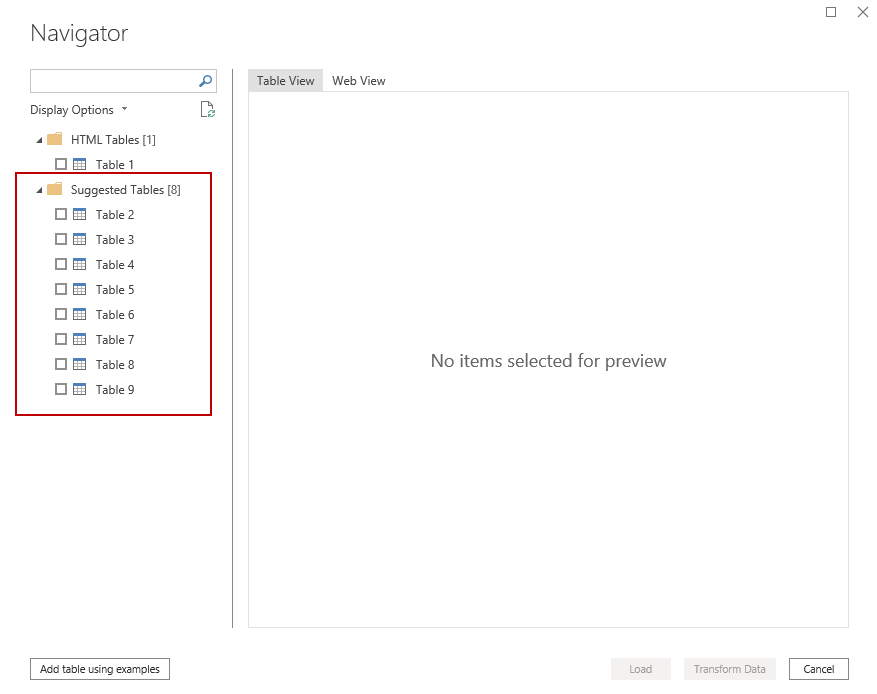
Click OK, and here you see a few suggested tables. These suggested tables come as part of the preview feature. Here, we see 8 table suggestions from the web page data source. These table suggestions entirely depend on the web page and the Power BI algorithm.
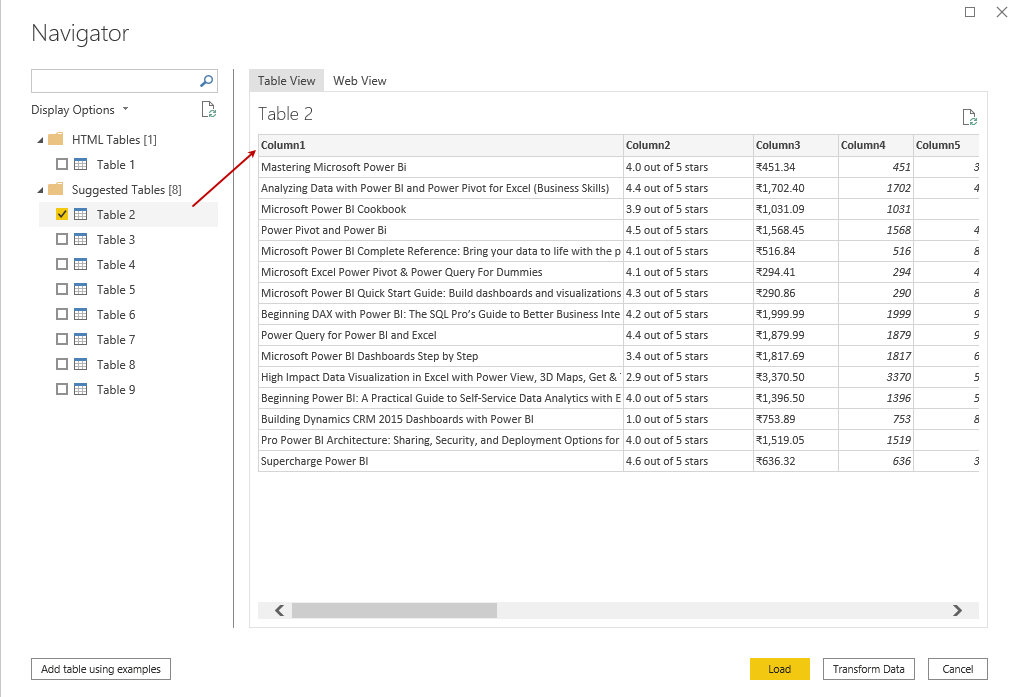
Put a check on a table, and it gives you a preview of the suggested tables. Select one that best suits our needs. In the following screenshot, you see table 2 with many useful columns.
You can still use the Transform Data and do required data changes.
- Note: New web table inference is still a preview feature. You might notice significant changes in the upcoming Power BI Desktop release. You should be a little cautious with using these features in production reports.
Conclusion
In this article, we explored different ways to import data from a Web data source. I am excited about the New Web table inference feature as well. You should explore this feature for your data requirements.

I am the author of the book "DP-300 Administering Relational Database on Microsoft Azure". I published more than 650 technical articles on MSSQLTips, SQLShack, Quest, CodingSight, and SeveralNines.
I am the creator of one of the biggest free online collections of articles on a single topic, with his 50-part series on SQL Server Always On Availability Groups.
Based on my contribution to the SQL Server community, I have been recognized as the prestigious Best Author of the Year continuously in 2019, 2020, and 2021 (2nd Rank) at SQLShack and the MSSQLTIPS champions award in 2020.
Personal Blog: https://www.dbblogger.com
I am always interested in new challenges so if you need consulting help, reach me at rajendra.gupta16@gmail.com
View all posts by Rajendra Gupta
- Understanding PostgreSQL SUBSTRING function - September 21, 2024
- How to install PostgreSQL on Ubuntu - July 13, 2023
- How to use the CROSSTAB function in PostgreSQL - February 17, 2023