

In this article, we are going to talk about the various analytic functions that are supported by the SQL Server Database Engine. As it goes by the name, these are some special functions using which we can execute analytic queries on the dataset and obtain useful results. In comparison to standard SQL queries, sometimes it becomes necessary for the Data Analysts to deep dive into the data more and obtain insights from analytic perspectives. This article will discuss all the analytic functions supported by SQL Server with some details.
Analytic Functions supported by SQL Server
Since the introduction of SQL Server 2012, the analytic functions were added to the SQL Server database engine. Any version of SQL Server after SQL Server 2012 can execute analytic queries on it. These functions are used to calculate an aggregated value from the dataset but are based on a specific set of rows instead of the entire dataset. As compared to aggregate functions like SUM, COUNT, AVG, etc. which return scalar records, these functions can return multiple records based on the conditions. The most common examples of using these functions are to find moving averages, running totals, etc. SQL Server supports the following analytic functions.
- CUME_DIST – Find the cumulative distribution of a numerical column
- FIRST_VALUE – Finds the first value of a column from the group and prints the same for each row
- LAST_VALUE – Finds the last value of a column from the group and prints the same for each row
- LAG – Reads values after the specified number of rows for a column
- LEAD – Reads values before the specified number of rows for a column
To understand the use of all these functions practically, we will create some dummy data in our database and then execute the respective queries. You can use the following script to create the table and the data to follow along with the tutorial:
https://gist.github.com/aveek22/f0d7cf29af149bbc11fb3ba0e2d5e4fc
Once the table is created and data dummy data populated in the table, you can move to the next sections.
Using the CUME_DIST function
The CUME_DIST function is used to calculate the cumulative distribution of a value within a group of rows in the table. In statistics, the cumulative distribution function, also known as CDF is used to predict the probability of a given random variable is given by the number of values less than or equal to the number itself. In simple terms, it can be obtained, by calculating the number of total rows in the sample and then dividing the RANK of the row by the number of total rows in the sample. For a better understanding, you can run the following query.
|
1 2 3 4 5 6 7 8 |
SELECT LaptopName, LaptopBrand, ReleasedYear, DeviceType, Price, CUME_DIST() OVER(ORDER BY Price) AS PriceDistribution FROM [dbo].[Laptops] |
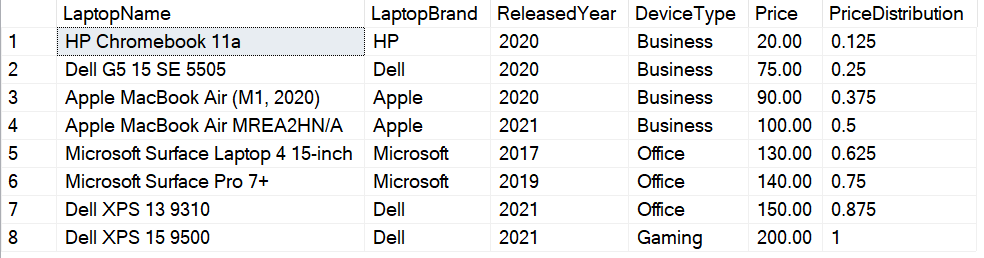
Figure 1 – Cumulative Distribution
As you can see in the figure above, the cumulative distribution is displayed by the column PriceDistribution. This column provides the cumulative distribution of the rows based on the Price column. It shows that the distribution is not affected by the number of records in the group, but instead by the number of distinct values of the column on which the distribution is being calculated.
In order to explain the working of the query better, I am going to try it break down the calculations into much simpler steps and explain how the distribution is achieved. I am going to perform the following steps one after another and obtain the same results as in the function.
- Select a unique combination of all the records including the values of the column on which the distribution is to be calculated. In this case, it is the Price column
- Calculate the RANK for each row in the table
- Calculate the total number of records in the list
- Divide the RANK by the total number of records to obtain the cumulative distribution values
|
1 2 3 4 5 6 7 8 |
SELECT LaptopName, Price ,RANK() OVER(ORDER BY Price) AS RowRank ,8 AS TotalRecords ,RANK() OVER(ORDER BY Price)/8.0000 AS PriceDistribution_Manual ,CUME_DIST() OVER(ORDER BY Price) AS PriceDistribution_ByCumeDist FROM [dbo].[Laptops] |
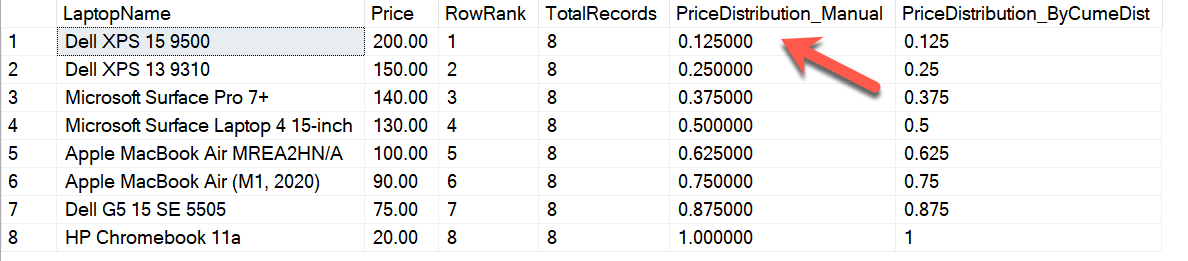
Figure 2 – Calculating Cumulative Distribution manually
In the above figure, as you can see, the manual calculation of the cumulative distribution is obtained by dividing the RANK of the records by the total number of records in the dataset under observation. For example, if we consider the first records, the rank of this row is 1 and the total number of records is 8. Therefore, the cumulative distribution will be 1/8 = 0.125. Similarly, for the 4th record, the value is 0.5. This means that 50% of all the records under this observation lie below this value for Price.
We can also calculate the cumulative distribution based on a group of records in the dataset. This can be done by specifying the column to be grouped in the PARTITION BY clause.
|
1 2 3 4 5 6 7 8 |
SELECT LaptopName, LaptopBrand, ReleasedYear, DeviceType, Price, CUME_DIST() OVER(PARTITION BY DeviceType ORDER BY Price) AS PriceDistribution FROM [dbo].[Laptops] |
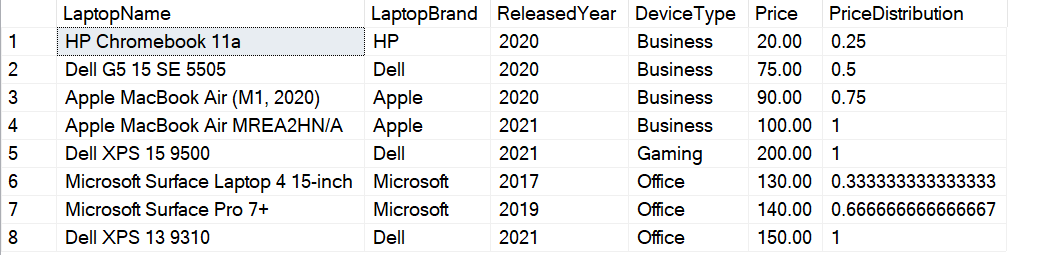
Figure 3 – Cumulative Distribution for a group
As it can be seen in the figure above, the PriceDistribution is now being calculated for each of the values in the DeviceType column. Since there are four rows for the value “Business”, so each of the rows is calculated based on the 4 records. In this way, cumulative distribution for a particular group can also be calculated.
Using the FIRST_VALUE and the LAST_VALUE analytic functions
This is a character-based analytic function that returns the first-row value of the column from a group of records. For example, it will repeat the value from the first record for each of the records specified in the observation. You can refer to the following query for a demonstration of the FIRST_VALUE function.
|
1 2 3 |
SELECT LaptopName, LaptopBrand, ReleasedYear, DeviceType, Price, FIRST_VALUE(LaptopName) OVER(ORDER BY Price) AS FirstValue FROM [dbo].[Laptops] |
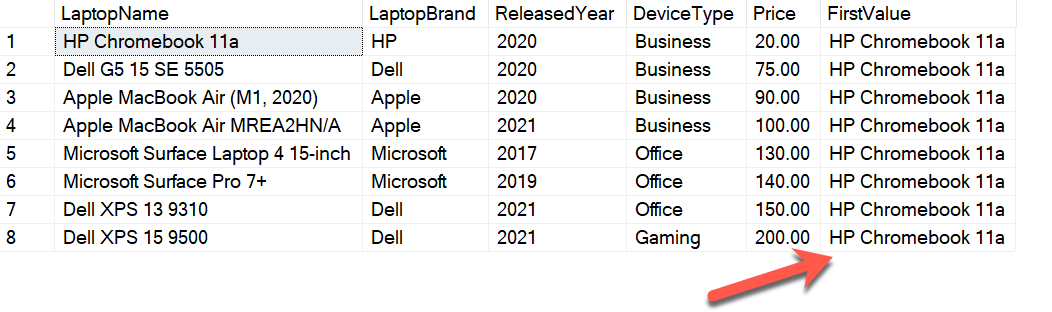
Figure 4 – Using the FIRST_VALUE function
As you can see in the figure above, the first value from the column LaptopName appears for each of the records in the dataset. In addition to this, the FIRST_NAME function can also be applied to a group of records in the dataset just as the same way we did for the cumulative distribution function.
|
1 2 3 |
SELECT LaptopName, LaptopBrand, ReleasedYear, DeviceType, Price, FIRST_VALUE(LaptopName) OVER(PARTITION BY LaptopBrand ORDER BY Price) AS FirstValue FROM [dbo].[Laptops] |
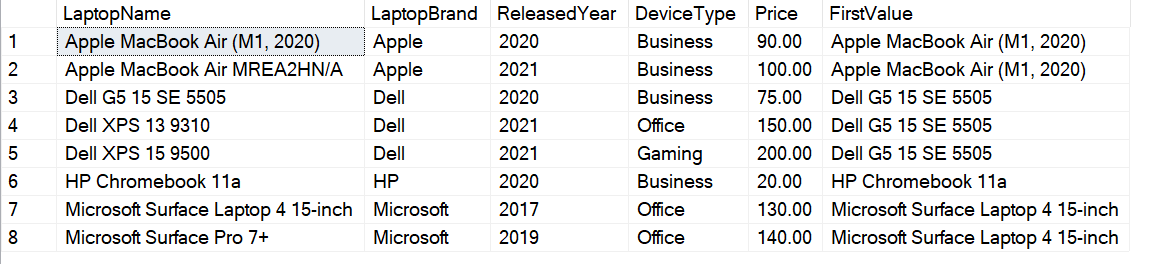
Figure 5 – First Value for each of the laptop brands
As you can see in the figure above, the FirstValue column now holds values based on each of the values from the LaptopBrand column.
Similar to the above, the LAST_VALUE function in SQL Server will calculate the last value based on the entire dataset, or based on the group of records if a specific column will be provided in the PARTITION BY clause. However, as compared to the FIRST_VALUE, it will only return the value for the current row instead of the last value for the entire set. You can use the following queries to use the LAST_VALUE function.
|
1 2 3 |
SELECT LaptopName, LaptopBrand, ReleasedYear, DeviceType, Price, LAST_VALUE(LaptopName) OVER(ORDER BY Price) AS LastValue FROM [dbo].[Laptops] |
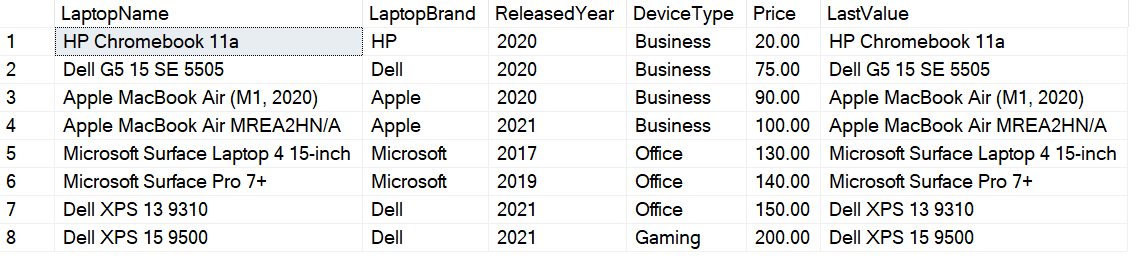
Figure 6 – Using the LAST_VALUE function in the query
In order to print the last value for the entire dataset, you can use the following query.
|
1 2 3 4 |
SELECT LaptopName, LaptopBrand, ReleasedYear, DeviceType, Price, LAST_VALUE(LaptopName) OVER(ORDER BY Price ROWS BETWEEN UNBOUNDED PRECEDING AND UNBOUNDED FOLLOWING) AS LastValue FROM [dbo].[Laptops] |
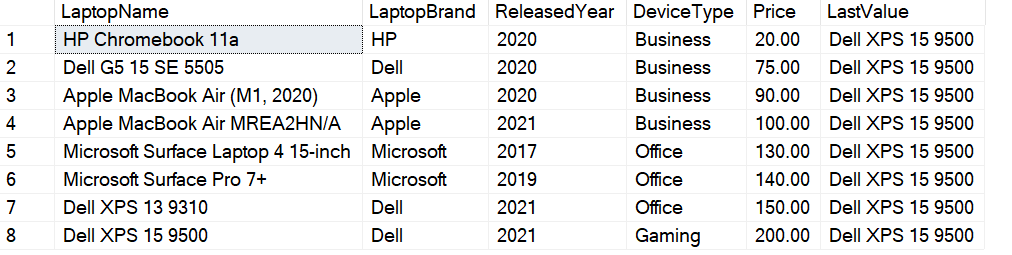
Figure 7 – Using the LAST_VALUE function
Using the LEAD and LAG analytic functions
Lead and lag are two common analytic functions that are used to find next or previous values for a given column respectively. Both these functions accept an offset parameter to decide how many rows should be the lead or the lag function consider before printing the result. You can use the following queries to use the LEAD and the LAG functions.
|
1 2 3 4 |
SELECT LaptopName, LaptopBrand, ReleasedYear, DeviceType, Price, LEAD(LaptopName,1) OVER(ORDER BY Price) AS FirstOffset, LEAD(LaptopName,2) OVER(ORDER BY Price) AS SecondOffset FROM [dbo].[Laptops] |
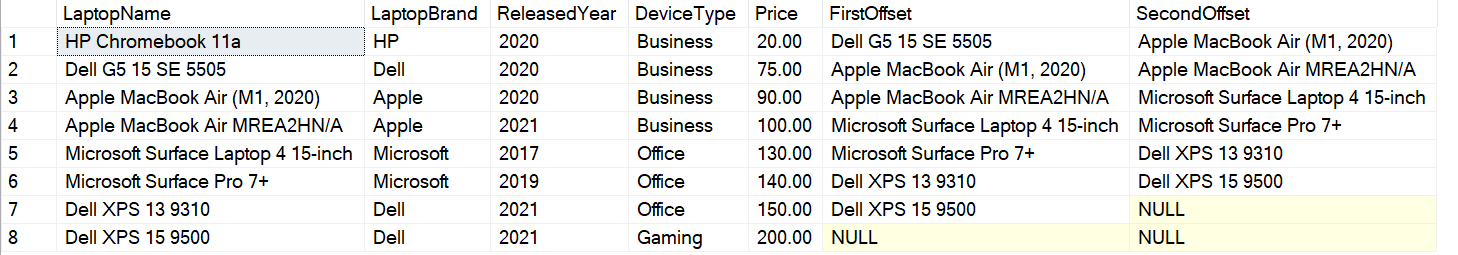
Figure 8 – Using the LEAD function
Similarly, the LAG function can be used as follows.
|
1 2 3 4 |
SELECT LaptopName, LaptopBrand, ReleasedYear, DeviceType, Price, LAG(LaptopName,1) OVER(ORDER BY Price) AS FirstOffset, LAG(LaptopName,2) OVER(ORDER BY Price) AS SecondOffset FROM [dbo].[Laptops] |
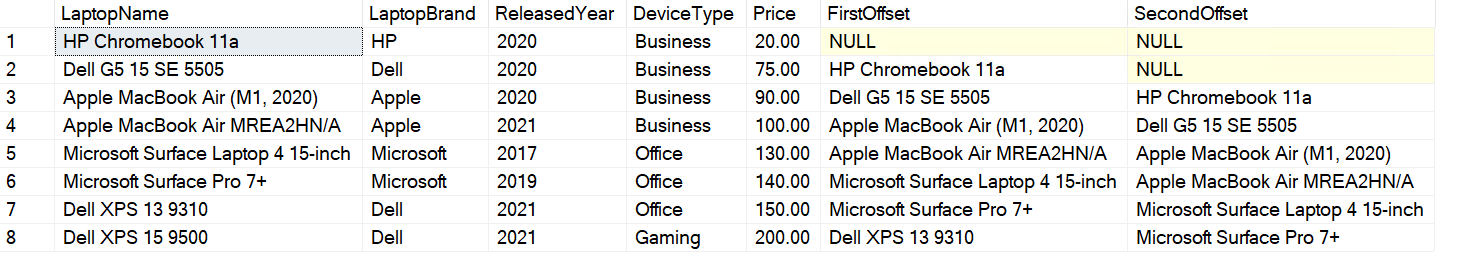
Figure 9 – Using the LAG function
Conclusion
In this article, we have discussed the various analytic functions supported by SQL Server. These are some special functions that are used to perform analysis over a specific number of rows from the dataset. These analytic functions were first introduced in SQL Server in SQL Server 2012 version. Once you master these functions in SQL Server, it becomes very easy to understand how to apply these functions to the entire dataset or a selected set of data. In addition to these analytic functions, you can also perform simple aggregations on the results obtained after executing the analytic queries.
To learn more about these queries in detail, you can follow the official documentation from Microsoft.

He is a prolific author, with over 100 articles published on various technical blogs, including his own blog, and a frequent contributor to different technical forums.
In his leisure time, he enjoys amateur photography mostly street imagery and still life. Some glimpses of his work can be found on Instagram. You can also find him on LinkedIn
View all posts by Aveek Das
- Getting started with PostgreSQL on Docker - August 12, 2022
- Getting started with Spatial Data in PostgreSQL - January 13, 2022
- An overview of Power BI Incremental Refresh - December 6, 2021