
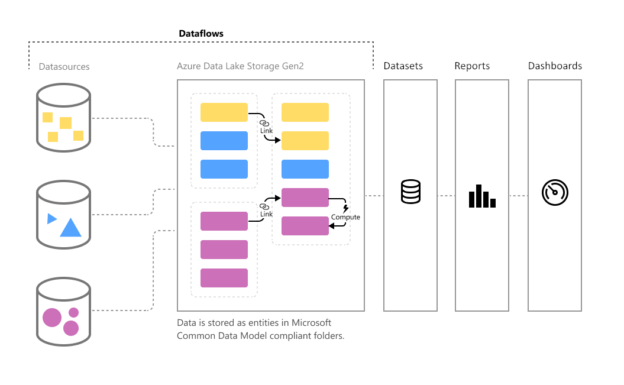
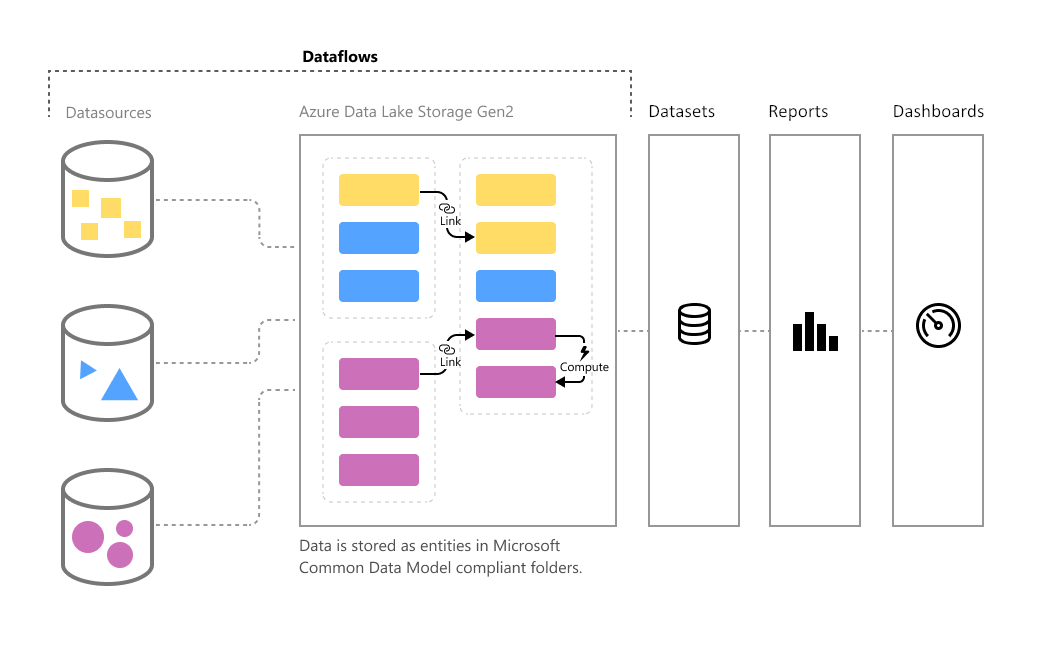
In this article, we are going to understand what the Power BI Dataflows is all about and how we can get started by building dataflows in Power BI Service. A dataflow can simply be considered as an extract transform and load pipeline that can be used to connect to source data, transform the data by applying business rules, and then finally preparing the data to be available to visualize. In a general data architecture, a dedicated ETL tool is used to prepare and transform the data, which is then loaded into a data warehouse. Power BI was used to connect to this data warehouse and visualize the data from here on.
Building such an enterprise-grade data integration pipeline is time-consuming and needs a lot of design considerations and guidelines as well. Often at times, the businesses move so fast that it becomes difficult for the IT team to keep up with the pace of the fast-moving business requirements. To overcome this challenge, Microsoft has developed this fully managed data preparation tool for Power BI, which can be used not only by developers but also by business users to quickly connect to data sources and prepare the data for reporting and visualization. Let us now understand some more in-depth concepts that revolve around the Power BI Dataflows.
What is a Dataflow?
A dataflow is a simple data pipeline or a series of steps that can be developed by a developer or a business user. Using this pipeline, data can be fetched into the Power BI service from a wide variety of sources. You can consider it similar to Power Query on the cloud. As most of the Power BI developers might be already aware of data transformation using the Power Query tool in the Power BI Desktop. Power Query had a big limitation that you cannot reuse your transformations within other Power BI reports. Personally, I felt that to be quite frustrating as I need to copy existing code from one report to another in order to implement the same logic. This was also a headache when a simple logic had to be changed, and we manually had to update the logic in all the Power BI reports that were implemented.
Dataflows come to the rescue on that part. Using the Power BI Dataflows, you can easily create reusable data integration pipelines that can be used in one or more Power BI reports. You can also share your dataflows with other users within the organization, and they can leverage the dataflow as well. This is really helpful as you do not need to maintain any extra overhead when the logic gets changed. If you update your dataflow, all the downstream dataflows automatically reflect the new logic. Now that we have some idea about Power BI Dataflows, let us go ahead and create one.
Creating Power BI Dataflows
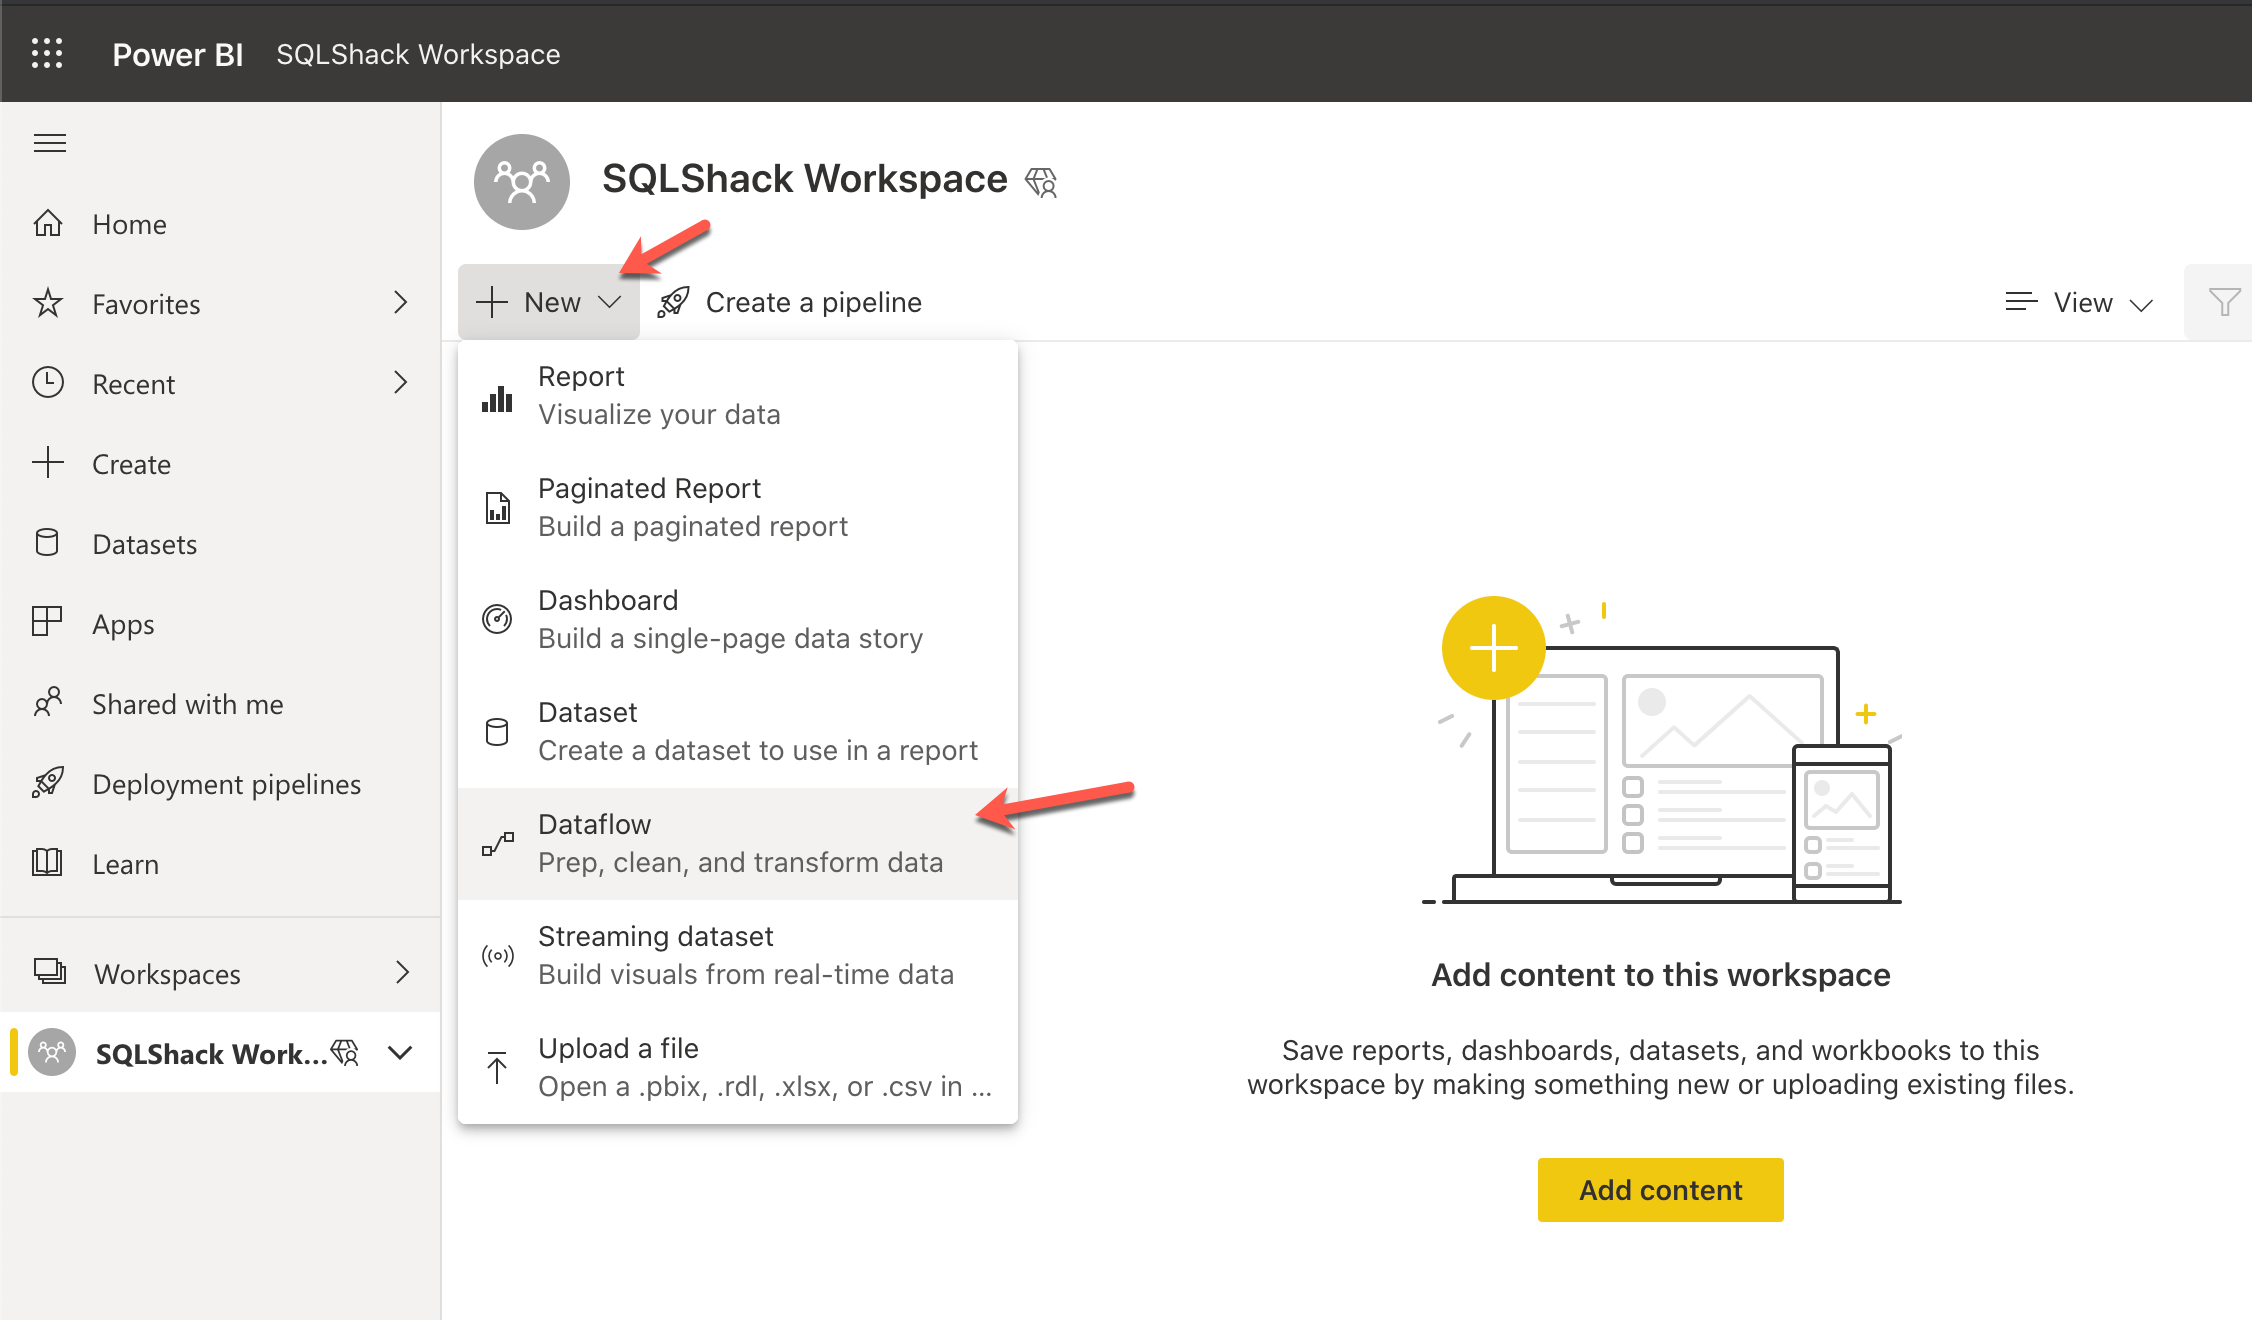
Let us navigate to the Power BI service and create a new workspace for this exercise. I am going to create one workspace with the name “SQLShack Workspace”. An important thing to note here is that the dataflows are only available with the Pro or the Premium version of the Power BI service. If you are using the standard version, then there won’t be an option to create or use the dataflows. Once the workspace is created, let us create a new Dataflow.
Click on New and then select Dataflow from the dropdown.
This will open up a new page where you can start creating your dataflows. There are four ways in which you can create a dataflow in the Power BI service.
- Define new entities – Everything is an entity in a Power BI Dataflow. You should choose this option if you are building a dataflow from scratch by importing data into the Power BI model. This will also allow us to map our data model to the common data models like Accounts, Orders, etc
- Link entities from other dataflows – This is used when you would like to link a new dataflow to an existing one so that you can already leverage the business logic implemented in that dataflow. The existing dataflow can only be available in a read-only fashion and there cannot be any edits to that
- Import Model – This option allows us to choose a reference dataflow in a read-write fashion and allows us to alter the logic defined in the existing dataflow. However, in this method, a new dataflow is created, which contains the logic of the original dataflow and the added logics that were implemented in this dataflow only. The original dataflow remains untouched
- Attach a Common Data Model folder – This method allows us to choose an existing common data model folder that has already been created by some other dataflow. Power BI Dataflows, under the hood, basically creates a folder structure of the common data model on Azure Data Lake Gen2. This is usually kept hidden from the users as they need not need to know about the complexities involved in this method
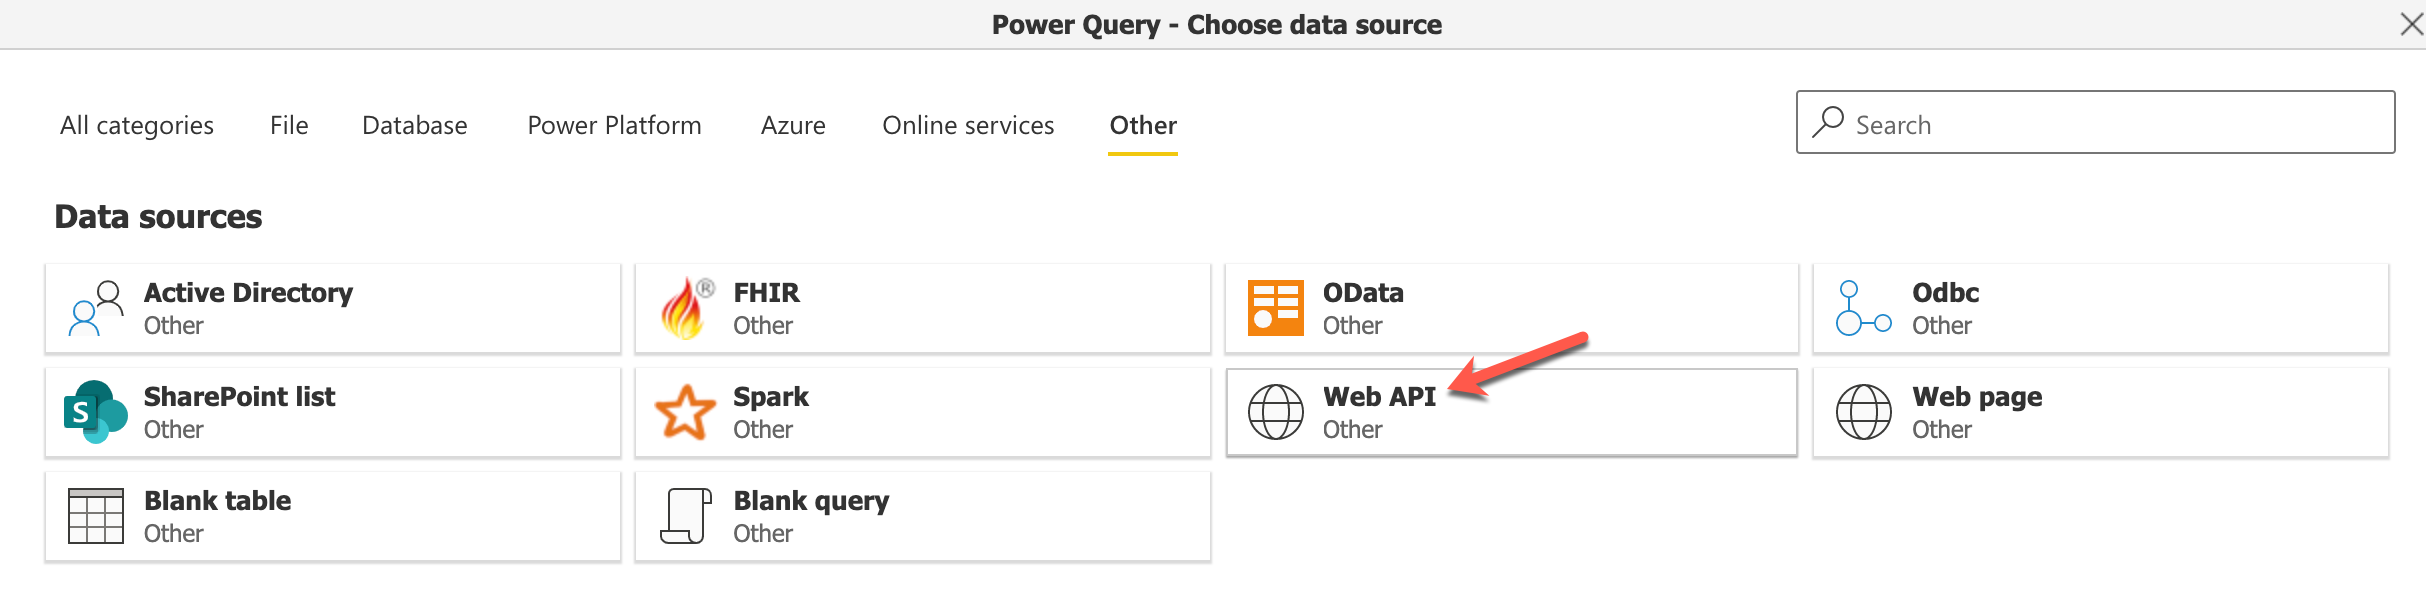
Let us proceed by selecting the Define new entities option and create a new dataflow. I am going to select the Web API File format from the Data sources under the Other tab. I will be using a fake web API for demonstration purposes; however, you are free to choose any one of the available data sources.
I am going to use the following fake web API data and fetch it to the Power BI Dataflows.
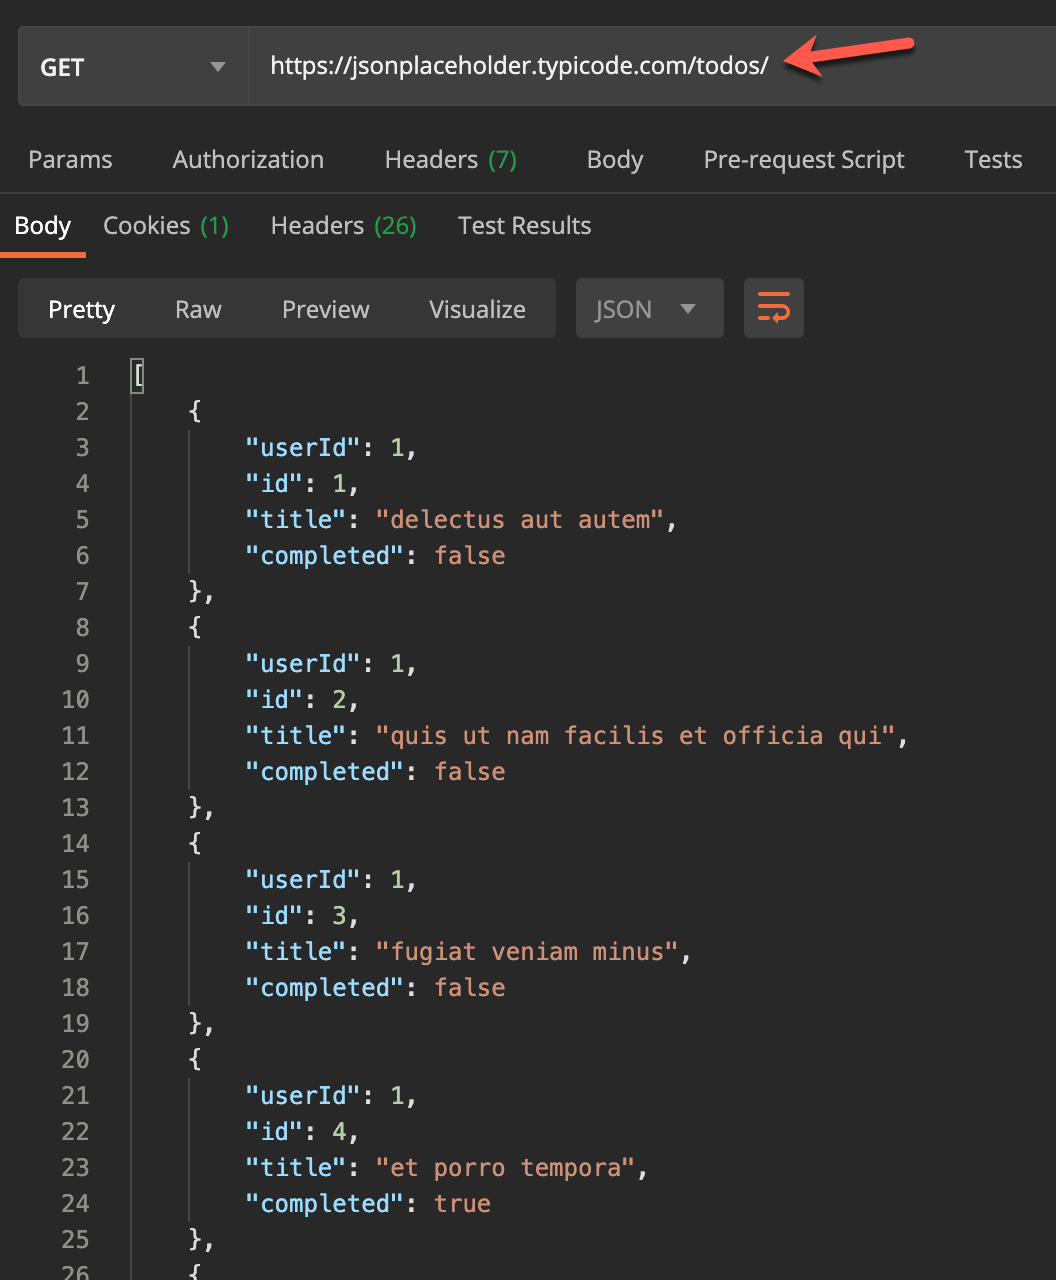
As you can see in the figure above, we have four fields in this dataset as follows.
- userId
- id
- title
- completed
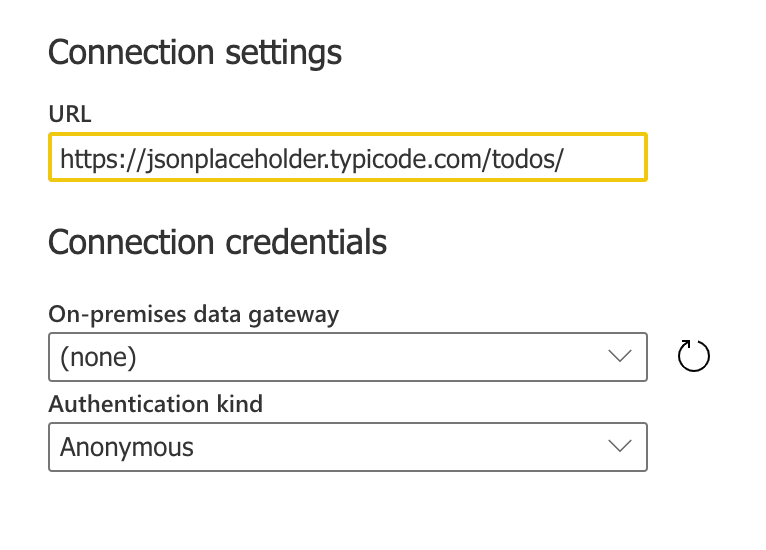
Let us use this API in the dataflow as well and pull in the data. Provide the URL and click Next.
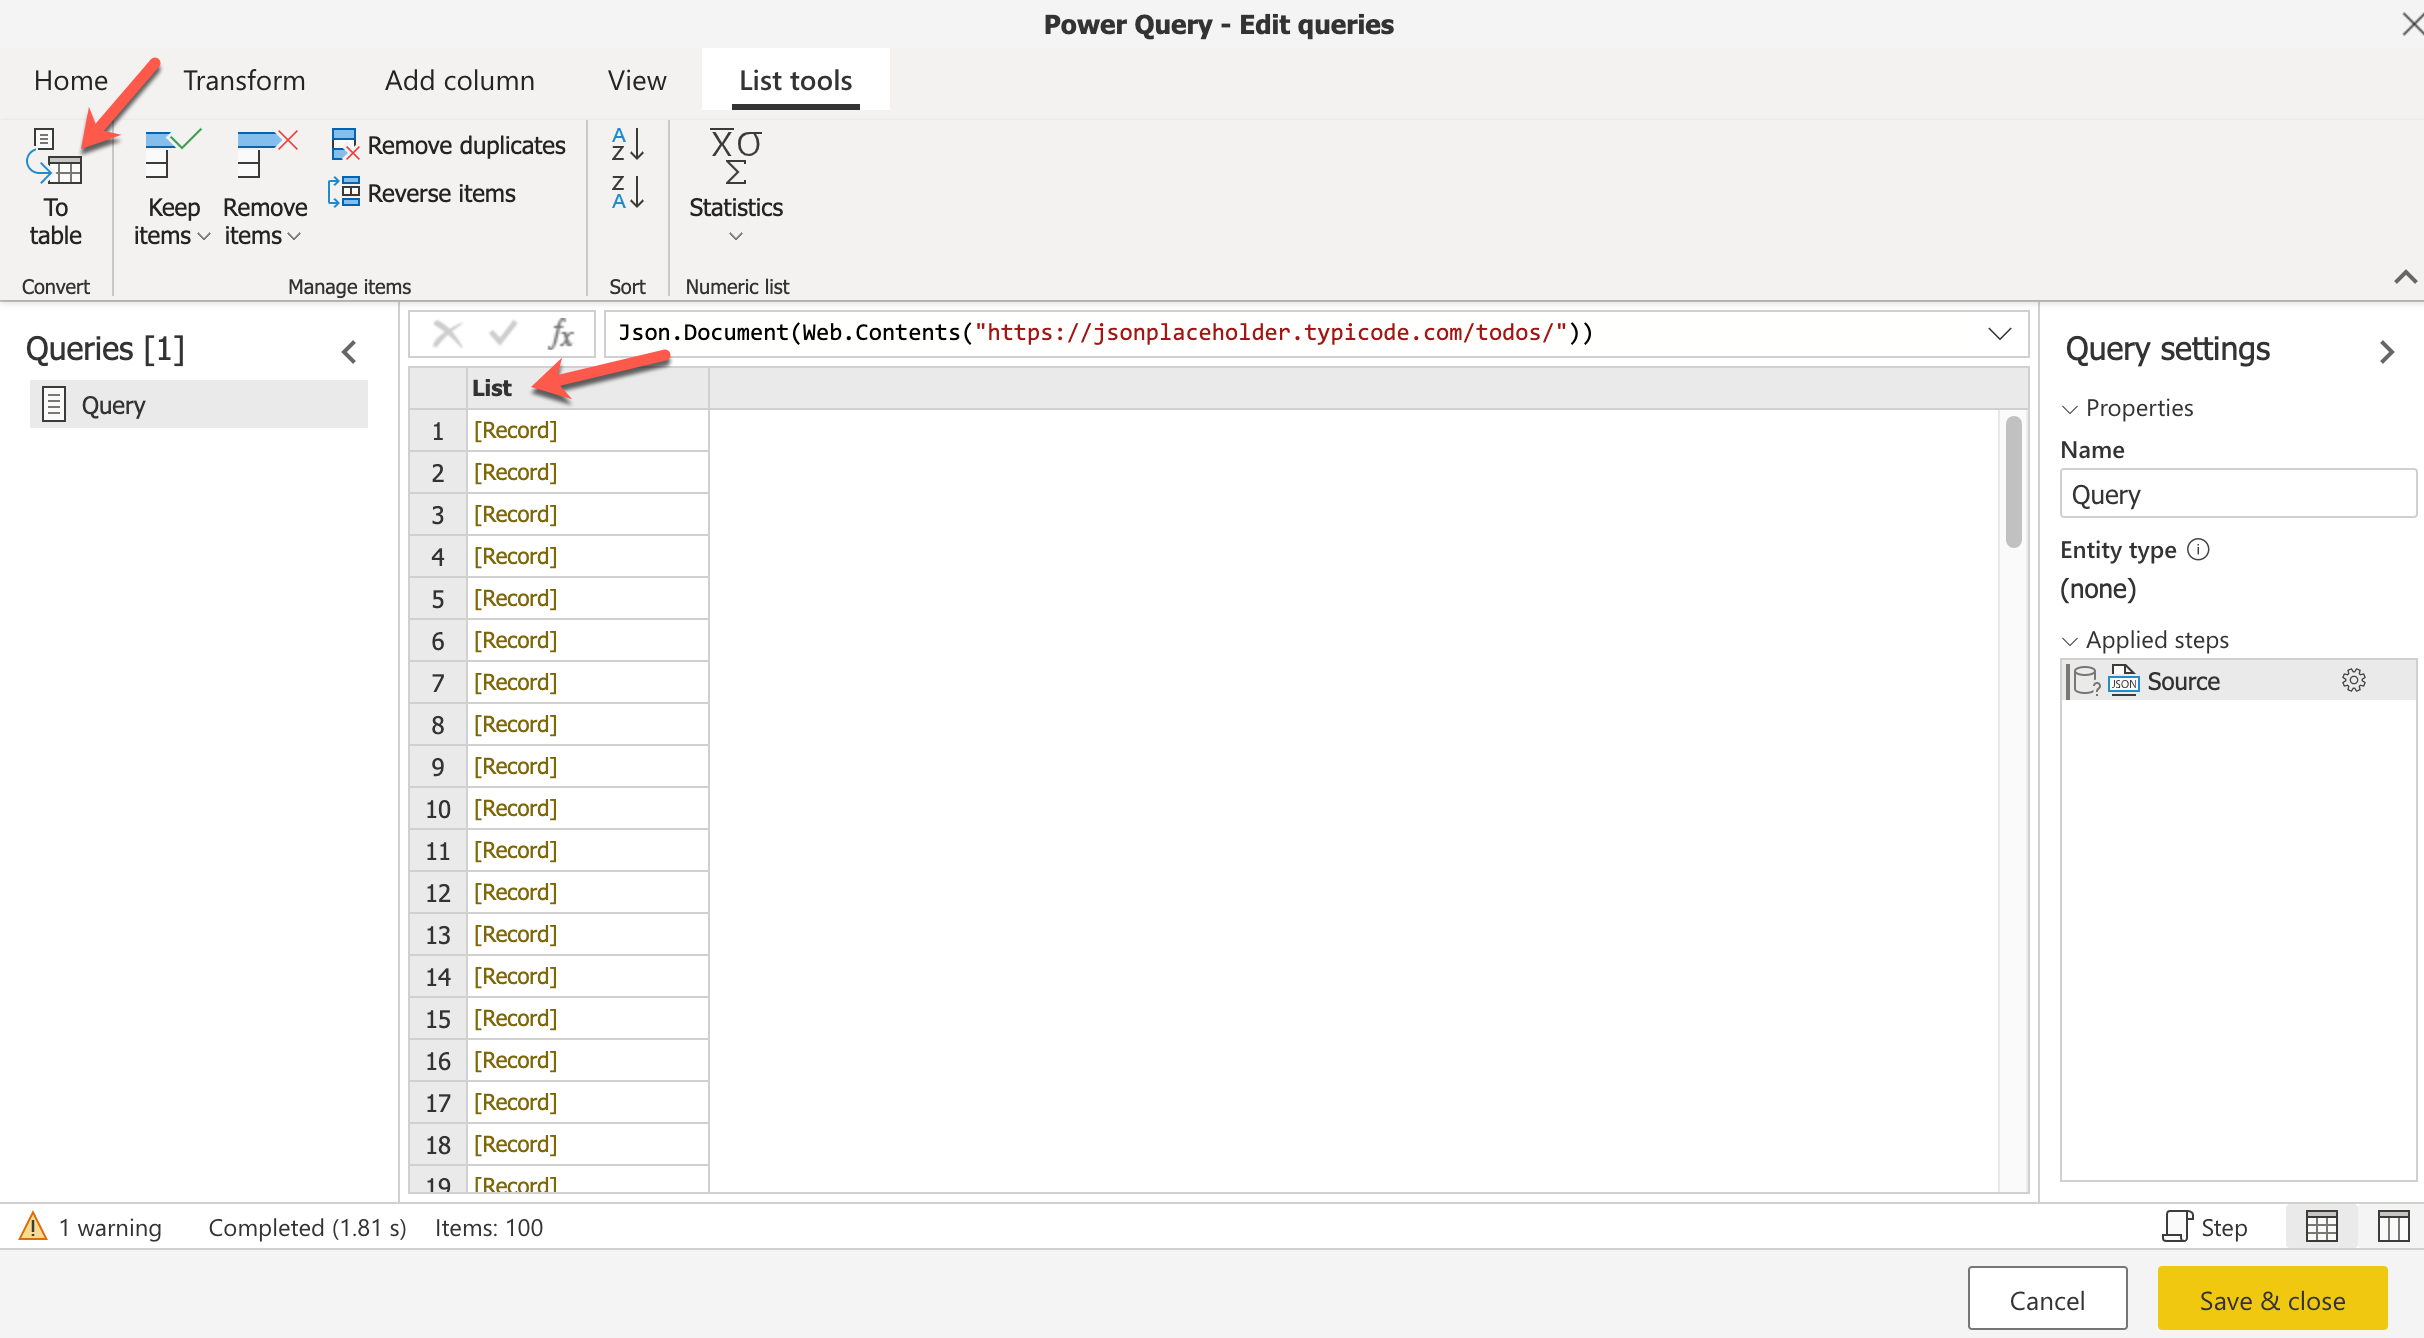
This will open up the Power Query Editor on the web, where all the records will be populated. Click on the List on the top and click on the To table.
Once the List is converted to a Column, click on the Split icon to split the records based on each of the column values in the dataset.
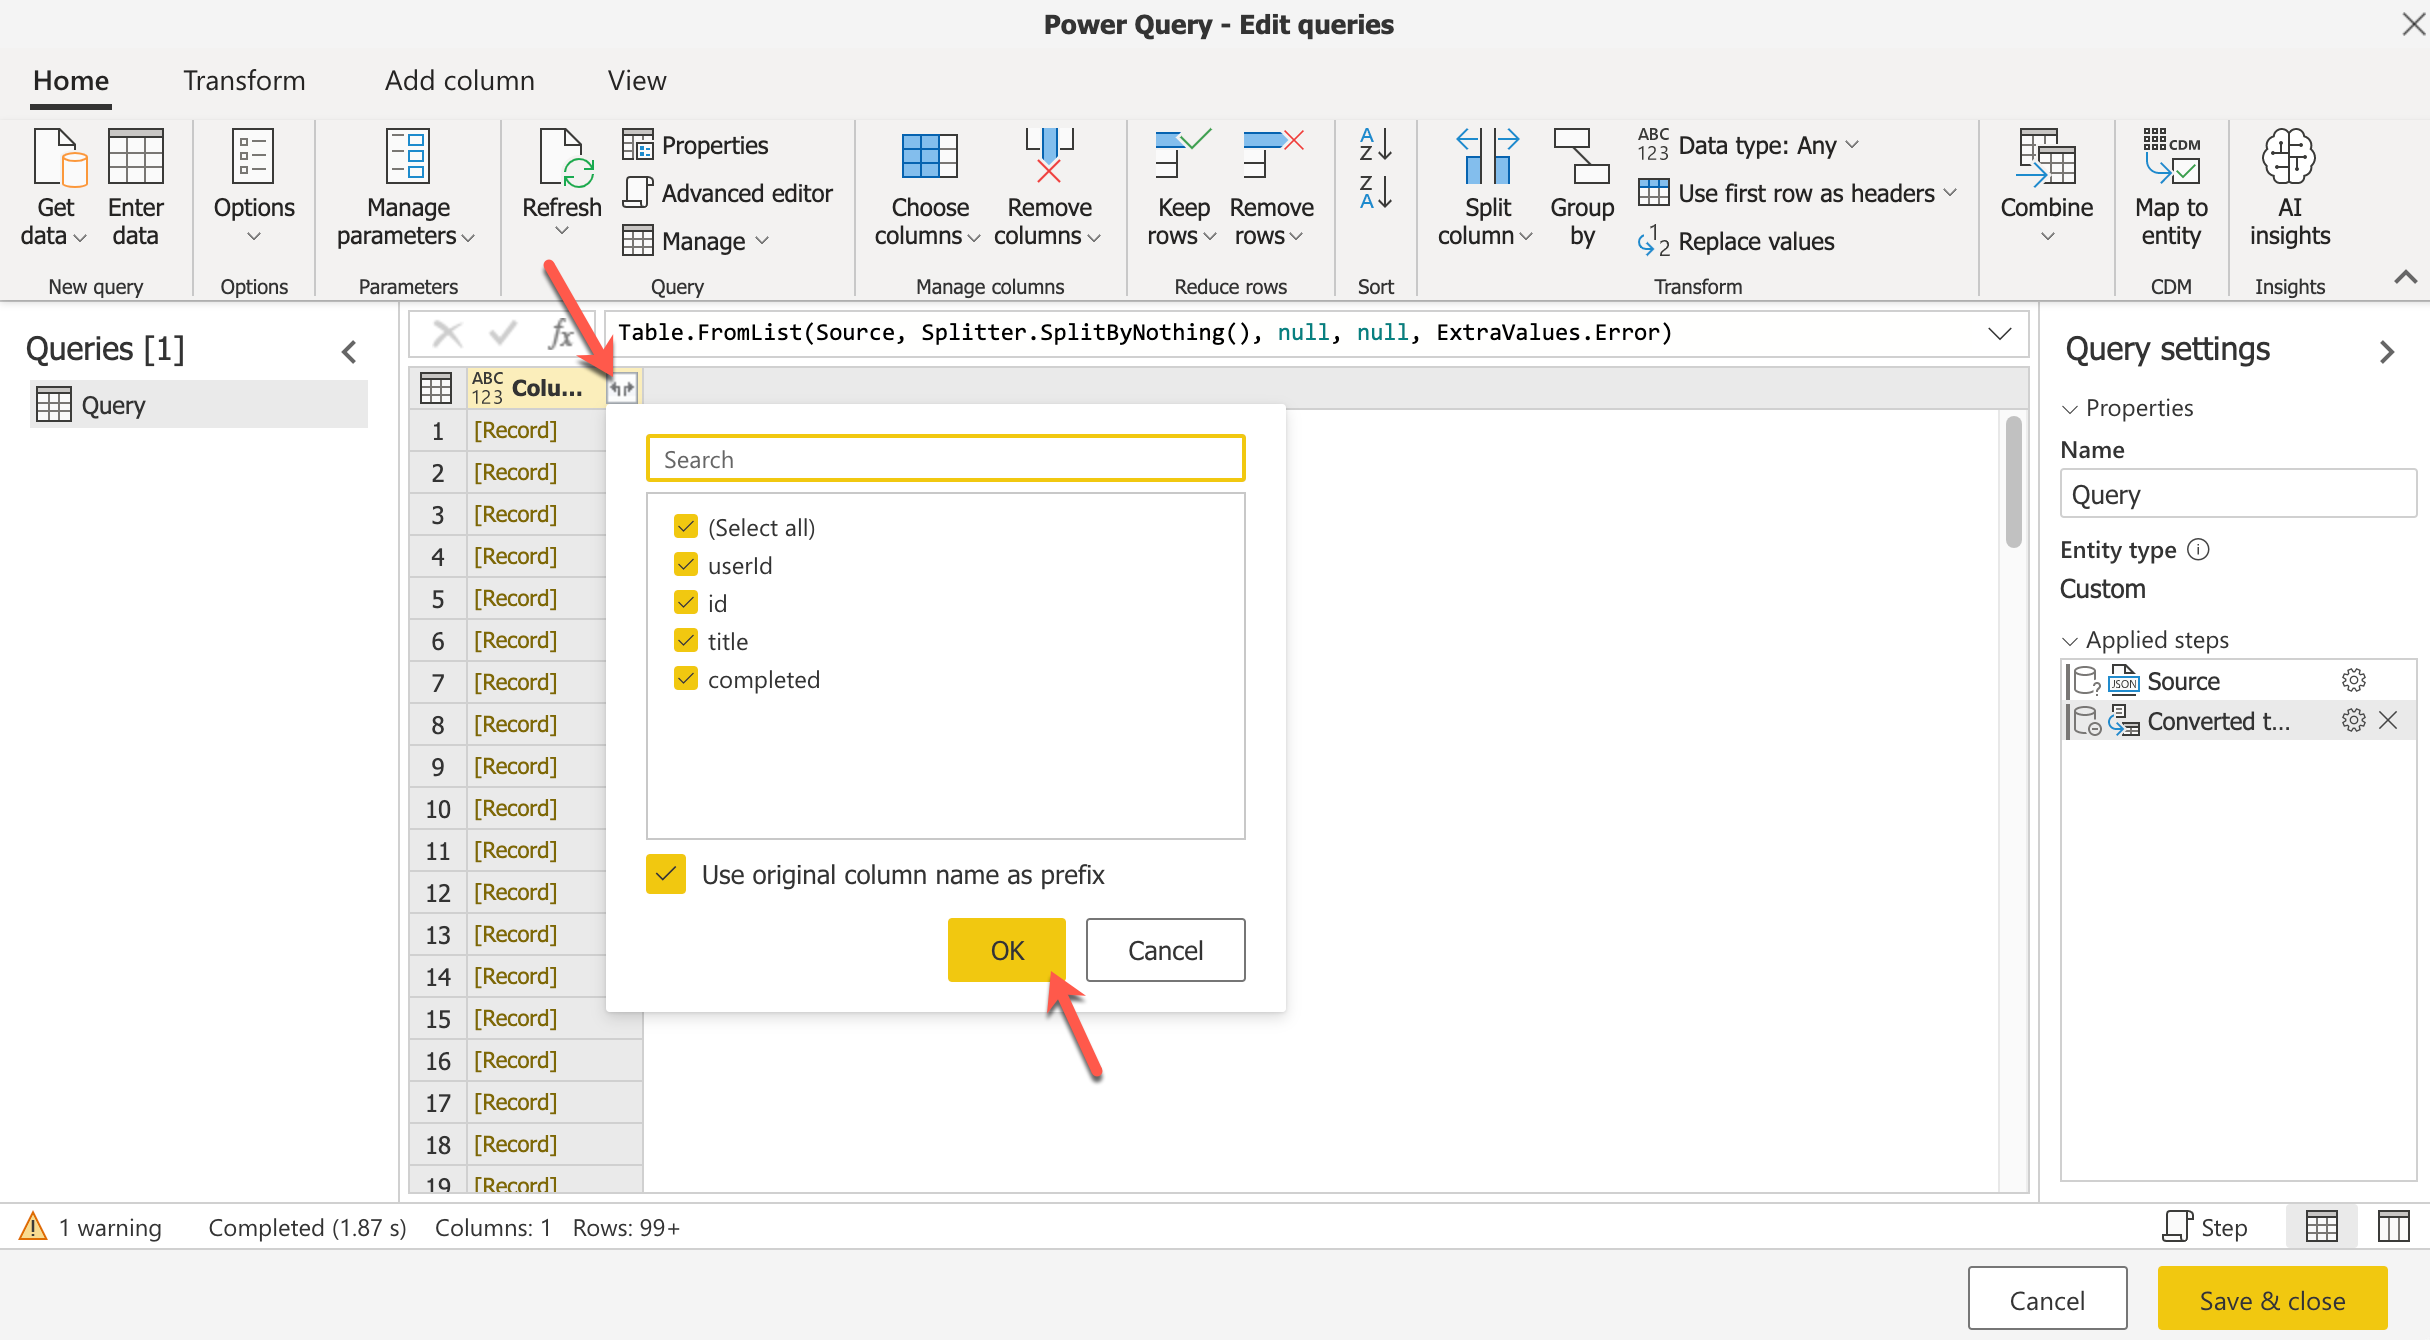
This will split all the single columns into multiple columns from the dataset as follows.
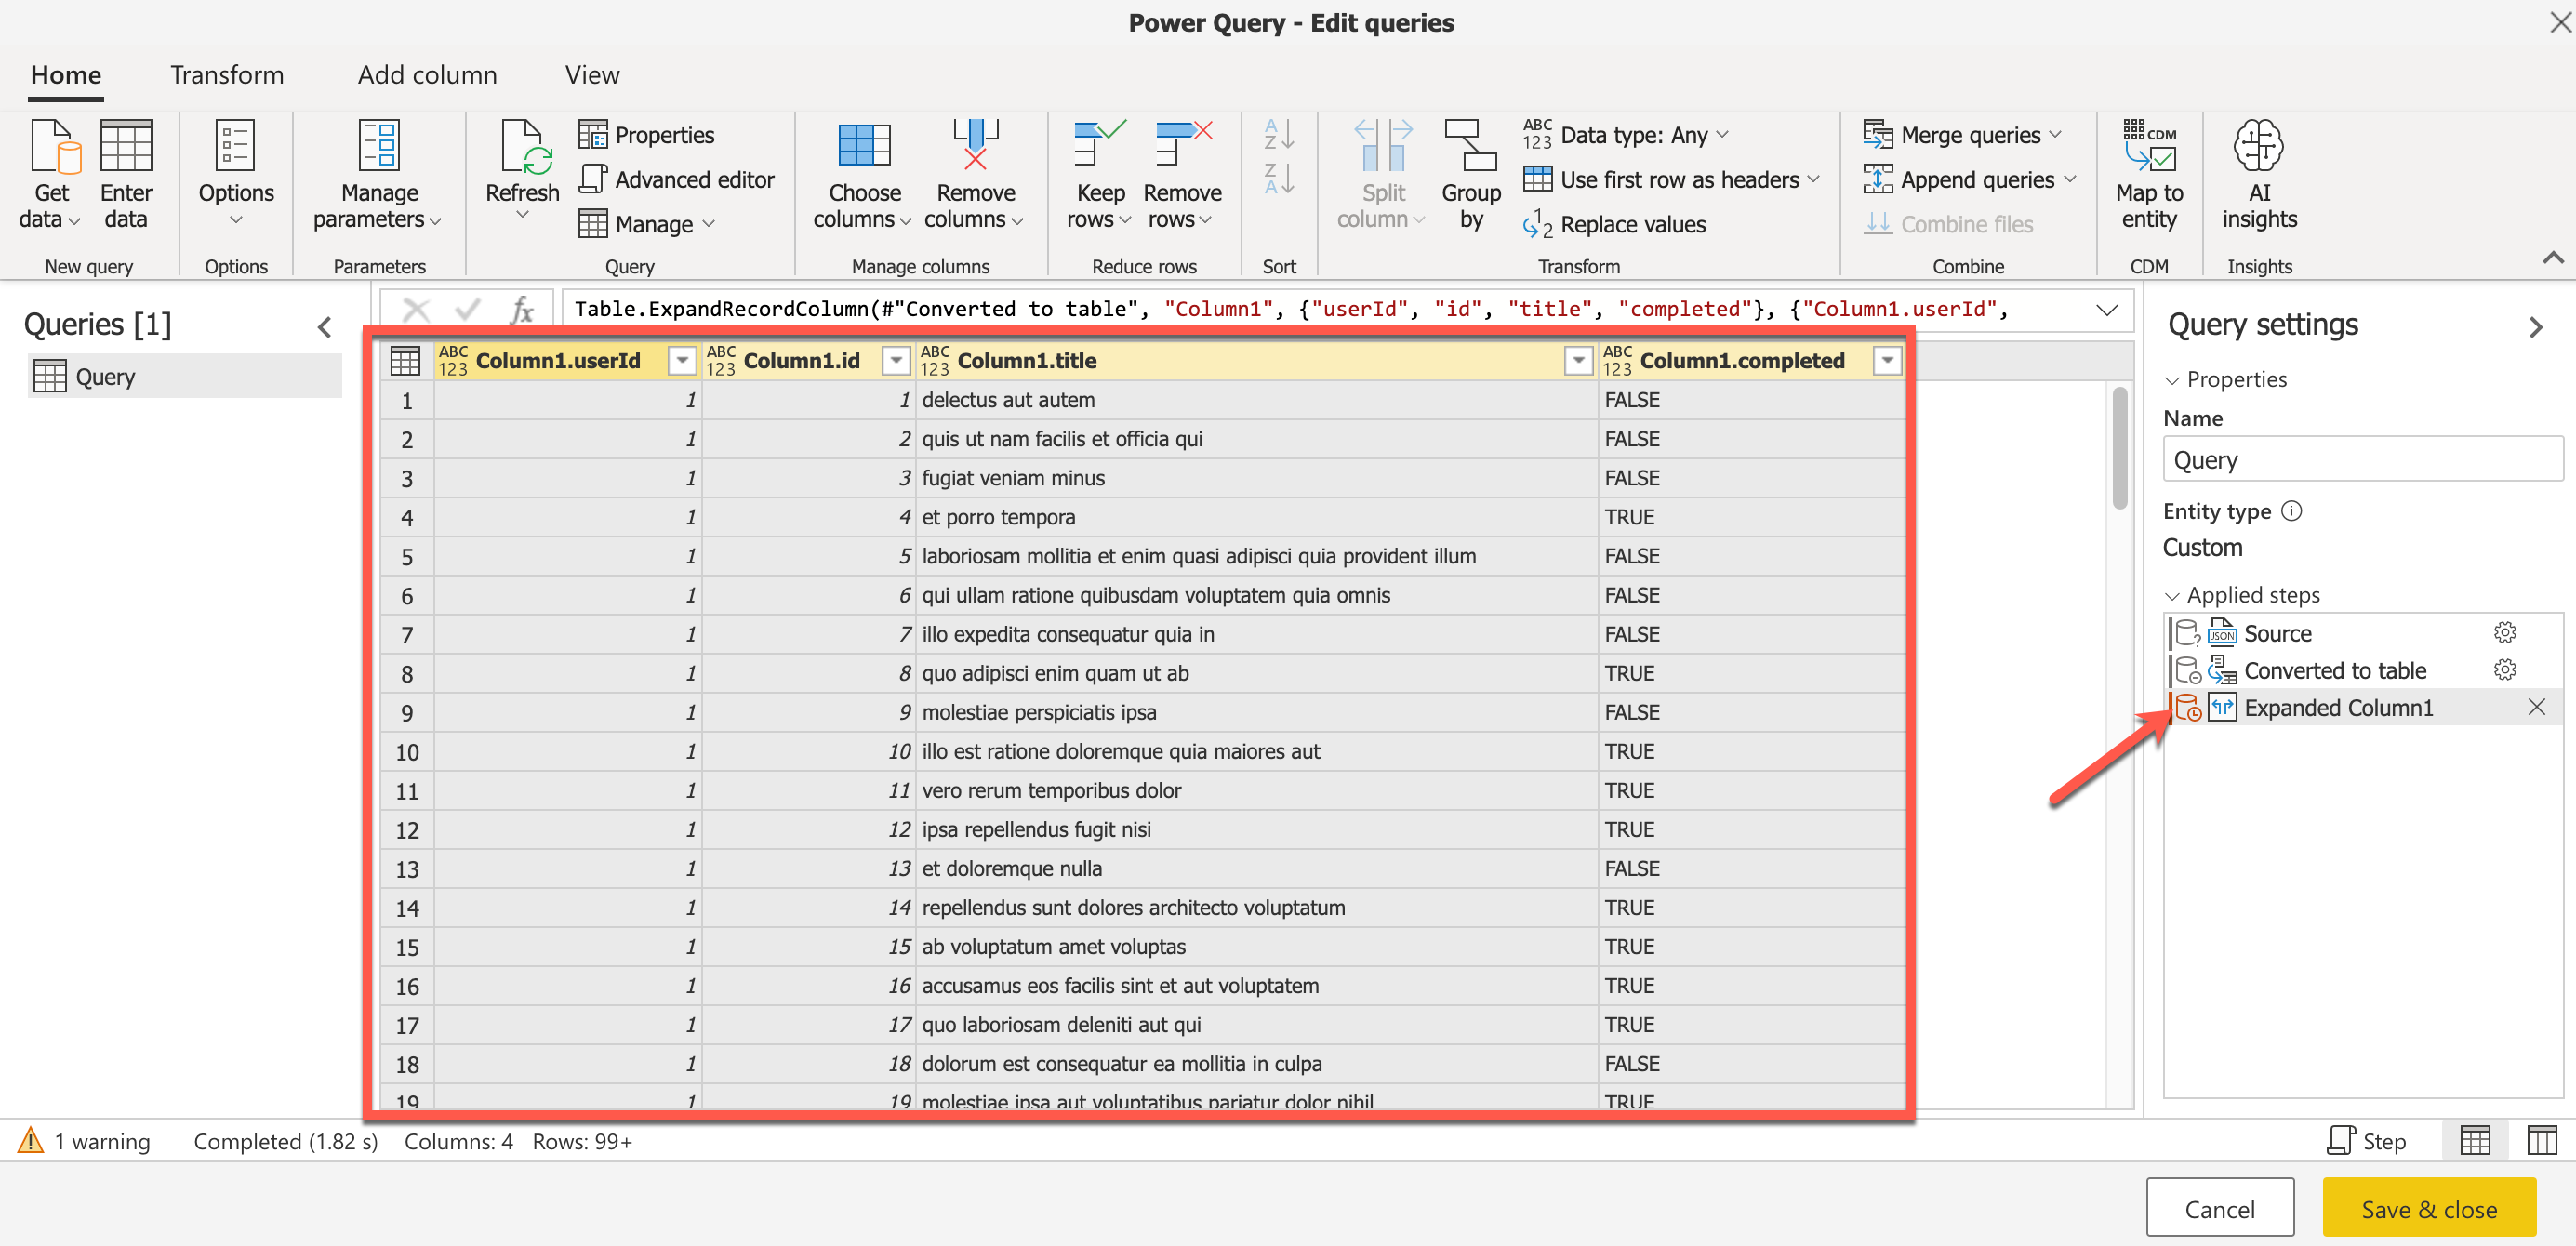
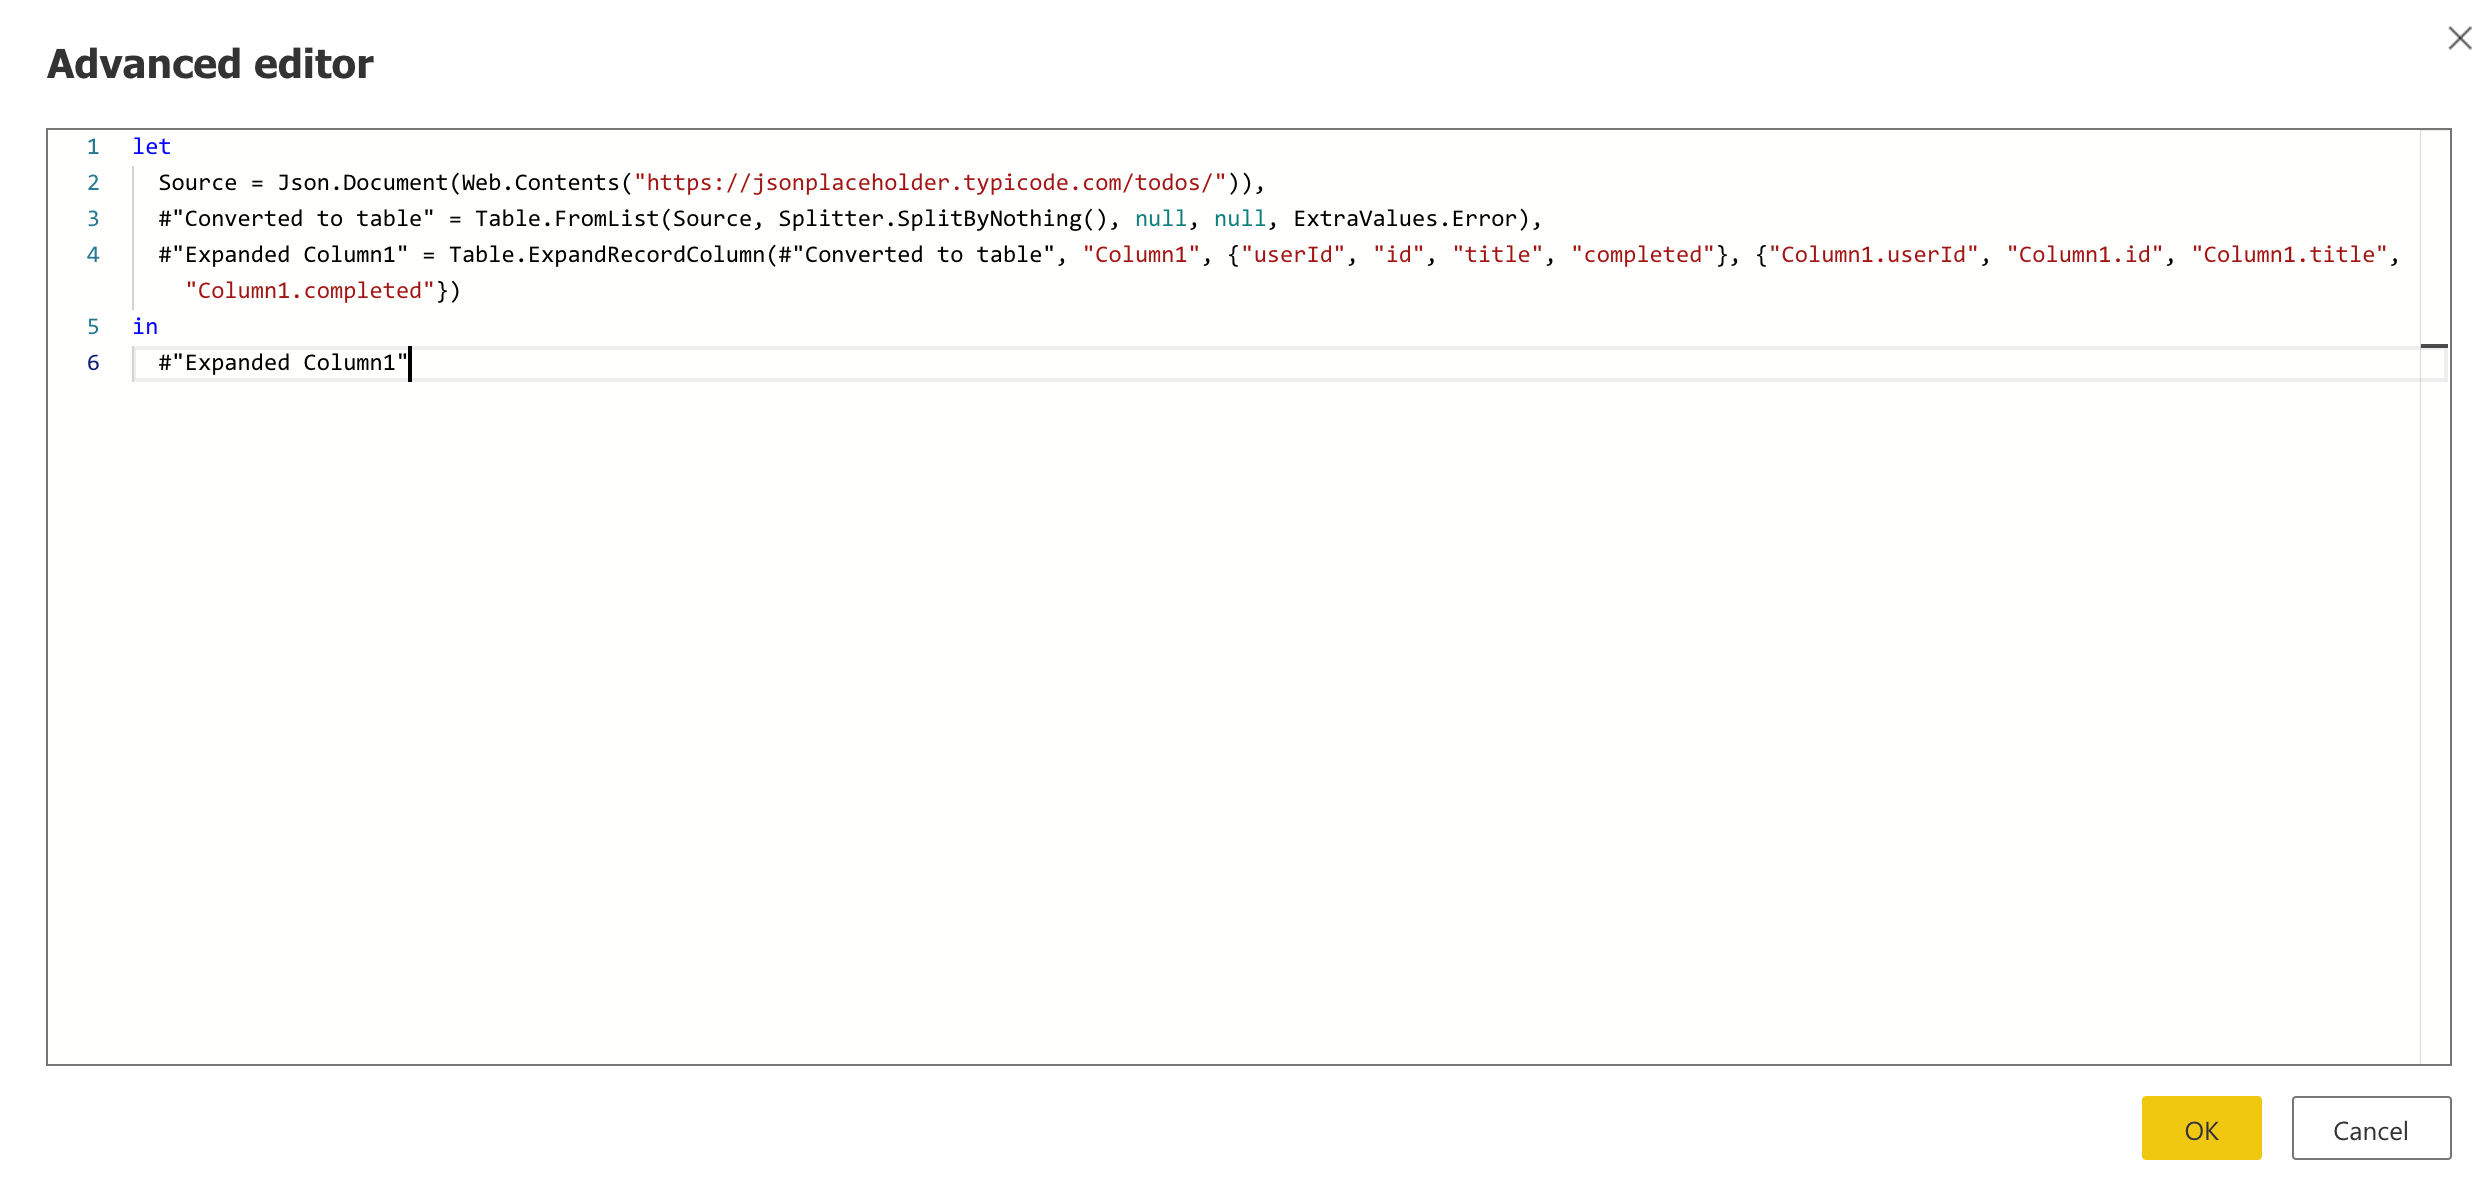
Also, notice how the steps that we have been performing are now recorded and available to edit or remove on the right-hand panel. If you have more advanced knowledge of the M language, you can also click on the Advanced Editor from the Query Editor and apply your own transformations. This is how the Advanced Editor in M looks like.
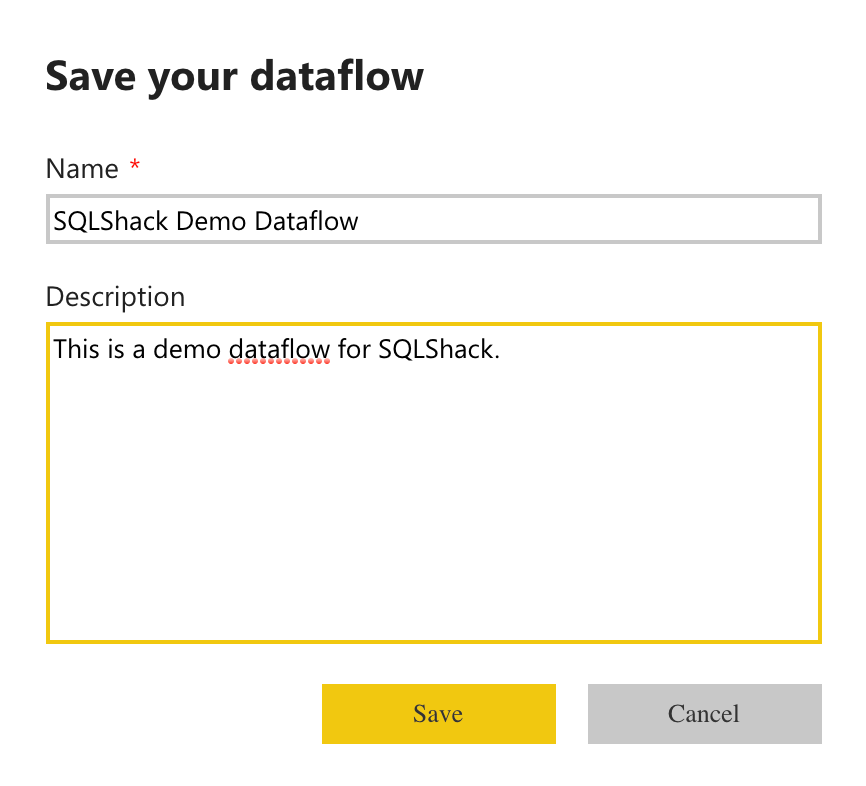
Now that we have applied our required steps in the Power BI Dataflows, hit the Save & Close button. This will validate the query, and you might be required to provide a name for the dataflow.
Upon saving the dataflow, only a schema will be created; however, it is not until you refresh your dataflow that the actual data will be fetched in the Power BI service.
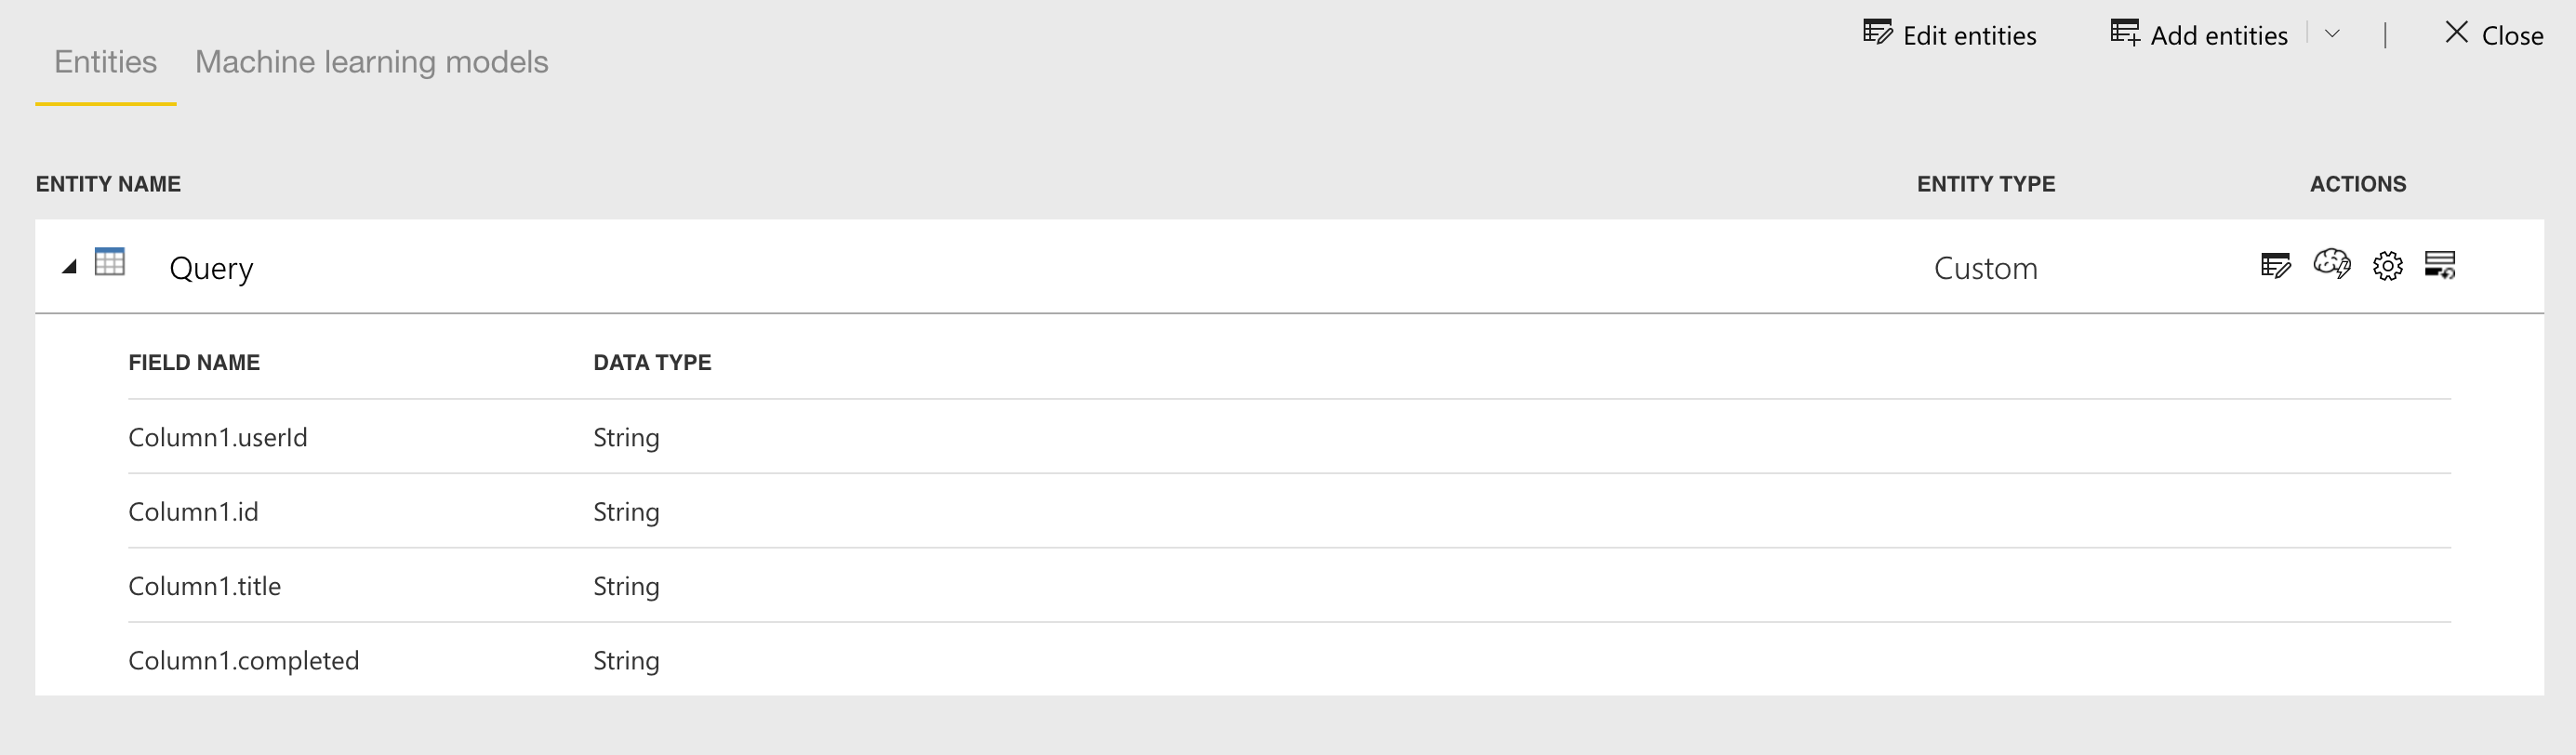
Now this dataflow can be used in any Power BI report or another dataflow itself.
Conclusion
In this article, we have understood the concept of Power BI Dataflows and how to create ETL pipelines in the Power BI Service. Dataflows in Power BI is basically a self-service data integration tool available in the Power BI service that can be used to fetch data from various data sources and create a data model on the cloud based on the schema of the datasets. An advantage of using the dataflows is that they can also be reused within the organization, and as such, you can create modular ETL pipelines to prepare your dataset.

He is a prolific author, with over 100 articles published on various technical blogs, including his own blog, and a frequent contributor to different technical forums.
In his leisure time, he enjoys amateur photography mostly street imagery and still life. Some glimpses of his work can be found on Instagram. You can also find him on LinkedIn
View all posts by Aveek Das
- Getting started with PostgreSQL on Docker - August 12, 2022
- Getting started with Spatial Data in PostgreSQL - January 13, 2022
- An overview of Power BI Incremental Refresh - December 6, 2021