
A fundamental task of Database Administrators is monitoring SQL Server performance. Whilst SQL Server does give us a user interface inside management studio that enables us to view current activity (in the rather aptly named Activity Monitor) this article is going to focus on querying Dynamic Management Objects with T-SQL to return various pieces of useful process information that we can use to monitor server usage.
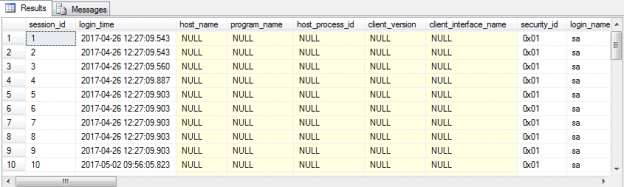
To begin with we’ll perform a very simple select statement on a DMV that is used to return information on the current authenticated sessions within our instance.
|
1 2 3 |
SELECT * FROM sys.dm_exec_sessions s |
Note that I have given the DMV an alias of ‘s’ which will help simplify our queries when we come to join to other objects.
This returns a lot of information in terms of both columns and rows so we’ll focus on reducing the result set returned to essentially ignore any rows that relate to internal system tasks.
We can achieve this by adding a very simple where clause to our query:
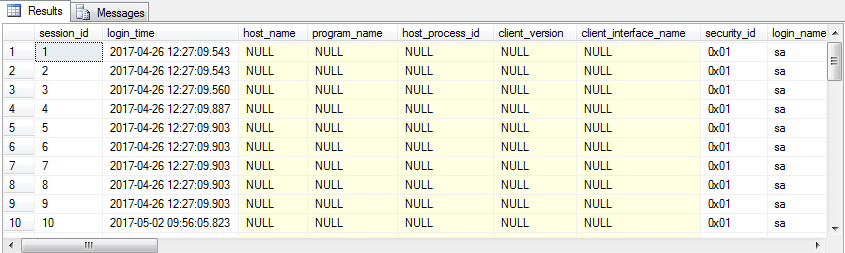
The first result set contained mainly NULL column values for the host, program and client columns which is indicative of system sessions. The second image on the other hand contains the actual values where we can see the originating machine of any active sessions (host_name) and what application is being used (program_name) as well as the unique session ID’s and login time of the session that were available for system tasks also.
At this point it is worth mentioning a common misconception about session ID’s. In my second result set we can see session IDs associated with user processes are taking up the numbers 51 to 54. The misconception is that any ID above 50 indicates a user process which actually isn’t quite the case and whilst you’ll never find user processes using an ID that is 50 or below system processes can and often will use session IDs over 50. This is why we use a where clause based on the is_user_process column being equal to 1 rather than use a session_id > 50 predicate.
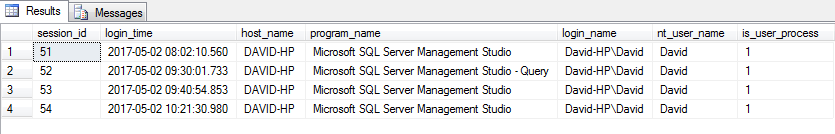
Now that we’ve appropriately limited the result set we need to be a bit more selective on our columns rather than return every single one. At this point, if you haven’t already done so, it’s worth scrolling through the results to see what other information column we can start to use, for example, we can return information that focused on the sessions user details with the following query:
|
1 2 3 4 5 6 |
SELECT s.session_id, s.login_time, s.host_name, s.program_name, s.login_name, s.nt_user_name, s.is_user_process FROM sys.dm_exec_sessions s WHERE s.is_user_process = 1 |
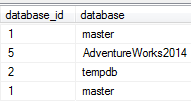
Whilst this does show who has sessions on our instance the information is still very limited. Let’s begin adding to our query by using the database ID column in the sessions view to our query; on its own it might not be very meaningful to us if it’s a system we’re not familiar with so we can utilise a function named DB_NAME that allows us to pass in the database ID and have the corresponding database name returned to us.
|
1 2 3 4 5 6 7 |
SELECT s.session_id, s.login_time, s.host_name, s.program_name, s.login_name, s.nt_user_name, s.is_user_process, database_id, DB_NAME(s.database_id) AS [database] -- return the ID & database name FROM sys.dm_exec_sessions s WHERE s.is_user_process = 1 |
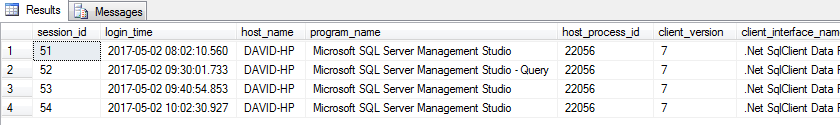
Here’s the database related columns returned on my test box:
We’ll now start looking at additional session information, including current status and values that relate to their associated workloads. We will still stay with the sys.dm_exec_sessions view and return some additional columns using the query below:
|
1 2 3 4 5 6 7 8 9 |
SELECT s.session_id, s.login_time, s.host_name, s.program_name, s.login_name, s.nt_user_name, s.is_user_process, database_id, DB_NAME(s.database_id) AS [database], -- return the database name s.status, s.reads, s.writes, s.logical_reads FROM sys.dm_exec_sessions s WHERE s.is_user_process = 1 |
I’ve added two lines; one to return the current status of each session and another that returns read/write information.
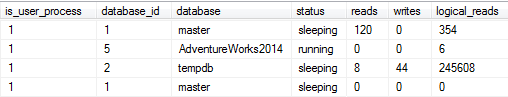
The status column can be one of four values, running or sleeping as in the image above that tells us if the session is active or not running. It can also be dormant, meaning the session has been reset or it can have a status of preconnect which relates to the Resource Governor.
We can also view the related workload of each session by noting the read/write values. The read column indicates reads that have come from disk, which is substantially slower than reads from cache indicated by the logical_reads column.
The writes column indicates write operations (surprise!), it is worth pointing out that the values any of the reads and writes columns do not correspond to table rows but database pages. If we want row information we can add the row_count column from the sys.dm_exec_sessions DMV to return that particular piece of information:
|
1 2 3 4 5 6 7 8 9 |
SELECT s.session_id, s.login_time, s.host_name, s.program_name, s.login_name, s.nt_user_name, s.is_user_process, database_id, DB_NAME(s.database_id) AS [database], -- return the database name s.status, s.reads, s.writes, s.logical_reads, s.row_count – added row_count FROM sys.dm_exec_sessions s WHERE s.is_user_process = 1 |
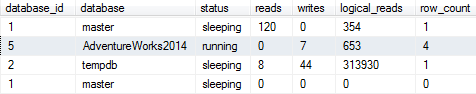
In the image above I’ve highlighted the row containing the session information for the very same query that we are executing. Note the row_count of 4 which is the same result set that we are working with and also note that the row status is running meaning the session has effectively been captured mid-execution.
We could also modify our where clause to use a system function named @@SPID to only view information that relates to our specific query:
|
1 2 3 4 5 6 7 8 9 10 |
SELECT s.session_id, s.login_time, s.host_name, s.program_name, s.login_name, s.nt_user_name, s.is_user_process, database_id, DB_NAME(s.database_id) AS [database], s.status, s.reads, s.writes, s.logical_reads, s.row_count FROM sys.dm_exec_sessions s WHERE s.is_user_process = 1 AND s.session_id = @@SPID -- just return info for our query |
In the opposite way, we can use the function to exclude our query from the results as we would be focusing on other processes that are running on the instance:
|
1 2 3 4 5 6 7 8 9 10 |
SELECT s.session_id, s.login_time, s.host_name, s.program_name, s.login_name, s.nt_user_name, s.is_user_process, database_id, DB_NAME(s.database_id) AS [database], s.status, s.reads, s.writes, s.logical_reads, s.row_count FROM sys.dm_exec_sessions s WHERE s.is_user_process = 1 AND s.session_id <> @@SPID -- ignore our query completely |
At this point we will return information that is contained outside of the sys.dm_exec_sessions DMV and start to join another Management View to see what other information we can add to our query results, we’ll do so by first running this simple select statement:
|
1 2 3 |
SELECT * FROM sys.dm_exec_connections |
As the name implies, this DMV returns information on the established physical connections to our SQL Server instance. We could use a query similar to the one below to look at a more limited result set.
|
1 2 3 4 5 |
SELECT c.session_id, c.net_transport, c.protocol_type, c.client_net_address, c.client_tcp_port FROM sys.dm_exec_connections c |
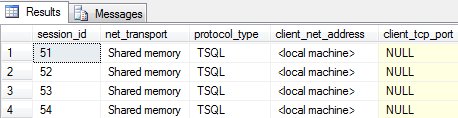
This is the result set on my test instance, as I’m querying from the same machine we don’t see information like client IP or port details and being local the net_transport column is using Shared memory rather than TCPIP or Named Pipes. Unlike the sys.dm_exec_sessions DMV the connections view does not contain rows that correspond to internal system processes.
Of course at this point we have two completely separate queries, one for our session related information and another for physical connections. To bring them together we can perform an inner join using the session ID column which importantly exists in both views to merge our result sets:
|
1 2 3 4 5 6 7 8 9 10 11 12 13 14 |
SELECT s.session_id, s.login_time, s.host_name, s.program_name, s.login_name, s.nt_user_name, s.is_user_process, database_id, DB_NAME(s.database_id) AS [database], -- return the database name s.status, s.reads, s.writes, s.logical_reads, s.row_count FROM sys.dm_exec_sessions s INNER JOIN sys.dm_exec_connections c ON s.session_id = c.session_id WHERE s.is_user_process = 1 AND s.session_id |
Our query is now joining matching session IDs between the two DMV’s, just as we would tables (remember that a view is essentially a virtualised table) and we can now add columns from the connections DMV into our select query:
|
1 2 3 4 5 6 7 8 9 10 11 12 13 |
SELECT s.session_id, s.login_time, s.host_name, s.program_name, s.login_name, s.nt_user_name, s.is_user_process, database_id, DB_NAME(s.database_id) AS [database], s.status, s.reads, s.writes, s.logical_reads, s.row_count, c.session_id, c.net_transport, c.protocol_type, c.client_net_address, c.client_tcp_port FROM sys.dm_exec_sessions s INNER JOIN sys.dm_exec_connections c ON s.session_id = c.session_id WHERE s.is_user_process = 1 |
Returned information from both session and connection DMVs:
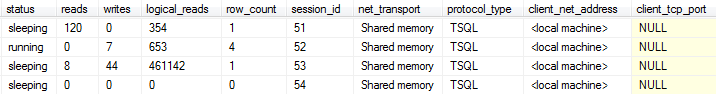
Please note there is a one to one relationship between connections and sessions and the corresponding management views.
This is now an ideal point to highlight the aliases that have been used in the query. In our query we are using the aliases s and c for the session and connection Management Views so let’s modify our select statement and remove the alias for session ID and all the other columns so we’re left with the following:
|
1 2 3 4 5 6 7 |
SELECT session_id FROM sys.dm_exec_sessions s INNER JOIN sys.dm_exec_connections c ON s.session_id = c.session_id WHERE s.is_user_process = 1 |
If we try to run the query we’ll get the following error:
Msg 209, Level 16, State 1, Line 1
Ambiguous column name ‘session_id’.
This is because the session_id column exists in both the session and connection DMVs so the engine is telling us that it simply doesn’t know which one to return, sessions or connection session_id.
In this case the alias allows us to very specify which DMV the column should come from. As we are joining on exact matches on the same column the value won’t be different whether we specify the session ID from the session or the connection DMV as demonstrated below (note the column alias I’ve used to differentiate between the two DMV columns).
|
1 2 3 4 5 6 7 8 9 |
SELECT s.session_id AS SessionID, c.session_id AS ConnectionSessionID, s.is_user_process, s.login_time FROM sys.dm_exec_sessions s INNER JOIN sys.dm_exec_connections c ON s.session_id = c.session_id WHERE s.is_user_process = 1 |
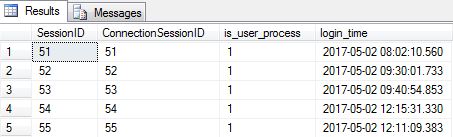
The alias has proved to be useful for session ID because the values represent the very same thing in both the sessions and connections view and it’s certainly common to find columns in different DMVs that are duplicated, that’s really for ease of querying.
The final demonstration is to show two columns in our DMVs that although named differently could be confused to mean the same thing, when actually they are very different.
Remember in the sys.dm_exec_sessions DMV we looked at reads and writes of all the sessions on our instance? Well, the sys.dm_exec_connections DMV also has read and write columns (num_reads and num_writes) and we might be tempted to think that by querying both columns we’d get exactly the same results.
|
1 2 3 4 5 6 7 8 9 |
SELECT s.session_id AS SessionID, c.session_id AS ConnectionSessionID, s.writes AS SessionWrites, c.num_writes AS ConnectionWrites FROM sys.dm_exec_sessions s INNER JOIN sys.dm_exec_connections c ON s.session_id = c.session_id WHERE s.is_user_process = 1 |
Again, using column aliases I can view writes from the sessions view (SessionWrites) and the corresponding writes from the connections view (ConnectionWrites) side by side, here’s the output:
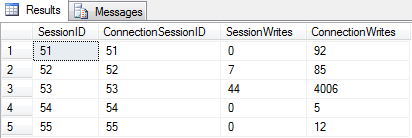
They’re quite different and actually, it’s not that surprising why because when we look up the DMV information on Books Online the definition of the columns are very different:
SYS.DM_EXEC_SESSIONS
| writes | bigint | Number of writes performed, by requests in this session, during this session. Is not nullable. |
SYS.DM_EXEC_CONNECTIONS
| num_writes | int | Number of data packet writes that have occurred over this connection. Is nullable. |
The sessions view is based around page writes, but the connections view isn’t based on page level information at all but packets, which makes perfect sense as we’re looking at purely connection related information.
This highlights two things, the first is the depth of information that we can retrieve from DMVs but secondly, we need to ensure we understand both what information the DMV is based on and what the columns mean, like many things in SQL an assumption will often be incorrect.
So for our query, if we wanted to add both columns in our monitoring script and cover network information then there is nothing stopping us!
|
1 2 3 4 5 6 7 8 9 10 11 12 13 14 |
SELECT s.session_id, s.login_time, s.host_name, s.program_name, s.login_name, s.nt_user_name, s.is_user_process, database_id, DB_NAME(s.database_id) AS [database], -- return the database name s.status, s.reads, s.writes, s.logical_reads, s.row_count, c.session_id, c.net_transport, c.protocol_type, c.client_net_address, c.client_tcp_port, c.num_writes AS DataPacketWrites – return packet writes FROM sys.dm_exec_sessions s INNER JOIN sys.dm_exec_connections c ON s.session_id = c.session_id WHERE s.is_user_process = 1 |
Whilst still relatively straight forward this query has introduced the functionality that Dynamic Management Views provide, especially for monitoring purposes. We’ve utilised some fundamental T-SQL concepts such as Joins, Functions and Aliases to bring back some incredibly useful information that we can use for checking activity on our instance.
The previous article in this series:

He has over 10 years experience working with SQL Server in different roles such as DBA, Database Developer and BI specialist. He has worked as Technical Lead on numerous mission critical projects in various sectors such as local government, finance, charities and retail.
David is extremely passionate about SQL Server and keeps his own blog at http://sqlclarity.blogspot.com/ where he shares his views on the Data Platform. In his spare time he loves spending time with his family, watching movies and cooking Asian cuisine!
View all posts by David Alcock
- Monitoring SQL Server with Dynamic Management Objects – Requests - May 17, 2017
- Monitoring SQL Server with Dynamic Management Objects – Sessions and connections - May 12, 2017
- CHECKSUM page verification in SQL Server - March 21, 2017