
Windows Server 2003 had a utility named System Monitor. Later versions – Windows 7, Windows 8, Windows Server 2008 R2, and Windows Server 2012 have Performance Monitor as a part of Performance Monitor, or Reliability and Performance Monitor parent snap-in. Earlier Windows versions had Performance Monitor Wizard – a utility that was not shipped with Windows, so it had to be downloaded and installed additionally
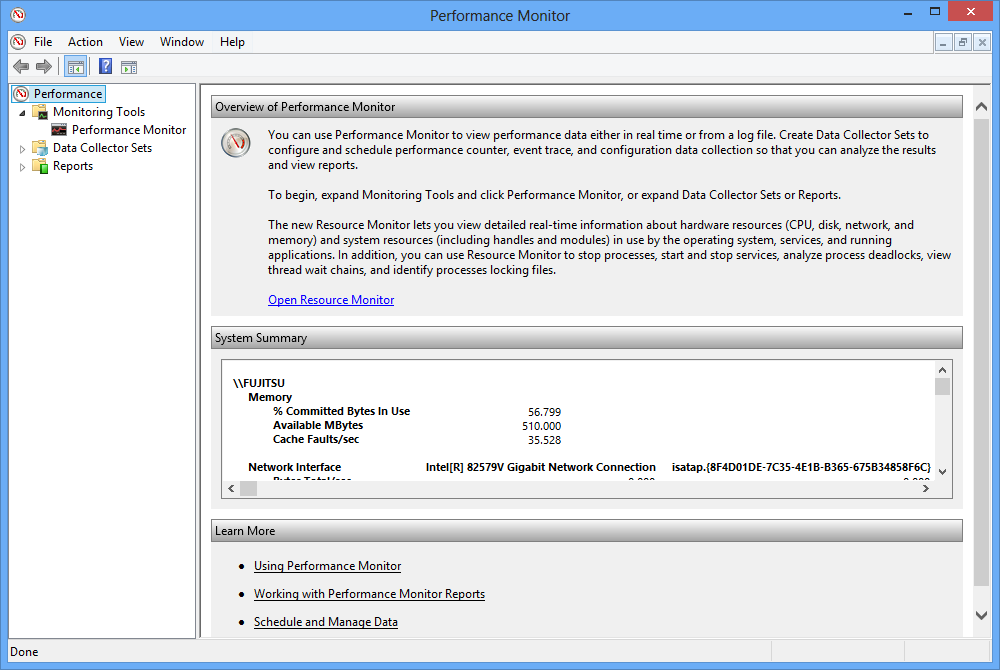
The Windows Performance Monitor parent snap-in consists of three elements – Monitoring Tools (this is where Performance Monitor is), Data Collector Sets, and Reports. The focus of this article is on Monitoring Tools Performance Monitor, also known as Performance Monitor or PerfMon
Performance Monitor provides a wide range of measures that can be monitored. Monitoring the right set of available counters narrows down the problem origin to a specific component or application and enables efficient and quick problem troubleshooting. Some of the performance counters don’t provide enough information when monitored alone. When their values are above the recommended threshold, they don’t clearly indicate performance problems. To be able to determine whether there is a performance problem, other counters should be monitored and their values compared
For example, the Page faults/sec counter shows both hard and soft page faults. Soft page faults don’t affect SQL Server performance, but hard page faults do. That’s why high Page faults/sec values don’t necessarily indicate performance problems. To determine whether that is the case, monitoring another counter that also indicates hard page faults – the Page reads/sec value is recommended. If it is also high, there is most likely a performance problem. To be sure, monitor disk behavior and paging via memory and disk counters, such as Pages Output/sec, Pages Input/sec, Disk Reads/sec, and Avg. Disk Read Bytes/sec
Without monitoring all necessary counters, the information obtained can be insufficient or misleading for determining the system state and making correct decisions
When it comes to selecting the counters, it’s necessary to understand what they represent, what are acceptable values, is there an exact threshold, or is the value determined based on a trend line
Performance Monitor provides graphical presentation of the metrics collected by Data Collector Sets and Event Trace Sessions, both in real time and as historical data
Besides the Windows performance parameters, Performance Monitor provides a range of parameters useful for SQL Server performance monitoring. On a machine where SQL Server is installed, SQL Server related counters are automatically added to Performance Monitor
How Performance Monitor works
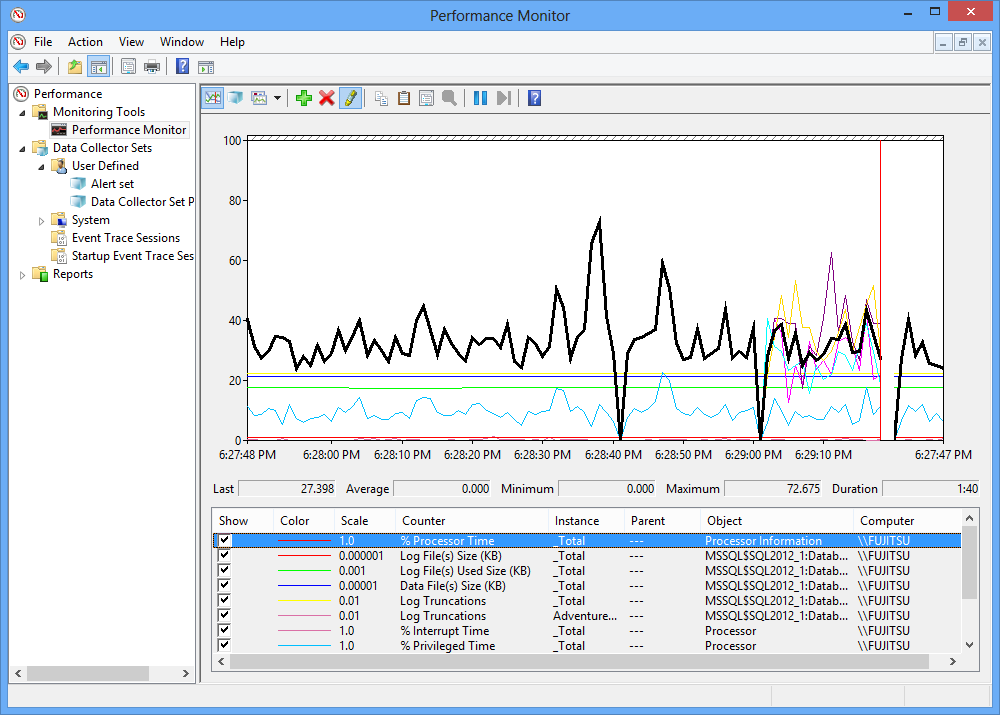
Performance Monitor presents built-in Windows and application performance counters in easy-to read graphs. It can show live, real time data as well as data stored in *.blg, *.csv, or *.tsv log files. The latter feature makes is useful for performance analysis and determining performance trends. All data can be presented as line graphs, histogram bars, or reports
The performance counters presented in Performance Monitor can be defined via custom Data Collector Sets
Data Collector Sets contain performance counters, event trace data, and system configuration information. Performance counters measure system state and activity. Performance Monitor periodically requests the current value of performance counters and represents them graphically, or in the reports. Event trace data is gathered from trace files created by the system or application. Configuration information is obtained from the Windows registry
To be able to set monitored metrics and use all Performance Monitor features, a user has to be a member of the local Administrators group. A member of the Users group can only open saved log files in Performance Monitor and set the graph properties. Real time monitoring is not possible for these users
There are two more user groups specific for this utility: Performance Monitor Users and Performance Log Users. The first one allows viewing real time and saved log files in Performance Monitor and setting the graph properties for both. Creating and modifying Data Collector Sets is not allowed. In addition to the features available for the Performance Monitor Users group users, the Performance Log Users group allows creating and modifying Data Collector Sets, except the NT Kernel trace
What information can Performance Monitor gather?
The counters that can be monitored in Performance Monitor are grouped for easier referencing. The available groups depend on the operating system and applications installed on the monitored machine. Available groups are: Memory, Network Interface, Physical Disk, Process, Processor, Server, System, and many more
When it comes to SQL Server, counter groups are named MSSQL$SQL<version>:<counter_name>. For SQL Server 2012, there are more than 30 groups. For example, the MSSQL$SQL2012:Databases counter group contains more than 600 counters that monitor data and log file size, growth, truncation, shrinks, percentage and KB of log file used, various metrics about transactions, log cache, log flush, and many more. The MSSQL$SQL2012:Locks group contains more than 100 counters that monitor lock requests, timeouts, wait time, and more on various resources – database files, index rows, catalog information, table, view, stored procedure or other database object, etc.
While the MSSQL$SQL counters enable detailed and in-depth analysis of the SQL Server performance, the most commonly monitored counters for troubleshooting SQL Server performance issues belong to the Memory, Processor, Physical Disk, and Network Interface groups
Each of these groups contains multiple counters. For example, the Memory group contains more than 30 counters among which the most important are Available Bytes, Page Faults/sec, Page reads/sec, Page Writes/sec, Pages Input/sec, Pages Output/sec, and Pages/sec
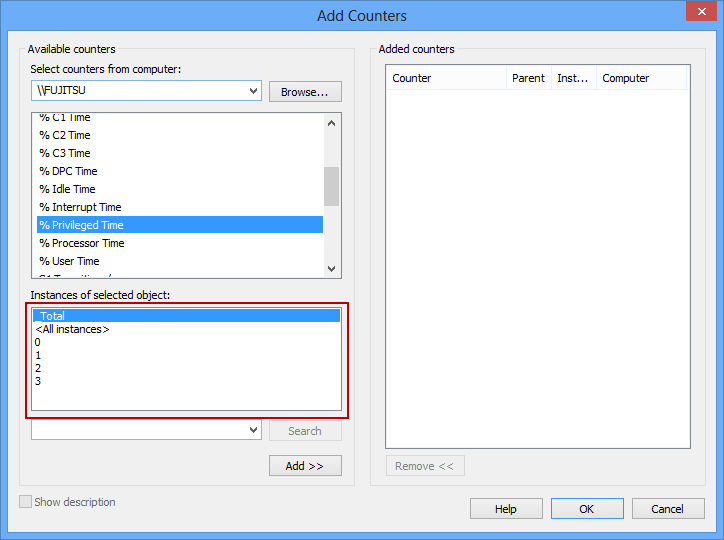
Multiple instances are shown for a counter if there are multiple processors on the machine and if tracking the counter per processor makes sense, such as for Processor and Processor Information counters. You can monitor each processor individually, or all instances
Although active monitoring makes little overhead, to avoid monitoring the overhead along with the system and application performance, use Performance Monitor to monitor a remote machine
In SQL Server performance tuning using Performance Monitor, we give detailed steps for using Windows Performance Monitor

She has been working with SQL Server since 2005 and has experience with SQL 2000 through SQL 2014.
Her favorite SQL Server topics are SQL Server disaster recovery, auditing, and performance monitoring.
View all posts by Milena "Millie" Petrovic
- Using custom reports to improve performance reporting in SQL Server 2014 – running and modifying the reports - September 12, 2014
- Using custom reports to improve performance reporting in SQL Server 2014 – the basics - September 8, 2014
- Performance Dashboard Reports in SQL Server 2014 - July 29, 2014