
Introduction
The Query Store is a new feature in SQL Server 2016 that will greatly improve the process of performance tuning! The biggest limit of the query plan cache and the dynamic management views that relates to it is that it is very temporary. Queries are only accessible for as long as they are in cache, and as a result there is no way to travel back in time to determine what happened at 9am yesterday, or why performance worsened over a week-long period.
The purpose of this article is to walk through a variety of hands-on examples of the query store, illustrating how the data can be accessed and used to monitor database performance. Once we have a framework in place for monitoring, we can extend our work towards identifying and tuning misbehaving queries. We’ll skip coverage of configuring the query store as that has been handled quite a bit in other blog posts, and by Microsoft. If you’re looking to get started with enabling and configuring the Query Store, check out this article by Brian Bønk Rueløkke:
Query Store – the next generation tool for every DBA
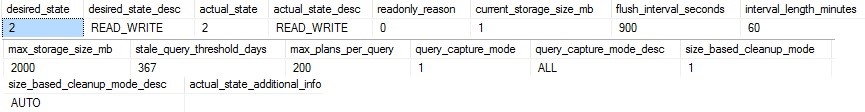
You can verify the configuration of the Query Store on a given database by checking a new view:
|
1 2 3 |
SELECT * FROM sys.database_query_store_options |
The results will confirm if the Query Store is enabled, as well as all of the configuration options that are available by selecting the Query Store menu under the database properties:
The Challenge
SQL Server has provided many tools over the years that assist in optimizing indexes, queries, memory and CPU settings, waits, and more. The primary tool available directly from Microsoft has been DMVs, which provide direct insight into many different features. The biggest difficulty in using these views has been consistency: Some accumulate data since server restart, others only maintain data that is in the plan cache, while others are only point-in-time measurements. In order to effectively use this information, it is necessary to capture, store, and analyze the data within, which is not a task suited for beginners. The alternative has often been to purchase 3rd party tools that monitor and manage this data for you, which costs money that your organization may or may not be willing to spend. The last, and least desirable option was to do none of these, and live by the seat of your pants.
Finding Top Resource Consumers
The Query Store is an impressive feature, and one that provides quite a bit of functionality, with more being added in each Community Technical Preview. We will cover accessing this data via TSQL as well as using the Management Studio GUI. And with no further ado, let’s jump into what we can do with it!
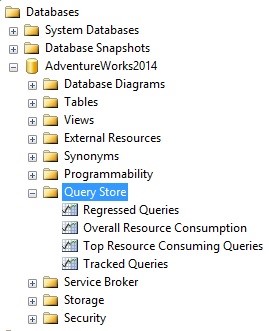
Our primary goal is to identify problematic queries, and Microsoft has provided a handful of out-of-the-box reports that allow us to quickly assess this. Within a database that has Query Store enabled, expand the Query Store menu:
Within here is a report called “Top Resource Consuming Queries”, which when run will display a screen like this:
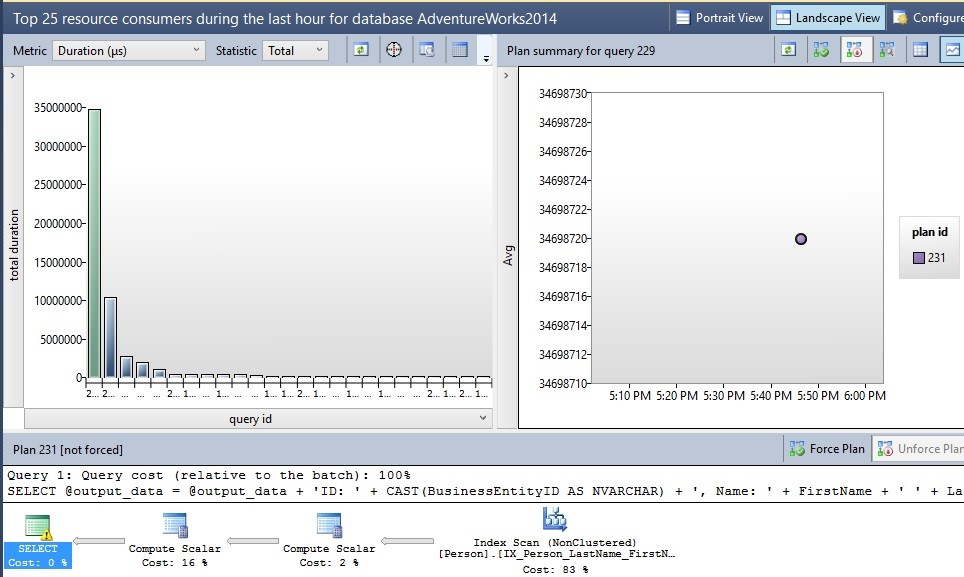
The default settings for this report show a chart of the top queries executed over the past hour, along with a graph of each query execution plan with duration, and then the actual execution plan on the bottom. From here, you can view any portion of the execution plan just as you normally would from Management Studio, or from the related dynamic management views. Query data such as this will be stored until the stale query threshold is met, or until the disk quota is met and cleanup needs to occur. This data is stored quite efficiently: My query store currently has 267 queries in it, and only 1MB is consumed of the 2GB that I allocated!
In the event that a query has multiple plans associated with it, you will be able to view each plan on the graph to the right. Below is an example of a sample query that had two different plans. You can drill into each one to learn more about when it was chosen and how it performed:
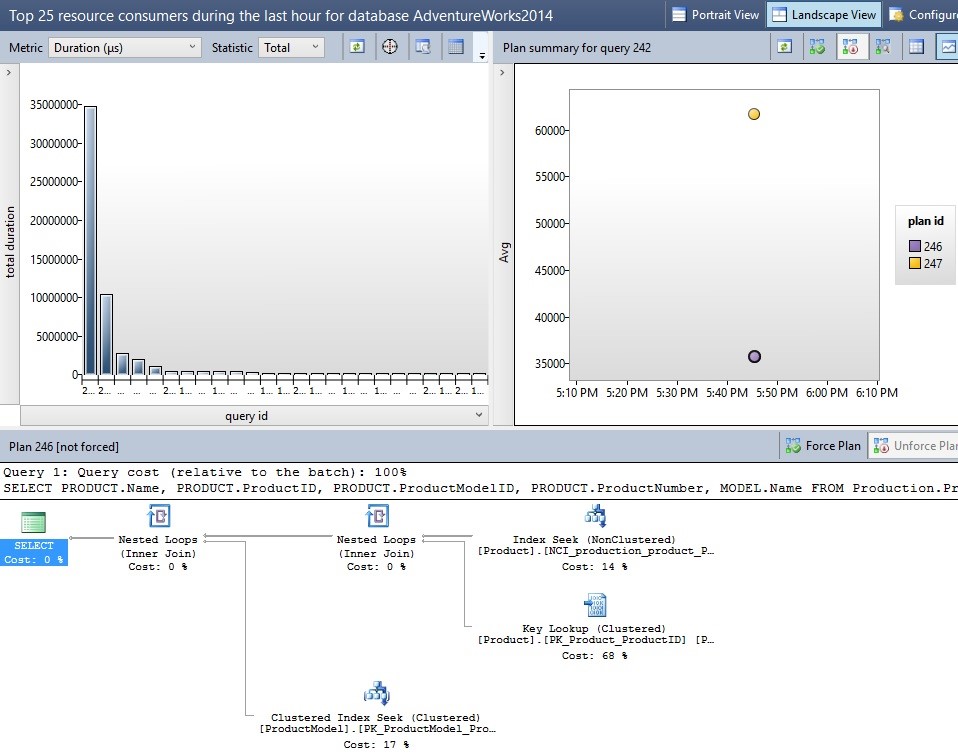
The icons on the upper right may be used to compare execution plans or to force a query to use a specific plan when possible in the future. In addition, you can change the view to create an ordered list of each plan, allowing you to more easily compare a variety of metrics all at once. Use caution when forcing plans, though, as a single plan may not always be the best one. Only force a plan if you are certain that it will be beneficial to all use cases for the given query!
Clicking on the Configure tab in the upper-right corner allows you to change a variety of options, such as which metrics to view, units, calculations, time intervals, and the number of queries to return:
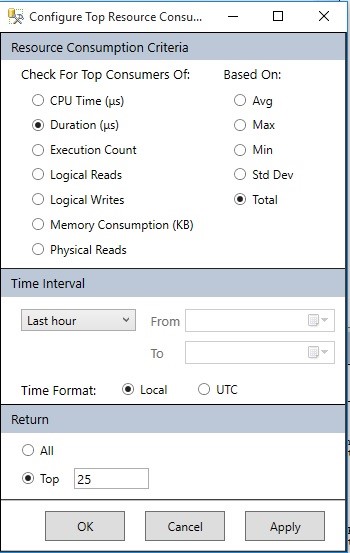
These can all be useful when tracking down specific troublesome queries. For example, if your SQL Server has been showing signs of high CPU consumption, you could focus the charts on reporting CPU, rather than duration, reads, or some other metric. In addition, you can adjust the time period to view to any within the history of the query store. This is the true value of the Query Store as you can now locate a point in time when something bad happened on your server and review it whenever you’re free to do so.
Before diving into TSQL that can be used to identify the top resource-consuming queries, let’s introduce a database diagram to show how these views are related:
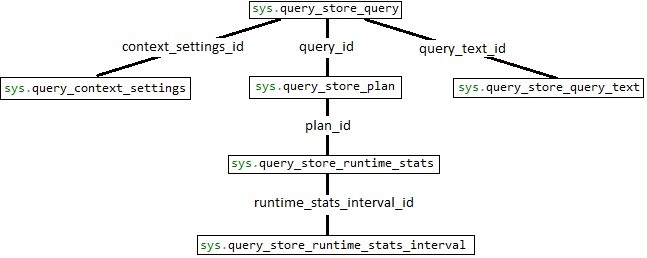
The structure of these views is fairly straight-forward, with sys.query_store_query being the root of the diagram, and additional views branching off to provide details on the execution plan, query text, stats, and more. Using the diagram, we can write a query that joins each together:
|
1 2 3 4 5 6 7 8 9 10 11 12 13 |
SELECT * FROM sys.query_store_query LEFT JOIN sys.query_store_query_text ON query_store_query.query_text_id = query_store_query_text.query_text_id LEFT JOIN sys.query_store_plan ON query_store_query.query_id = query_store_plan.query_id LEFT JOIN sys.query_store_runtime_stats ON query_store_plan.plan_id = query_store_runtime_stats.plan_id LEFT JOIN sys.query_store_runtime_stats_interval ON query_store_runtime_stats.runtime_stats_interval_id = query_store_runtime_stats_interval.runtime_stats_interval_id |
This returns absolutely everything, and does not make a very useful query, but does illustrate the important relationships above and how we will write queries against these views going forward. Now let’s pick out the most important columns to us and add some filters and sorts to make some use out of this data:
|
1 2 3 4 5 6 7 8 9 10 11 12 13 14 15 16 17 18 19 20 21 22 23 24 25 26 27 28 29 30 31 32 33 34 35 36 37 38 |
SELECT TOP 50 query_store_query_text.query_sql_text, CAST(query_store_plan.query_plan AS XML) AS query_plan_xml, query_store_runtime_stats.first_execution_time, query_store_runtime_stats.last_execution_time, query_store_runtime_stats.count_executions, query_store_runtime_stats.avg_duration AS avg_duration_microseconds, query_store_runtime_stats.last_duration AS last_duration_microseconds, query_store_runtime_stats.avg_cpu_time AS avg_cpu_time_microseconds, query_store_runtime_stats.last_cpu_time AS last_cpu_time_microseconds, query_store_runtime_stats.avg_logical_io_reads, query_store_runtime_stats.last_logical_io_reads, query_store_runtime_stats.avg_query_max_used_memory AS avg_query_max_used_memory_8k_pages, query_store_runtime_stats.last_query_max_used_memory AS last_query_max_used_memory_8k_pages, query_store_runtime_stats.avg_rowcount, query_store_runtime_stats.last_rowcount, query_store_runtime_stats_interval.start_time AS interval_start_time, query_store_runtime_stats_interval.end_time AS interval_end_time, query_store_query.query_id, query_store_query_text.query_text_id, query_store_plan.plan_id FROM sys.query_store_query LEFT JOIN sys.query_store_query_text ON query_store_query.query_text_id = query_store_query_text.query_text_id LEFT JOIN sys.query_store_plan ON query_store_query.query_id = query_store_plan.query_id LEFT JOIN sys.query_store_runtime_stats ON query_store_plan.plan_id = query_store_runtime_stats.plan_id LEFT JOIN sys.query_store_runtime_stats_interval ON query_store_runtime_stats.runtime_stats_interval_id = query_store_runtime_stats_interval.runtime_stats_interval_id WHERE query_store_runtime_stats_interval.start_time BETWEEN '11/17/2015 22:00:00' AND '11/17/2015 23:00:00' ORDER BY query_store_runtime_stats.avg_cpu_time DESC -- ORDER BY query_store_runtime_stats.avg_duration DESC -- ORDER BY query_store_runtime_stats.count_executions DESC -- ORDER BY query_store_runtime_stats.avg_logical_io_reads DESC -- ORDER BY query_store_runtime_stats.avg_rowcount DESC |
This query returns useful info on queries, their text, execution plans, and some historical statistics on their resource consumption. It filters on the start_time found in sys.query_store_runtime_stats_interval, which breaks up queries into hour-long intervals for reporting ease and does so over a fixed one hour period. The data is sorted by average CPU time, putting the greatest CPU consumers on the top of the list. Additional useful filters are provided, but commented out, for sorting on duration, execution count, logical reads, and average row count. This query will return multiple rows if multiple execution plans exist.
Tracking Queries
If there is a particular query that you want to focus on, it is possible to track it within the Query Store. For example, let’s say that my research above uncovered a particular query that was performing inconsistently. After identifying the query using one of the methods above, we can go to “Tracked Queries”, under the Query Store options within a database:
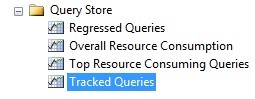
From here, a new tab opens with a text-box where you can enter a query id:
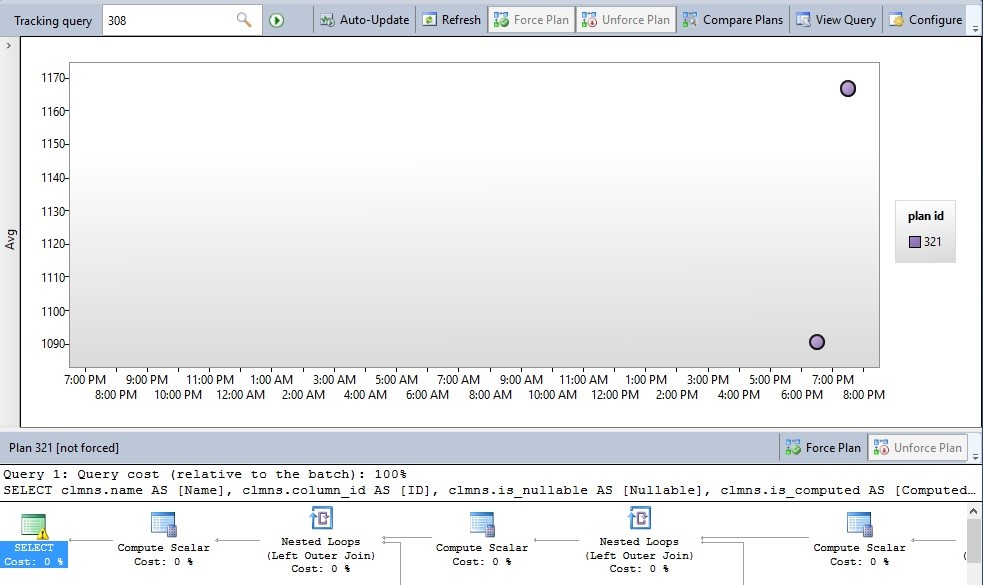
Once a query id is entered, the data for that specific query will be brought up for review. In addition to refreshing and configuring this query view, you can also enable the Auto-Update option, which will refresh the window, using whatever interval is entered in the Configure menu to the right. The default auto-refresh rate is 5s, but can be adjusted higher or lower, depending on the urgency of your research. All of the data available in the query store can be accessed here, including query text, query plans, and query stats. This feature is only available in the GUI, but is a convenient graphical interface for watching query executions and analyzing the performance results in real-time.
We can write TSQL to restrict our query search to a specific time interval, as well as an individual query or group or queries, which will essentially perform the same function:
|
1 2 3 4 5 6 7 8 9 10 11 12 13 14 15 16 17 18 19 20 21 22 23 24 25 26 27 28 29 30 31 |
SELECT TOP 50 query_store_query.query_id, query_store_query_text.query_sql_text, CAST(query_store_plan.query_plan AS XML) AS query_plan_xml, query_store_runtime_stats.first_execution_time, query_store_runtime_stats.last_execution_time, query_store_runtime_stats.count_executions, query_store_runtime_stats.avg_duration AS avg_duration_microseconds, query_store_runtime_stats.last_duration AS last_duration_microseconds, query_store_runtime_stats.avg_cpu_time AS avg_cpu_time_microseconds, query_store_runtime_stats.last_cpu_time AS last_cpu_time_microseconds, query_store_runtime_stats.avg_logical_io_reads, query_store_runtime_stats.last_logical_io_reads, query_store_runtime_stats.avg_query_max_used_memory AS avg_query_max_used_memory_8k_pages, query_store_runtime_stats.last_query_max_used_memory AS last_query_max_used_memory_8k_pages, query_store_runtime_stats.avg_rowcount, query_store_runtime_stats.last_rowcount FROM sys.query_store_query LEFT JOIN sys.query_store_query_text ON query_store_query.query_text_id = query_store_query_text.query_text_id LEFT JOIN sys.query_store_plan ON query_store_query.query_id = query_store_plan.query_id LEFT JOIN sys.query_store_runtime_stats ON query_store_plan.plan_id = query_store_runtime_stats.plan_id LEFT JOIN sys.query_store_runtime_stats_interval ON query_store_runtime_stats.runtime_stats_interval_id = query_store_runtime_stats_interval.runtime_stats_interval_id WHERE query_store_runtime_stats_interval.start_time BETWEEN '11/17/2015 22:00:00' AND '11/18/2015 22:00:00' AND query_store_query_text.query_sql_text LIKE '%SELECT * FROM Person.Person%' ORDER BY query_store_runtime_stats.last_execution_time DESC |
This example will pull all query data from the past day for any query with “SELECT * FROM Person.Person” anywhere within its SQL text and order it with the most recently executed at the top of the list. Searching query text using the query store is quite fast compared to many of the older methods of searching through query text.
Searching Execution Plans
In addition to searching through query text, we can also look through the execution plan text in order to find specific indexes used, or other operators that interest you. In the following example, we find the top 50 queries that use the IX_Person_LastName_FirstName_MiddleName index, found in the AdventureWorks database:
|
1 2 3 4 5 6 7 8 9 10 11 12 13 14 15 16 17 18 19 |
SELECT TOP 50 query_store_query.query_id, query_store_query_text.query_sql_text, CAST(query_store_plan.query_plan AS XML) AS query_plan_xml, query_store_runtime_stats.avg_logical_io_reads FROM sys.query_store_query LEFT JOIN sys.query_store_query_text ON query_store_query.query_text_id = query_store_query_text.query_text_id LEFT JOIN sys.query_store_plan ON query_store_query.query_id = query_store_plan.query_id LEFT JOIN sys.query_store_runtime_stats ON query_store_plan.plan_id = query_store_runtime_stats.plan_id LEFT JOIN sys.query_store_runtime_stats_interval ON query_store_runtime_stats.runtime_stats_interval_id = query_store_runtime_stats_interval.runtime_stats_interval_id WHERE query_store_runtime_stats_interval.start_time BETWEEN '11/17/2015 22:00:00' AND '11/18/2015 22:00:00' AND query_store_plan.query_plan LIKE '%IX_Person_LastName_FirstName_MiddleName%' ORDER BY query_store_runtime_stats.avg_logical_io_reads DESC |
The results are ordered by logical reads, allowing us to gather information about the worst IO offenders that are using a particular index. Additionally, this is a valuable way to investigate how specific indexes are used and can be a useful tool when combined with index stats. We can also search execution plans for specific database, table, column names, operator types, or even optimizer warnings. The following search will find any queries from the past day with the CONVERT_IMPLICIT operator found within the execution plan:
|
1 2 3 4 5 6 7 8 9 10 11 12 13 14 15 16 17 18 19 20 |
SELECT TOP 50 query_store_query.query_id, query_store_query_text.query_sql_text, query_store_plan.query_plan AS query_plan_text, CAST(query_store_plan.query_plan AS XML) AS query_plan_xml, query_store_runtime_stats.last_execution_time FROM sys.query_store_query LEFT JOIN sys.query_store_query_text ON query_store_query.query_text_id = query_store_query_text.query_text_id LEFT JOIN sys.query_store_plan ON query_store_query.query_id = query_store_plan.query_id LEFT JOIN sys.query_store_runtime_stats ON query_store_plan.plan_id = query_store_runtime_stats.plan_id LEFT JOIN sys.query_store_runtime_stats_interval ON query_store_runtime_stats.runtime_stats_interval_id = query_store_runtime_stats_interval.runtime_stats_interval_id WHERE query_store_runtime_stats_interval.start_time BETWEEN '11/17/2015 22:00:00' AND '11/18/2015 22:00:00' AND query_store_plan.query_plan LIKE '%convert_implicit%' ORDER BY query_store_runtime_stats.last_execution_time DESC |
This can be a potentially great way to dig up unwanted type conversions that may be harming performance, or uncover other warnings that could aid in performance optimization. If you find that there is a lot of noise in your results, additional filters can be added to remove queries on system objects or on those that are irrelevant to your research.
Regressed Queries
One additional functionality the query store has is that it allows us to track regressed queries. A regressed query is the one where resource consumption or duration increased significantly at a given point in time. This is an excellent way to identify changes due to application releases, data imports, or other significant events that can affect overall SQL Server performance. In addition, this feature can be used to find unknown database events and use that knowledge to proactively prevent such events from occurring in the future. For example, if a large number of queries on a specific table suddenly doubled in runtime and CPU consumption in a very short span of time one day, we could use that data to determine the time of the event and use the query data to figure out the details and take the necessary actions in response to it. Regressed queries can be found in the GUI in the Query Store menu within a database:
Double-clicking on Regressed Queries will open a new tab, similar to the ones we have seen thus far:
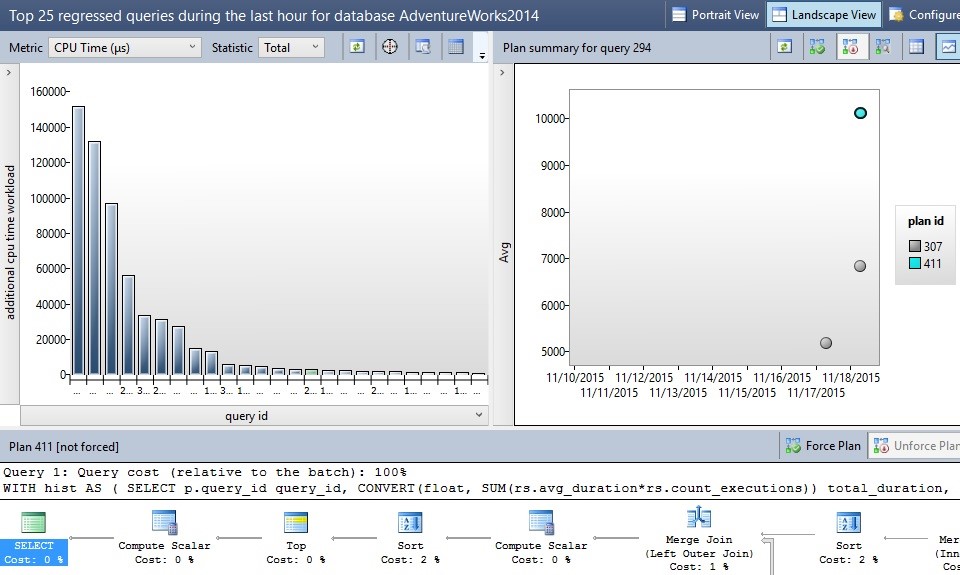
As with the other Query Store reports, you can customize to your heart’s content, as well as sort and display whatever metrics you are looking for. The goal here is to take a look at these metrics and determine which queries have truly begun to perform poorly and why. In the example above, we can determine if any queries had their CPU consumption increase greatly. There are a number of icons available that will open the execution plans or query text in a separate window, or change the graphical view to a sortable list.
The following query is an adaption of one provided by Microsoft in their SQL Server 2016 preview documentation that returns customized data on regressed queries. This provides additional information as well as more ways to filter/sort:
|
1 2 3 4 5 6 7 8 9 10 11 12 13 14 15 16 17 18 19 20 21 22 23 24 25 26 27 28 29 30 31 32 33 34 35 36 37 |
returns customized data on regressed queries. This provides additional information as well as more ways to filter/sort: SELECT query_store_query_text.query_sql_text, stats_interval_1.start_time AS interval_1, stats_interval_2.start_time AS interval_2, query_plan_1.plan_id AS plan_id_1, query_plan_2.plan_id AS plan_id_2, runtime_stats_1.avg_duration AS avg_duration_1, runtime_stats_2.avg_duration AS avg_duration_2, runtime_stats_1.avg_cpu_time AS avg_cpu_1, runtime_stats_2.avg_cpu_time AS avg_cpu_2, runtime_stats_1.avg_logical_io_reads AS avg_reads_1, runtime_stats_2.avg_logical_io_reads AS avg_reads_2 FROM sys.query_store_query_text INNER JOIN sys.query_store_query ON query_store_query_text.query_text_id = query_store_query.query_text_id INNER JOIN sys.query_store_plan AS query_plan_1 ON query_store_query.query_id = query_plan_1.query_id INNER JOIN sys.query_store_runtime_stats AS runtime_stats_1 ON query_plan_1.plan_id = runtime_stats_1.plan_id INNER JOIN sys.query_store_runtime_stats_interval AS stats_interval_1 ON stats_interval_1.runtime_stats_interval_id = runtime_stats_1.runtime_stats_interval_id INNER JOIN sys.query_store_plan AS query_plan_2 ON query_store_query.query_id = query_plan_2.query_id INNER JOIN sys.query_store_runtime_stats AS runtime_stats_2 ON query_plan_2.plan_id = runtime_stats_2.plan_id INNER JOIN sys.query_store_runtime_stats_interval AS stats_interval_2 ON stats_interval_2.runtime_stats_interval_id = runtime_stats_2.runtime_stats_interval_id WHERE stats_interval_1.start_time > DATEADD(DAY, -7, CURRENT_TIMESTAMP) AND stats_interval_2.start_time > stats_interval_1.start_time AND query_plan_1.plan_id <> query_plan_2.plan_id -- AND runtime_stats_2.avg_duration > 2 * runtime_stats_1.avg_duration -- AND runtime_stats_2.avg_logical_io_reads > 2 * runtime_stats_1.avg_logical_io_reads AND runtime_stats_2.avg_cpu_time > 2 * runtime_stats_1.avg_cpu_time ORDER BY query_store_query.query_id, stats_interval_1.start_time, stats_interval_2.start_time; |
This can be a useful way to customize the criteria used in determining a regressed query. The above example returns any queries in the past week where the CPU doubled between one execution and another future execution. Some commented TSQL allows for comparisons based on duration and reads, though any other columns could be included. For example, we could check for queries whose duration doubled while reads tripled. Alternatively, we could search for queries whose performance improved over time and determine the cause. In either case, we can use this data to hone in on important events that may require further attention in the future.
Conclusion
With the information provided so far, we could easily write an endless list of queries in order to utilize the query store data provided in this new feature. This feature was a pleasant surprise and provided a valuable tool for any database administrator’s performance tuning arsenal. Please note that all data, queries, and screenshots have been tested in SQL Server 2016 CTP 3.0 and may not work in previous or future versions as they are released. In addition to all of the features introduced so far, Microsoft has indicated that more will be added by the time SQL Server 2016 is released to the public. This gives me quite a bit to look forward to over the next year!

In his free time, Ed enjoys video games, sci-fi & fantasy, traveling, and being as big of a geek as his friends will tolerate.
View all posts by Ed Pollack
- SQL Server Database Metrics - October 2, 2019
- Using SQL Server Database Metrics to Predict Application Problems - September 27, 2019
- SQL Injection: Detection and prevention - August 30, 2019