
Introduction
There is a common need in reporting to aggregate or return data that is crunched based on date attributes. These may include weekdays, holidays, quarters, or time of year. While any of this information can be calculated on the fly, a calendar table can save time, improve performance, and increase the consistency of data returned by our important reporting processes.
What is a Calendar Table and Why is it Useful?
A calendar table is a permanent table containing a list of dates and various components of those dates. These may be the result of DATEPART operations, time of year, holiday analysis, or any other creative operations we can think of.
The primary key of this table will always be the date, or some easy-to-use representation of that date. Each subsequent column will be an attribute of that date, where the types and size of those columns can vary greatly. At first glance, it may seem that a table such as this would be superfluous, and that this data is easy to generate, but oftentimes as our reporting needs become complex, so does the creation, maintenance, and usage of this data.
As a result, storing calendar data in a permanent location can be an easy solution. Here are some reasons why this data is useful and why storing it in a dedicated table can be a great decision:
- Data is relatively easy to generate and requires little maintenance once created.
- Calendar data can be used to service any reports that require it, removing the need to recreate it in each report.
- We can implement a large number of calendar metrics, and can easily add more as needed.
- Calendar data is tiny in terms of space used. Performance against this data is generally quite fast.
- Complex reports can be simplified by removing commonly used DATEPART and DATEADD computations.
- Important business logic, such as holidays, can be centralized and maintained in a single location.
- Maintaining calendar data in a single table ensures we do not encounter inconsistencies between different reports, reporting systems, or applications that need it.
There are many different reasons why a calendar table can be useful—this article is our opportunity to create one from scratch, populate it with data, analyze it, and put it to good use!
Implementing a Calendar Table
Our first step is to identify and define metrics that we want to collect. This is where we should look at our reporting needs and determine what sorts of date-related calculations we perform on a regular basis. For our examples here, we will include 33 different metrics (plus the calendar date itself), though you are free to add more as needed. Once introduced, we’ll walk through how to populate this data, and then how to use it.
Date Parts
The simplest metrics are basic date components, including:
- Calendar Month: The numeric representation of the month, a number from 1-12.
- Calendar Day: The numeric representation of the calendar day, a number from 1-31. The maximum value depends on the month and on whether it is a leap year.
- Calendar Year: The numeric representation of the year, such as 1979 or 2017.
- Calendar Quarter: The numeric representation of the quarter, a number from 1-4.
- Day Name: The common name for the day of the week, such as Tuesday or Saturday.
- Day of Week: The numeric representation of the day of the week, a number from 1(Sunday) through 7 (Saturday). In some countries the number 1 is used to represent Monday, though here we will use Sunday for this calculation.
- Month Name: The common name for the month, such as February or October.
These are all bits and pieces of the date itself and are useful whenever we are looking to find out metrics on specific days of the week, fiscal quarters, or other date parts.
Relative Points in Time
Knowing when a date is, with respect to other calendar metrics, can be very handy in understanding how business changes over time. The following metrics allow you to determine in what part of the week, month, or year a date occurs:
- Day of Week in Month: The occurrence of a day of week within the current month. Ie: The third Thursday of the current month.
- Day of Week in Year: The occurrence of a day of week within the current year. Ie: The seventeenth Monday of the current year.
- Day of Week in Quarter: The occurrence of a day of week within the current quarter. Ie: The seventh Saturday of the current quarter.
- Day of Quarter: The day number within the current quarter.
- Day of Year: The day number out of the current year.
- Week of Month: The week number within the current month. With this calculation, the weeks count starting on the first of the month, regardless of the day of week.
- Week of Quarter: The week number within the current quarter.
- Week of Year: The week number within the current year.
- First Date of Week: The start date of the week. Sunday is assumed here, but could be defined differently.
- Last Date of Week: The end date of the week. Saturday is assumed here, but could be defined differently.
- First Date of Month: The first date of the current month.
- Last Date of Month: The last date of the current month.
- First Date of Quarter: The first date of the current quarter.
- Last Date of Quarter: The last date of the current quarter.
- First Date of Year: The first date of the current year.
- Last Date of Year: The last date of the current year.
These metrics allow us to easily determine when holidays or special dates occur. In addition, they can be used to assist with special processes that occur during specific weeks, such as tax preparation, invoicing, or other routing operations.
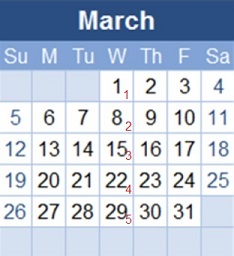
The “Day of Week of…” metrics are measures of how many of a given day have occurred thus far in a time period. The following illustration shows this metric for Wednesdays in March, 2017:
The “Day of Week of Month” for the 1st is 1, the 8th is 2, the 15th is 3, and so on. The similar metrics for quarter and year are calculated in the same fashion, by asking, “So far this year, how many Mondays have we had”, assuming the date we are looking at is a Monday.
Knowing boundaries, such as the start and end of weeks can allow for year-over-year trending by week, or for quick data crunching by specific periods in time.
Holidays and Business Days
Many business care about holidays, holiday seasons, and when business days occur. This can influence load on software systems, allocation of resources, employee coverage, and financial trending. Including some data that describes when holidays occur and what they are can greatly assist in this sort of analysis, removing the need for complex, ad-hoc reporting at a later time.
- Is Holiday? A bit that indicates if a given date is a holiday or not.
- Is Holiday Season? A bit that indicates if a given date is part of a holiday season or not.
- Holiday Name: Indicates the name of the holiday, if applicable.
- Holiday Season Name: Indicates the name of the holiday season, if applicable.
- Is Weekday? A bit that indicates if a given day is a weekday, typically Monday-Friday.
- Is Business Day? A bit that combines weekday and holiday data to determine if it is a business/work day.
- Previous Business Day: This is the immediately preceding business day.
- Next Business Day: This is the immediately following business day.
Business days can vary greatly across different industries. A week off for some may equate to the busiest week of the year for others. Summer vacation for teachers could be prime time for an outdoor amusement park. Being able to enumerate all of these rules into a handful of simple bits can make metrics-gathering significantly faster and easier!
Miscellaneous Metrics
We could come up with endless lists of date-related metrics, but for those that didn’t fit into other categories, here are a few examples that could be handy:
- Is Leap Year: Is the current date is contained within a leap year, then this bit would be set to 1.
- Days in Month: Contains the number of days in the current month.
- Calendar Date String: A representation of the date in a string, delimited by forward slashes. This is useful for quickly displaying a more familiar string-based date format to the user. Other formats can be stored, too.
The purpose of a calendar table is to improve the speed, accuracy, and ease of reporting. Many of these metrics could easily be calculated on the fly as a report is run, but over time, the need for more complex metrics would make this incredibly messy. Even getting the days in a month could be a nuisance as a CASE statement including details for leap years would be cumbersome.
Create the Dim_Date Table
Our first step is to create a calendar table for use in all of our subsequent examples:
|
1 2 3 4 5 6 7 8 9 10 11 12 13 14 15 16 17 18 19 20 21 22 23 24 25 26 27 28 29 30 31 32 33 34 35 36 37 38 39 |
CREATE TABLE dbo.Dim_Date ( Calendar_Date DATE NOT NULL CONSTRAINT PK_Dim_Date PRIMARY KEY CLUSTERED, -- The date addressed in this row. Calendar_Date_String VARCHAR(10) NOT NULL, -- The VARCHAR formatted date, such as 07/03/2017 Calendar_Month TINYINT NOT NULL, -- Number from 1-12 Calendar_Day TINYINT NOT NULL, -- Number from 1 through 31 Calendar_Year SMALLINT NOT NULL, -- Current year, eg: 2017, 2025, 1984. Calendar_Quarter TINYINT NOT NULL, -- 1-4, indicates quarter within the current year. Day_Name VARCHAR(9) NOT NULL, -- Name of the day of the week, Sunday...Saturday Day_of_Week TINYINT NOT NULL, -- Number from 1-7 (1 = Sunday) Day_of_Week_in_Month TINYINT NOT NULL, -- Number from 1-5, indicates for example that it's the Nth saturday of the month. Day_of_Week_in_Year TINYINT NOT NULL, -- Number from 1-53, indicates for example that it's the Nth saturday of the year. Day_of_Week_in_Quarter TINYINT NOT NULL, -- Number from 1-13, indicates for example that it's the Nth saturday of the quarter. Day_of_Quarter TINYINT NOT NULL, -- Number from 1-92, indicates the day # in the quarter. Day_of_Year SMALLINT NOT NULL, -- Number from 1-366 Week_of_Month TINYINT NOT NULL, -- Number from 1-6, indicates the number of week within the current month. Week_of_Quarter TINYINT NOT NULL, -- Number from 1-14, indicates the number of week within the current quarter. Week_of_Year TINYINT NOT NULL, -- Number from 1-53, indicates the number of week within the current year. Month_Name VARCHAR(9) NOT NULL, -- January-December First_Date_of_Week DATE NOT NULL, -- Date of the first day of this week. Last_Date_of_Week DATE NOT NULL, -- Date of the last day of this week. First_Date_of_Month DATE NOT NULL, -- Date of the first day of this month. Last_Date_of_Month DATE NOT NULL, -- Date of the last day of this month. First_Date_of_Quarter DATE NOT NULL, -- Date of the first day of this quarter. Last_Date_of_Quarter DATE NOT NULL, -- Date of the last day of this quarter. First_Date_of_Year DATE NOT NULL, -- Date of the first day of this year. Last_Date_of_Year DATE NOT NULL, -- Date of the last day of this year. Is_Holiday BIT NOT NULL, -- 1 if a holiday Is_Holiday_Season BIT NOT NULL, -- 1 if part of a holiday season Holiday_Name VARCHAR(50) NULL, -- Name of holiday, if Is_Holiday = 1 Holiday_Season_Name VARCHAR(50) NULL, -- Name of holiday season, if Is_Holiday_Season = 1 Is_Weekday BIT NOT NULL, -- 1 if Monday-->Friday, 0 for Saturday/Sunday Is_Business_Day BIT NOT NULL, -- 1 if a workday, otherwise 0. Previous_Business_Day DATE NULL, -- Previous date that is a work day Next_Business_Day DATE NULL, -- Next date that is a work day Is_Leap_Year BIT NOT NULL, -- 1 if current year is a leap year. Days_in_Month TINYINT NOT NULL -- Number of days in the current month. ); |
There are two ways to approach the structure of this data. One is to create computed columns that automatically populate based on the date, and the other is to populate all via script instead. I have chosen to allow for manual population with the rationale being:
- Even if we toss 100 years of data into the date table, performance will be good enough that it will populate in approximately a few minutes.
- Being able to use metrics immediately for further calculations Is immensely useful, simplifying code & maintenance. This is especially handy for more complex calculations involving calendars and holidays.
- Populating a calendar table is a one-time affair. Once complete, the data is available indefinitely.
Also note that the primary key on the table is a DATE. Integers have often been used as the primary key on calendar tables in older versions of SQL Server due to the lack of an appropriate DATE data type. Not only is DATE more intuitive and easier to use, but it only consumes 3 bytes instead of 4 for an INT. In theory, a SMALLINT (2 bytes) could be used, but there is some risk of overflow if we decide to trend far into the past or into the future. If for any reason (backward compatibility, etc…) you needed to use an integer, augmenting this process to do so would not be difficult.
Once created, we can move forward with creating a stored procedure that can be used to insert data into this table.
Populating a Calendar Table
To keep our stored proc simple, we’ll have only 2 parameters: A start and end date. Any existing data in this date range will be deleted and repopulated in its entirety. This allows for easy recreation of data in the event that any changes are made to this process, such as defining holidays or business days.
|
1 2 3 4 5 6 7 8 |
CREATE PROCEDURE dbo.Populate_Dim_Date @Start_Date DATE, @End_Date DATE AS BEGIN SET NOCOUNT ON; |
With the proc declaration out of the way, we can quickly check for a few anomalous conditions that we would want to alert on:
|
1 2 3 4 5 6 7 8 9 10 11 12 13 |
IF @Start_Date IS NULL OR @End_Date IS NULL BEGIN SELECT 'Start and end dates MUST be provided in order for this stored procedure to work.'; RETURN; END IF @Start_Date > @End_Date BEGIN SELECT 'Start date must be less than or equal to the end date.'; RETURN; END |
These validations ensure that we are not passing in NULL data or end dates that occur prior to start dates. The error is a nudge on the shoulder instead of throwing a RAISERROR, as this is more of a maintenance utility than an ongoing process.
The next step is to remove any data from Dim_Date that falls within the range specified:
|
1 2 3 4 |
DELETE FROM dbo.Dim_Date WHERE Dim_Date.Calendar_Date BETWEEN @Start_Date AND @End_Date; |
In order to accurately generate our data, I chose a methodical approach in which we declare variables, assign them one at a time, and then insert a row into Dim_Date when complete. The iterative approach is typically going to operate slower than a set-based approach, but the ability to use scalar variables to do so helps keep that runtime acceptable. A set-based approach could be devised with a numbers table or set of CTEs in order to reduce runtime, but the trade-off would be complexity and contention.
The long laundry list of local variables is as follows:
|
1 2 3 4 5 6 7 8 9 10 11 12 13 14 15 16 17 18 19 20 21 22 23 24 25 26 27 28 29 30 31 32 33 34 35 |
DECLARE @Date_Counter DATE = @Start_Date; DECLARE @Calendar_Date_String VARCHAR(10); DECLARE @Calendar_Month TINYINT; DECLARE @Calendar_Day TINYINT; DECLARE @Calendar_Year SMALLINT; DECLARE @Calendar_Quarter TINYINT; DECLARE @Day_Name VARCHAR(9); DECLARE @Day_of_Week TINYINT; DECLARE @Day_of_Week_in_Month TINYINT; DECLARE @Day_of_Week_in_Year TINYINT; DECLARE @Day_of_Week_in_Quarter TINYINT; DECLARE @Day_of_Quarter TINYINT; DECLARE @Day_of_Year SMALLINT; DECLARE @Week_of_Month TINYINT; DECLARE @Week_of_Quarter TINYINT; DECLARE @Week_of_Year TINYINT; DECLARE @Month_Name VARCHAR(9); DECLARE @First_Date_of_Week DATE; DECLARE @Last_Date_of_Week DATE; DECLARE @First_Date_of_Month DATE; DECLARE @Last_Date_of_Month DATE; DECLARE @First_Date_of_Quarter DATE; DECLARE @Last_Date_of_Quarter DATE; DECLARE @First_Date_of_Year DATE; DECLARE @Last_Date_of_Year DATE; DECLARE @Is_Holiday BIT; DECLARE @Is_Holiday_Season BIT; DECLARE @Holiday_Name VARCHAR(50); DECLARE @Holiday_Season_Name VARCHAR(50); DECLARE @Is_Weekday BIT; DECLARE @Is_Business_Day BIT; DECLARE @Is_Leap_Year BIT; DECLARE @Days_in_Month TINYINT; |
There is a variable for nearly every column, allowing calculations to be kept simple. We also benefit from being able to use any calculations in subsequent operations. @Date_Counter will iterate from @Start_Date through @End_date, as we insert rows into our calendar table.
From this point on, we enter a loop, assign values to the variables, and then insert a row into Dim_Date. The following are all of these calculations, along with a description of what they mean:
|
1 2 3 4 5 6 7 8 9 |
SELECT @Calendar_Month = DATEPART(MONTH, @Date_Counter); SELECT @Calendar_Day = DATEPART(DAY, @Date_Counter); SELECT @Calendar_Year = DATEPART(YEAR, @Date_Counter); SELECT @Calendar_Quarter = DATEPART(QUARTER, @Date_Counter); SELECT @Day_of_Week = DATEPART(WEEKDAY, @Date_Counter); SELECT @Day_of_Year = DATEPART(DAYOFYEAR, @Date_Counter); SELECT @Week_of_Year = DATEPART(WEEK, @Date_Counter); |
These seven variables all represent date parts and can be captured using DATEPART and some simple TSQL. Once we have these values, we can derive additional information about the date:
|
1 2 3 4 |
SELECT @Calendar_Date_String = CAST(@Calendar_Month AS VARCHAR(10)) + '/' + CAST(@Calendar_Day AS VARCHAR(10)) + '/' + CAST(@Calendar_Year AS VARCHAR(10)); |
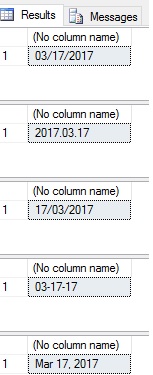
Capturing a string version of the date is handy for quick & reliable display in a specific format. The format MM/DD/YYYY is used above, but could very easily be tinkered with in order to display using other orderings or delimiters. CONVERT may be also used to format the date in a variety of forms. For example, consider the following TSQL:
|
1 2 3 4 5 6 7 |
SELECT CONVERT(VARCHAR(25), CURRENT_TIMESTAMP, 101); SELECT CONVERT(VARCHAR(25), CURRENT_TIMESTAMP, 102); SELECT CONVERT(VARCHAR(25), CURRENT_TIMESTAMP, 103); SELECT CONVERT(VARCHAR(25), CURRENT_TIMESTAMP, 10); SELECT CONVERT(VARCHAR(25), CURRENT_TIMESTAMP, 107); |
The results show a bunch of ways that we can take a date and reformat it based on local, international, or stylistic formats:
|
1 2 3 4 5 6 7 8 |
SELECT @Is_Weekday = CASE WHEN @Day_of_Week IN (1, 7) THEN 0 ELSE 1 END; SELECT @Is_Business_Day = @Is_Weekday; |
Weekdays are defined here as all days of the week except Saturday & Sunday (the weekend). In some countries or businesses, this may be defined differently, and can easily be tweaked for those purposes. Business days will be defined as all weekdays that are also not holidays. We will handle holidays near the end of our stored procedure, but will set this equal to @Is_Weekday for now, as a convenience for our future calculations where we will set this equal to zero for any holidays identified.
|
1 2 3 4 5 6 7 8 9 10 11 12 13 14 15 16 17 18 19 20 21 22 23 24 25 26 |
SELECT @Day_Name = CASE @Day_of_Week WHEN 1 THEN 'Sunday' WHEN 2 THEN 'Monday' WHEN 3 THEN 'Tuesday' WHEN 4 THEN 'Wednesday' WHEN 5 THEN 'Thursday' WHEN 6 THEN 'Friday' WHEN 7 THEN 'Saturday' END; SELECT @Month_Name = CASE @Calendar_Month WHEN 1 THEN 'January' WHEN 2 THEN 'February' WHEN 3 THEN 'March' WHEN 4 THEN 'April' WHEN 5 THEN 'May' WHEN 6 THEN 'June' WHEN 7 THEN 'July' WHEN 8 THEN 'August' WHEN 9 THEN 'September' WHEN 10 THEN 'October' WHEN 11 THEN 'November' WHEN 12 THEN 'December' END; |
Month and day names are provided as a convenience and can be pulled in order to quickly display date-related strings in a variety of formats.
|
1 2 3 4 5 6 |
SELECT @Day_of_Quarter = DATEDIFF(DAY, DATEADD(QUARTER, DATEDIFF(QUARTER, 0 , @Date_Counter), 0), @Date_Counter) + 1; SELECT @Day_of_Year = DATEPART(DAYOFYEAR, @Date_Counter); SELECT @Week_of_Month = DATEDIFF(WEEK, DATEADD(WEEK, DATEDIFF(WEEK, 0, DATEADD(MONTH, DATEDIFF(MONTH, 0, @Date_Counter), 0)), 0), @Date_Counter ) + 1; SELECT @Week_of_Quarter = DATEDIFF(DAY, DATEADD(QUARTER, DATEDIFF(QUARTER, 0, @Date_Counter), 0), @Date_Counter)/7 + 1; |
These statements perform a bit of more complex date math in order to determine the position of the date within its month, quarter, or year. The basis of these calculations is to calculate the start of a given year, week, or month, and then subtract the days or weeks from that point in time and the date being calculated. To emphasize the results, though, and their relative simplicity, the following TSQL results show the date, day of week, and day of week within the month for the start of 2017:
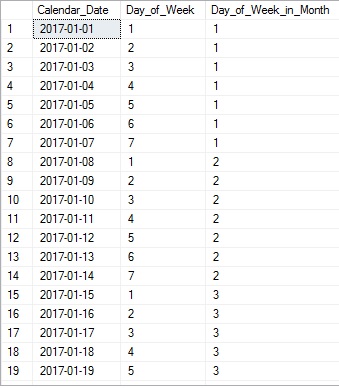
The results show that we are starting at the beginning of the month and breaking it into sets of seven. The same pattern holds true for the quarterly and yearly metrics.
|
1 2 3 4 5 6 7 8 9 10 |
SELECT @First_Date_of_Week = DATEADD(DAY, -1 * @Day_of_Week + 1, @Date_Counter); SELECT @Last_Date_of_Week = DATEADD(DAY, 1 * (7 - @Day_of_Week), @Date_Counter); SELECT @First_Date_of_Month = DATEADD(DAY, -1 * DATEPART(DAY, @Date_Counter) + 1, @Date_Counter); SELECT @Last_Date_of_Month = EOMONTH(@Date_Counter); SELECT @First_Date_of_Quarter = DATEADD(QUARTER, DATEDIFF(QUARTER, 0, @Date_Counter), 0); SELECT @Last_Date_of_Quarter = DATEADD (DAY, -1, DATEADD(QUARTER, DATEDIFF(QUARTER, 0, @Date_Counter) + 1, 0)); SELECT @First_Date_of_Year = DATEADD(YEAR, DATEDIFF(YEAR, 0, @Date_Counter), 0); SELECT @Last_Date_of_Year = DATEADD(DAY, -1, DATEADD(YEAR, DATEDIFF(YEAR, 0, @Date_Counter) + 1, 0)); |
Determining the first and last dates in a given week, month, quarter, or year are similar calculations to positions in time. To figure out the first date in a period, we determine how far into the period we are and subtract that number of days. To determine the last date in a period, we do the opposite, subtracting the current date position from the period length. @Last_Date_of_Month can be determined with a built-in function, EOMONTH, which saves us a bit of work on that calculation.
|
1 2 3 4 5 |
SELECT @Day_of_Week_in_Month = (@Calendar_Day + 6) / 7; SELECT @Day_of_Week_in_Year = (@Day_of_Year + 6) / 7; SELECT @Day_of_Week_in_Quarter = (@Day_of_Quarter + 6) / 7; |
We can figure out the count of how many given days have occurred up to (and including) the date in question by taking the day number in the period, “rounding up” and dividing by seven (without a remainder). This breaks the period into weekly chunks, allowing us to understand where in the total period the current date falls.
|
1 2 3 4 5 6 7 8 9 10 11 12 13 14 15 |
SELECT @Is_Leap_Year = CASE WHEN @Calendar_Year % 4 <> 0 THEN 0 WHEN @Calendar_Year % 100 <> 0 THEN 1 WHEN @Calendar_Year % 400 <> 0 THEN 0 ELSE 1 END; SELECT @Days_in_Month = CASE WHEN @Calendar_Month IN (4, 6, 9, 11) THEN 30 WHEN @Calendar_Month IN (1, 3, 5, 7, 8, 10, 12) THEN 31 WHEN @Calendar_Month = 2 AND @Is_Leap_Year = 1 THEN 29 ELSE 28 END; |
The first BIT column determines if it is a leap year, which can help in knowing how many days are in the year, are in February, or if a leap year child actually gets a birthday in a given year. The second column uses the calendar month and that leap year bit to determine the number of days in the month, which prevents the need to figure it out later.
What is Next?
At this point we have defined all of the data elements we are looking for that can easily be determined up front, picked out data types, and completed those calculations. If you have any additional metrics to add, this is the place to do it. The process to do so is simple:
- Add a new column to Dim_Date
- Create a new local variable for the metric to be added.
- Add a new calculation to assign the appropriate value into that variable.
Likewise, removing a column is the opposite process: Remove the column in Dim_Date, the local variable, and the subsequent calculation.
Our next steps are:
- Turn the variables above into a row that we insert into Dim_Date.
- Use set-based calculations to add holiday metrics to our data.
- Run tests of the stored procedure in order to validate the results.
Conclusion
Calendar tables are extremely useful in any reporting, analytics, or even OLTP use case in which we need to frequently join data on data-related attributes. Not only can they greatly improve performance, but they simplify our code and allow reporting engines to consume that data with ease. As a bonus, we gain maintainability as we can retain a single copy of calendar data in one place. This reduces the likelihood of coding mistakes when operating on date data, especially when the calculations are complex.
Design a calendar table based on the needs of your application and add, remove, or adjust columns as needed. The metrics that matter most to one industry may be irrelevant to another. Completeness is key when creating a structure such as this, though. Consider what metrics you will need, both now and in the future. Also consider how much data you’ll need. Determine the minimum and maximum dates you’re going to need, and be ready to add or remove any when business needs change.
Flexibility, performance, and maintainability are the primary gains to be had when using a calendar table. If you think of any interesting ideas that have not been mentioned here, feel free to share!
Next articles in this series:
References and Further Reading
- This provides a complete list of date-related data types and functions, which can be used for generating date dimensions: Date and Time Data Types and Functions (Transact-SQL)
- Some notes on calendar use in SSAS 2016 and later: Create a Date type Dimension
- Details on all of SQL Server’s data types. Consider the smallest data type that fully covers a given use case. This saves space and improves performance! Data Types (Transact-SQL)
- This is a link to the reference for all DATE formats, which is very helpful for determining how to quickly turn a date data type into a string without the need to pull it apart and reconstruct it from scratch. CAST and CONVERT (Transact-SQL)
Always check your results and make sure that calendar data is correct. It’s easy to update and replace, so do not hesitate to apply sufficient scrutiny as this data is intended to be used in many places.

In his free time, Ed enjoys video games, sci-fi & fantasy, traveling, and being as big of a geek as his friends will tolerate.
View all posts by Ed Pollack
- SQL Server Database Metrics - October 2, 2019
- Using SQL Server Database Metrics to Predict Application Problems - September 27, 2019
- SQL Injection: Detection and prevention - August 30, 2019