
SSIS performance counters
Although there is no real standardized classification of SQL Server Integration Services performance counters, the two main types are:
SSIS Service performance counters, which are the main topic of this article, and
SSIS Pipeline performance counters, which regard the processes around package execution, management and specific data flow engine options.
SSIS Service performance counters
SSIS Service performance counters are system-obtained registers that include CPU, logical disks and memory usage, or simply, the hardware activities that involve SSIS service as a main process. These counters are strictly dependent on the hardware resources which SQL Server, with active Integration Services service, is using, but also can show the data trace of SSIS data workflow itself, while reading/writing to disk resources. Some of the SSIS performance counters are more important for analyzing, because they show memory consumption during processing. Therefore, monitoring these resources is crucial, in order to prevent CPU/storage/memory overriding/leaking and to pre-empt potential issues that can slow down or interrupt a normal data flow.
Informally, there are three groups of SSIS Service performance counters: 1) CPU, 2) Logical disks and 3) Memory performance counters.
-
CPU performance counters
Processor Time (Total): indicates actual amount of time which the processor is allocating two Windows processes (sqlservr.exe and dtexec.exe, SQL Server instance and Integration Services Utility instance respectively), while packages execution tasks are simultaneously operating. There are several subtypes of this particular counter, but this is mentioned for monitoring SSIS in general, because it summarizes and aggregates all the aspects of processor usage.
-
Logical disks performance counters
Note: The logical disk is a virtual volume consisted of physical storage partitions, which provides a wider area for reading/writing data.
Disk Read Bytes/sec: calculates the speed of reading/moving data from the logical disk or disks.
Average Disk Bytes/Read: indicates the average speed of reading/moving data from the logical disk or disks.
Disk Writes Bytes/sec: calculates the speed of writing data from the logical disk or disks.
Average Disk Bytes/Write: indicates the average speed of writing data from the logical disk or disks.
Disk Queue Length: this performance counter matters when it comes to disk overload, and it indicates the amount of non-processed transactions in waiting. Disk Queue Length was more relevant when most SQL servers were running from local systems with limited resources (physical disks, small RAM e.g.), but it is still helpful when executing large packages and it is needed to see any performance pressures in the execution process.
-
Memory performance counters
The most important SSIS related performance counters are memory-related. The reason is simple: although SSIS processes acquire some of the logical disk resources, while reading from the source and writing to the destination, they rely heavily on system memory, physical or virtual.
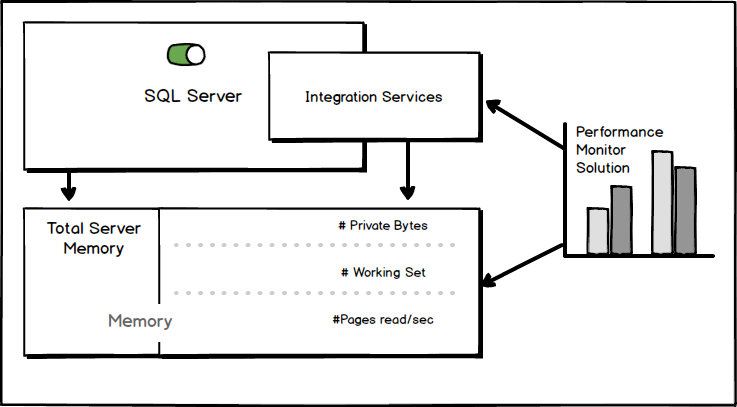
To help illustrate this better, the image below shows the relations between the elements and what is happening “under the hood” when Integration Services service is running.

As can be seen, memory is virtually “occupied” by four performance counters: Total Server Memory (which relates to SQL Server process), and three performance counters which regards the Integration Services process: Private Bytes, Working Set and Pages Read/sec. Interaction of these two processes can be monitored through Processor Time (Total) performance counter. The Performance Monitor solution is a theoretical application which is tracing all of these calculations and graphically represents them according to the monitored sources.
The details about each of the performance counter are as follows:
Private Bytes (dtexec.exe): it indicates the actual amount of memory, including pagefile usage, specifically allocated by the Integration Services service process. The Private Bytes performance counter acquires memory resources only for a dedicated process, and it cannot be shared. The dtexec.exe process should be in normal priority, otherwise the SSIS workflow could be interrupted or slowed down.
Working Set (dtexec.exe): this performance counter is similar to the Private bytes, but it shows the full amount of physical memory allocated by the Integration Services service process. Memory consumption of the dtexec.exe process can range from 2GB (32-bit SSIS service process on 32-bit system, or 64-bit SSIS service process on 64-bit system) to 4 GB (32-bit SSIS service process on 64-bit system) in full capacity. The Working set performance counter’s resources can be allocated by other process.
Total Server Memory (sqlservr.exe): it indicates a full volume of memory allocated by SQL Server instance only. This process can overwhelm RAM, which could interrupt the flow of the other processes, unless it has a configured limitation.
Page Reads/sec: this performance counter shows the total amount of memory pressure on the system. It accesses file data (in a form of pagefiles) for applications (in this case, dtexec.exe) by resolving memory references (like cache memory) for those pagefiles which are not present at that moment in the memory. High values of this performance counter does not reflect the true reason of high memory pressure – various counters can be the real cause of overloading, and it is case-related. One case could be, if Page reads/sec counter frequently shows value beneath 500/sec for SSIS service instance, the system is pressurized.
Useful links:
- SQL Server processor performance metrics – Part 1 – the most important CPU metrics
- SQL Server memory performance metrics – Part 1 – Memory pages/sec and Memory page faults/sec
- Top 10 SQL Server Integration Services Best Practices

Daniel is currently working for ApexSQL LLC as Software sales engineer where he specializes for the BI environment.
- How to monitor the SQL Server tempdb database - July 6, 2017
- How to monitor total SQL Server indexes size - June 12, 2017
- How to set and use encrypted SQL Server connections - May 8, 2017