
In this article, we will explore SQL Server Profiler in Azure Data Studio in detail including download and installation, execution plans, coding T-SQL and more.
Microsoft launched the cross-platform tool, which can be installed on the Windows, Linux and the MacOS. Previously its public preview launched on 15th November 2017 as SQL Operations Studio. Recently in Ignite 2018 event, Microsoft launched its general availability version on 24th September 2018 as Azure Data Studio. We can manage both the on-premises as well as the cloud database using this tool.
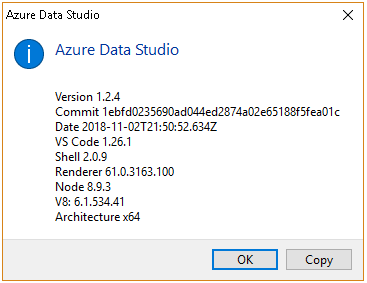
We are getting the monthly release of the Azure Data Studio. In this article, I am using the November release of Azure Data Studio on Windows OS. The latest version of Azure Data Studio is 1.2.4.
Get details of the installed Azure Data Studio from ‘ Help->about.’

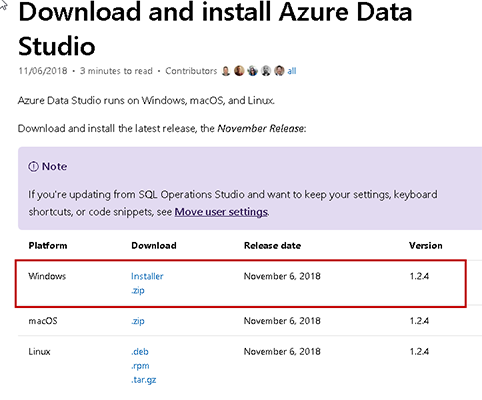
You can download Azure Data Studio using the Microsoft docs. Download the tool as per the platform you have and install it accordingly.
Azure Data Studio allows adding functionality into this tool with extensions. We have many extensions available in the marketplace to download and install without any cost. Few important extensions in Azure Data Studio are as below:
- SQL Server 2019 (preview): this extension provides support for the SQL Server 2019 features and enhancements including big data clusters, enhanced PolyBase, Azure notebook etc
- SQL Server Agent: We can manage SQL Server jobs using this extension
- Whoisactive: We can monitor and troubleshoot performance issue with this extension that runs a sp_whoIsActive stored procedure
- Server Reports: We can view the server reports such as DB space usage, DB buffer usage, CPU utilization, backup growth trend using this extension
- Redgate SQL Search: we can search objects across multiple databases using this extension.
- SQL Server Profiler: We can monitor SQL Server using this extension
SQL Server Profiler
SQL Server Profiler extension gives us feasibility to monitor or trace SQL Server. We can use this tool to identify problematic queries, slow running queries, monitor SQL Server performance, capture data using performance counter etc.
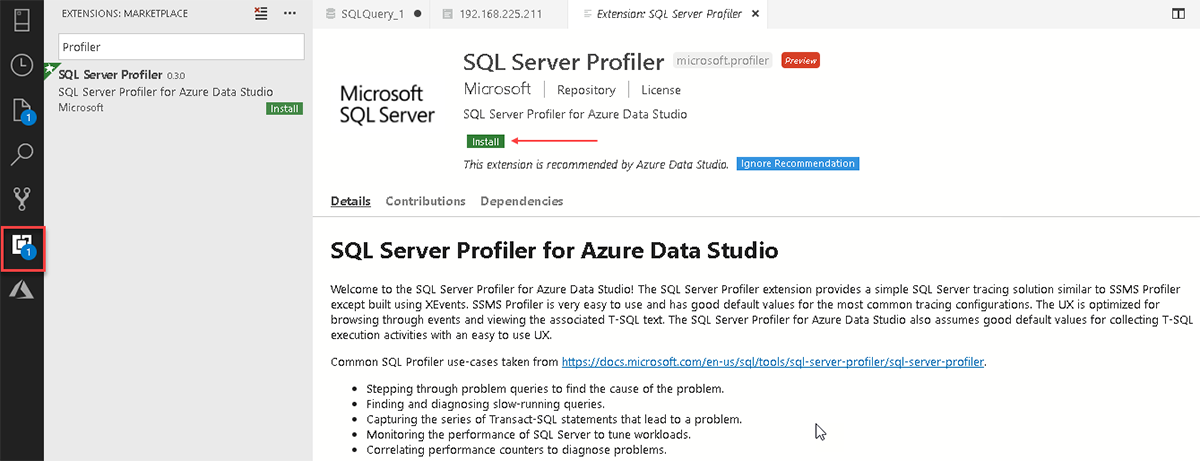
First, we need to install it from the SQL Server Profiler. In the marketplace from the left menu bar, search the extension ‘SQL Server Profiler’ and Install it.
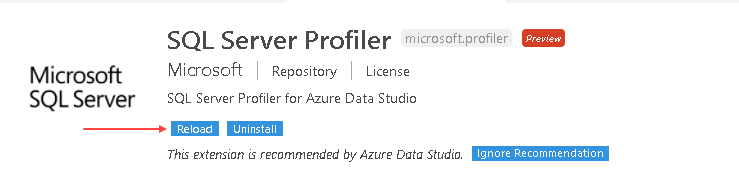
It quickly installs the extension. Click on ‘Reload’ to restart the Azure Data Studio. This will activate the SQL Server Profiler extension.
>
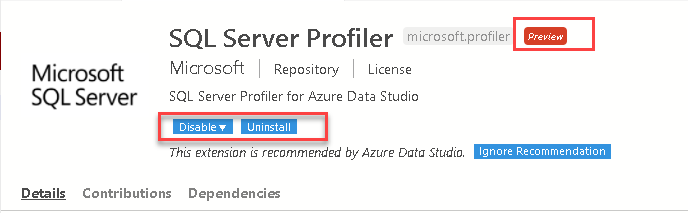
After we restart Azure Data Studio, SQL Server Profiler extension status changes to ‘Disable or uninstall’. You can also note here that SQL Server Profiler extension is in a preview state, we might get further enhancements in coming releases.
We can launch the SQL Server Profiler from the command pallet. Click on the View->Command Pallet -> Profiler->New Profiler
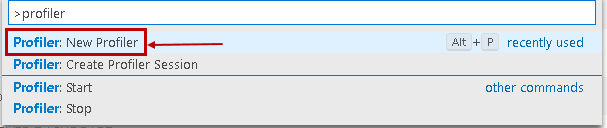
Alternatively, we can use the shortcut key Alt + P. It launches’ the create new profiler section’ as shown below.
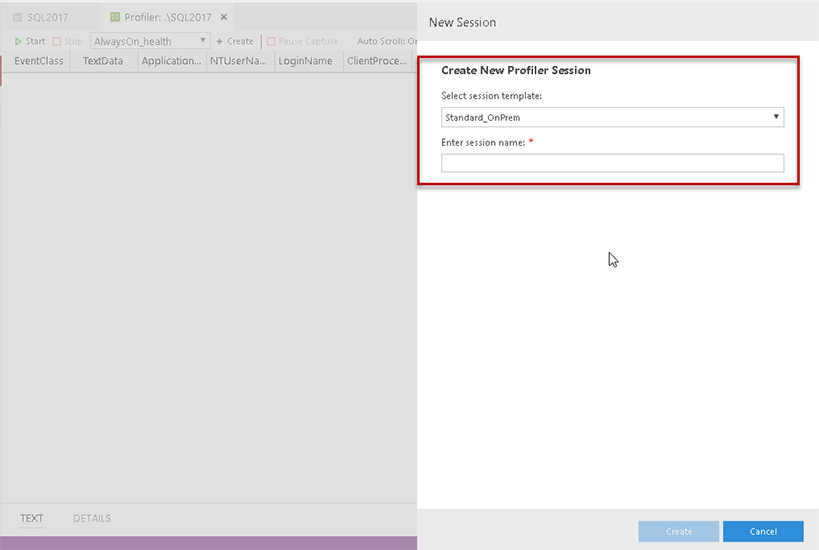
In this, we can define the session template from the drop-down list.
- Standard_OnPrem: We can Monitor the SQL Server on Premise instance
- Standard_Azure: We can monitor Azure SQL DB using this template
- TSQL_OnPrem: We can monitor the transact SQL statements using this template
Select the session template and specifies a session name. Click on Create to start the session.
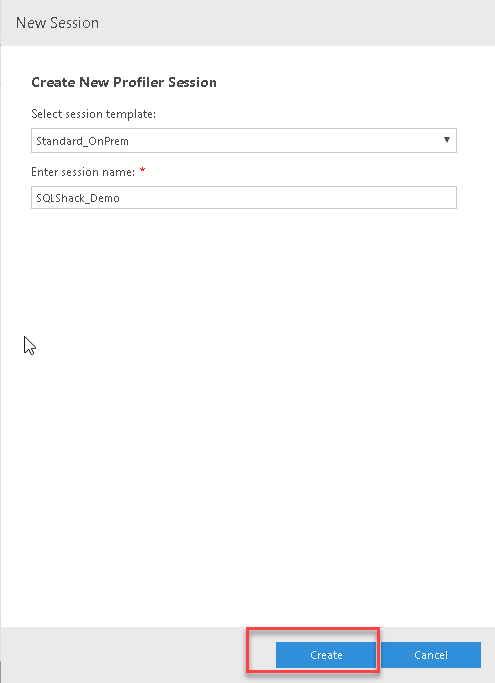
This starts the profiler session as shown here.
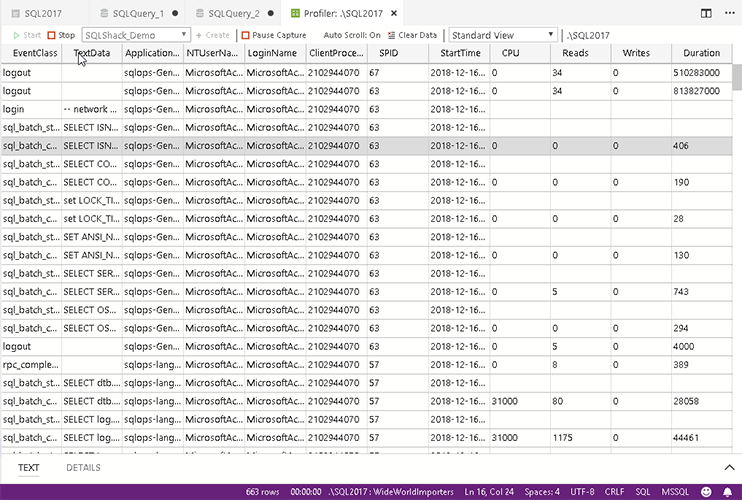
On top of the profiler window, we get the following menu bar.

- Start: If the profiler session is already running, it is disabled
- Stop: Click on ‘stop’ to stop capturing the details
- Pause Capture: We can pause the trace session using this option. While the session is pause state, it will not capture the event until it is resumed
- Auto Scroll – On: it automatically scrolls down the captured events with this option. If we do not want to scroll automatically, click on it and it changes to Auto Scroll – off
-
View: We can view the data from the multiple inbuilt views using the drop down option
- Standard View
- TSQL View
- Tuning View
- TSQL_Locks View
- TSQL_Duration View
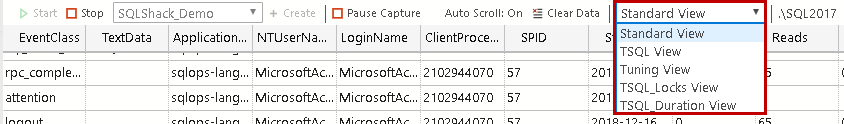
Let us view each view in below images.
Standard View: In the standard view, we get complete information about the query such as CPU, Reads, Writes, Duration, Login, Text data etc.
In other views, we can get specific information filtered out from the standard view.
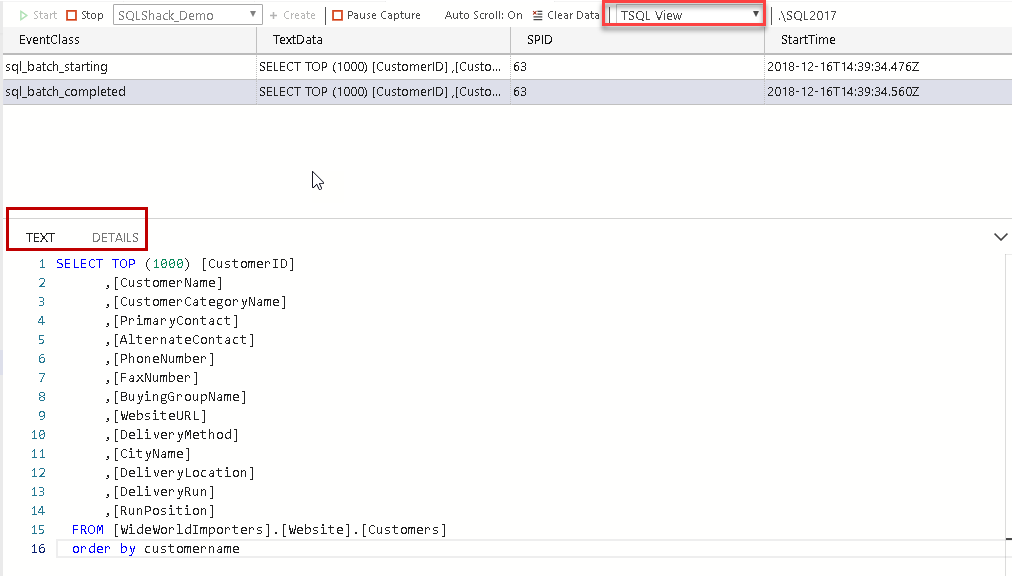
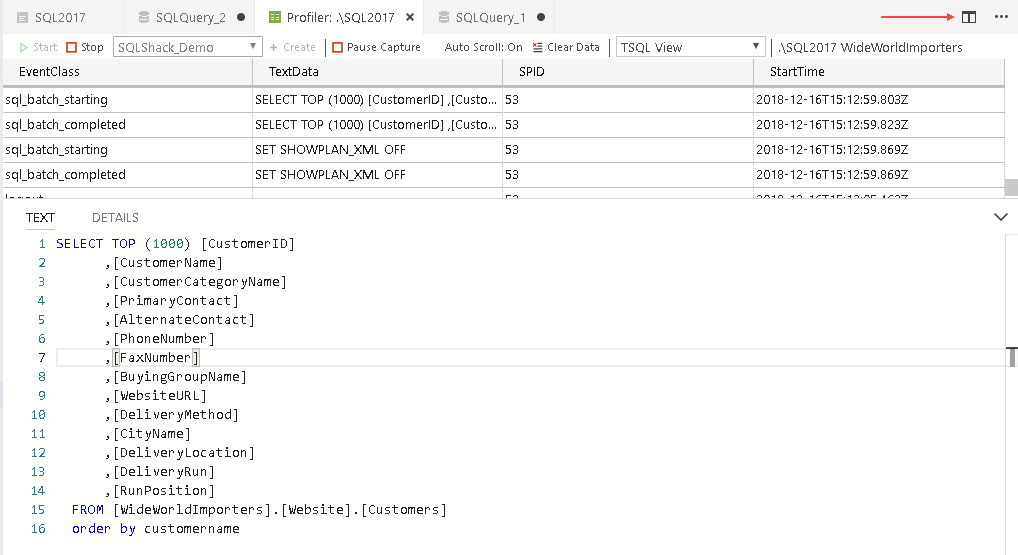
TSQL View: In this view, we get the details about running SQL queries.
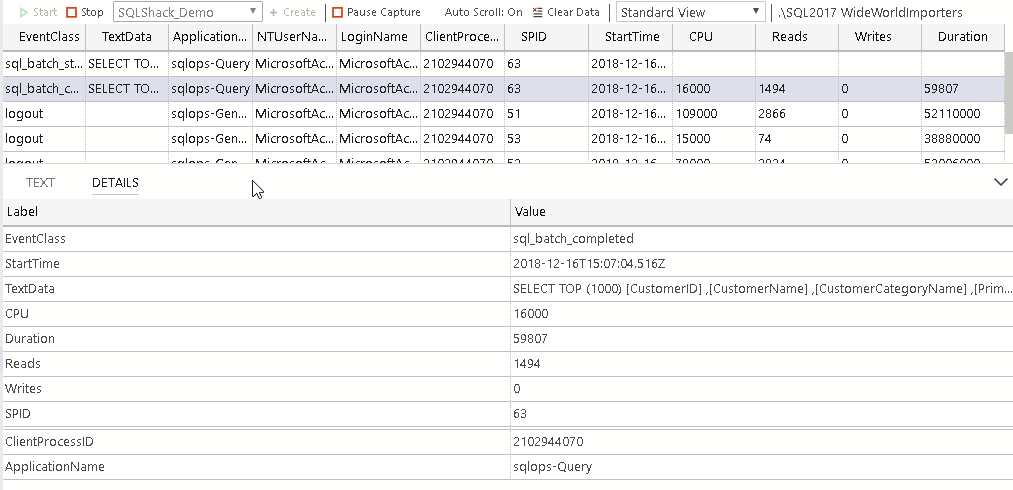
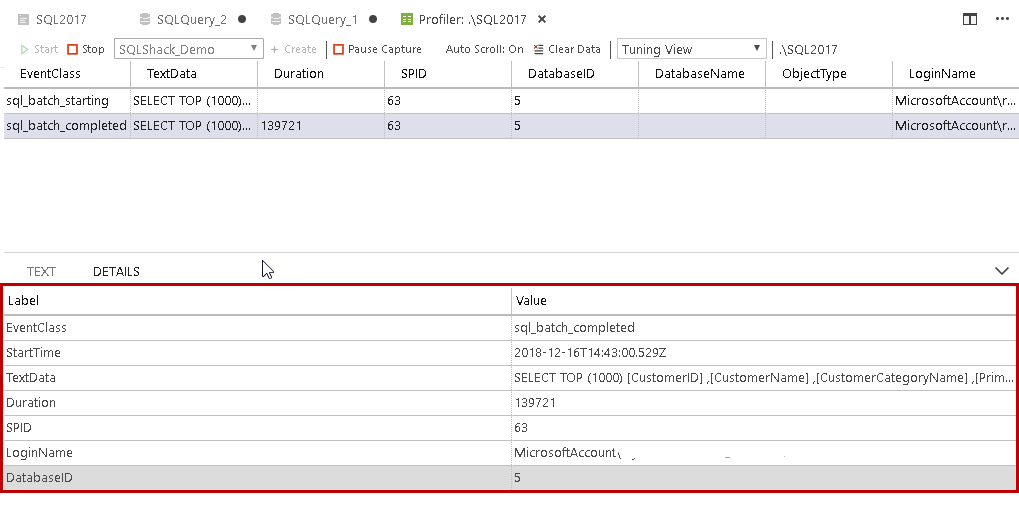
Tuning View: In tuning view, we get information about the duration of SQL batch and additional details such as object type, login name.
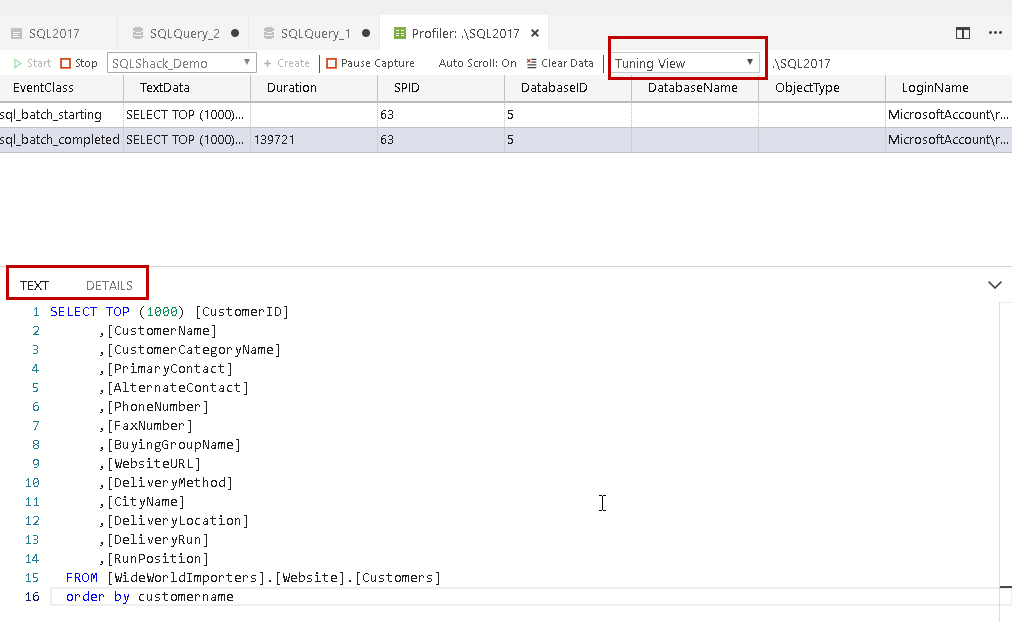
Click on the ‘Details’ to get additional information.
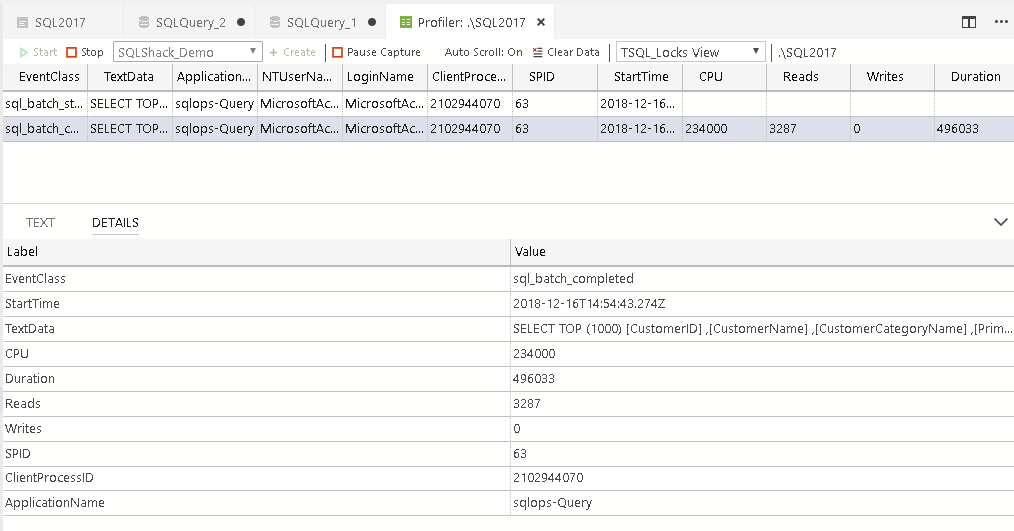
TSQL_Locks Views: In this view, we can see the reads, write, duration, application name, CPU for the running t-SQL.
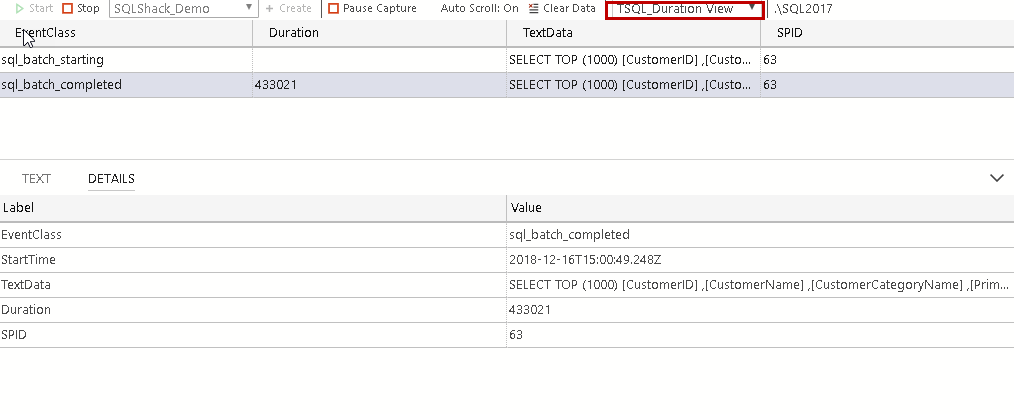
TSQL_Duration View: We can view the duration information for the t-SQL.
View the execution plan in Azure Data Studio
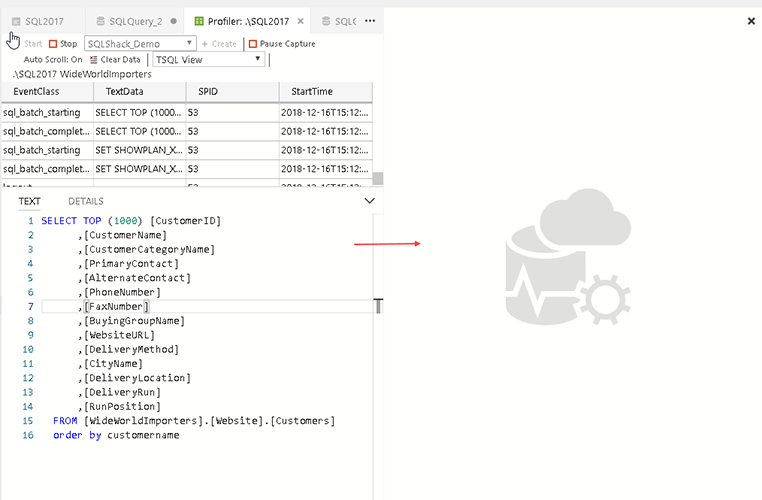
We can view the execution plan as well for the queries captured in the SQL Server Profiler. In the profiler window, click on the split editor. The arrow in the screenshot highlights this icon.
It opens up an editor window on the right side.
Now, suppose we want to see the execution plan of the query captured using the profiler event.
|
1 2 3 4 5 6 7 8 9 10 11 12 13 14 15 16 |
SELECT TOP (1000) [CustomerID] ,[CustomerName] ,[CustomerCategoryName] ,[PrimaryContact] ,[AlternateContact] ,[PhoneNumber] ,[FaxNumber] ,[BuyingGroupName] ,[WebsiteURL] ,[DeliveryMethod] ,[CityName] ,[DeliveryLocation] ,[DeliveryRun] ,[RunPosition] FROM [WideWorldImporters].[Website].[Customers] order by customername |
In the right split window, right click and then click on ‘New File’.
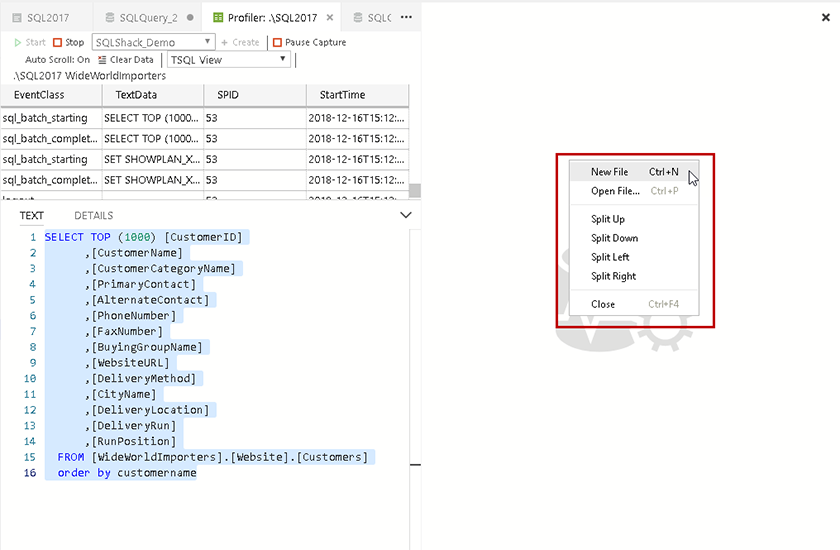
This opens us the query editor window in the split window.
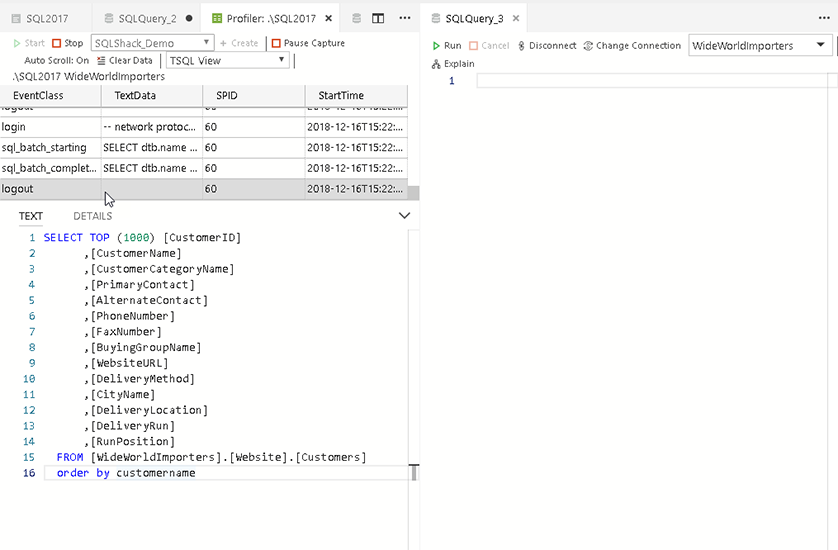
Now, Copy the query from the left window and paste into the right split window.

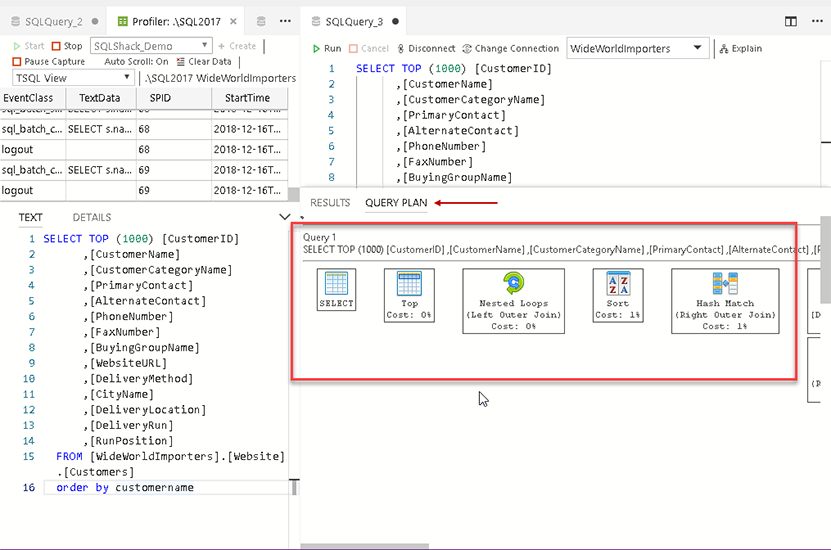
Click on the ‘Explain’ in the right window and you can see the execution plan from the ‘Query Plan’ option.
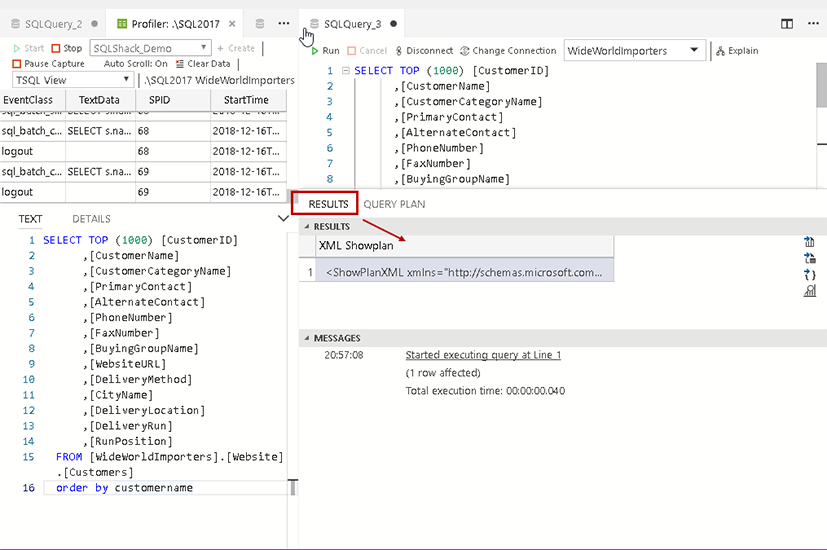
We can view the XML execution plan as well. Click on the ‘Results’ near to the ‘Query Plan’. You get the XML Showplan using this option.
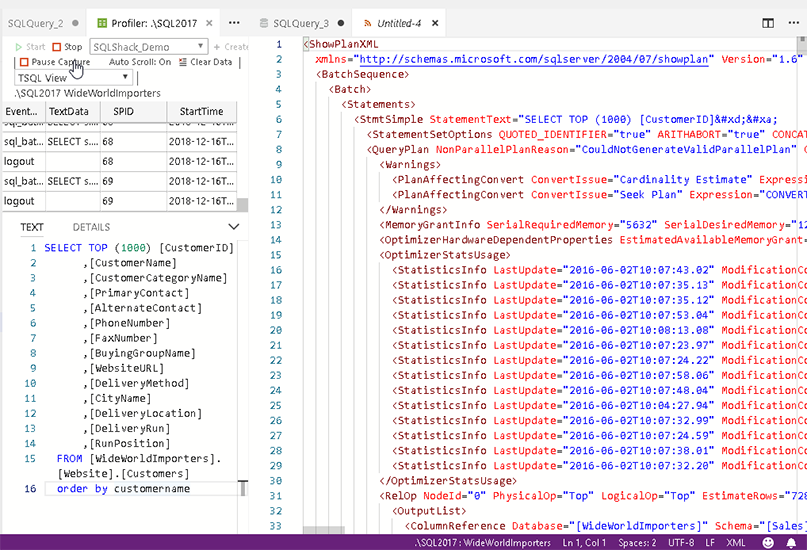
Now, Click on the XML Showplan and you can view the detailed XML execution plan in the new window as shown here.
As shown above, you can view the execution plan in both the graphical as well as in XML plan. Look out the operators in the execution plan and troubleshoot the issue.
Conclusion
SQL Server Profiler is a useful enhancement to Azure Data Studio. However, currently, in a preview state, we cannot define the custom template or events to capture the relevant data. We learned to use the SQL Server Profiler in this article. This extension might get further enhancements in an upcoming release.

I am the author of the book "DP-300 Administering Relational Database on Microsoft Azure". I published more than 650 technical articles on MSSQLTips, SQLShack, Quest, CodingSight, and SeveralNines.
I am the creator of one of the biggest free online collections of articles on a single topic, with his 50-part series on SQL Server Always On Availability Groups.
Based on my contribution to the SQL Server community, I have been recognized as the prestigious Best Author of the Year continuously in 2019, 2020, and 2021 (2nd Rank) at SQLShack and the MSSQLTIPS champions award in 2020.
Personal Blog: https://www.dbblogger.com
I am always interested in new challenges so if you need consulting help, reach me at rajendra.gupta16@gmail.com
View all posts by Rajendra Gupta
- Understanding PostgreSQL SUBSTRING function - September 21, 2024
- How to install PostgreSQL on Ubuntu - July 13, 2023
- How to use the CROSSTAB function in PostgreSQL - February 17, 2023