

Troubleshooting performance issues in a database is one of the main jobs of DBAs and by now most can trace the problem back to a query which is either running to slow or is causing a blocking issue on a key table. However, what is often not known is why this doesn’t cause problems in SSMS or why you don’t get the same query plan as what is inside the app. For example, in your extended event trace you see the query running longer from the application when compared to SSMS.
This can usually be found by the execution plan from management studio being different from the one that was gathered through the application trace. The first thing to verify is that you are running the same query with the same parameters. Depending on the query parameters it is very possible to get different plans, either by using sargable vs nonsargble or even having a different data type which causes an implicit conversion.
Secondly, you will want to make sure your “set options” are configured the same as your application. To do this, you can verify your set options in your execution plans by right clicking on your select operator and choosing properties. In the window on the left you will see a section labeled Set options, once expanded you will see all the options that were used during the execution of your query.
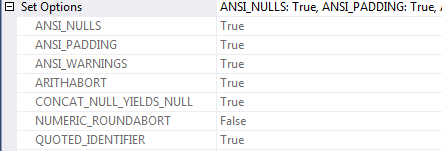
These set options affect and can change your execution plans if they are different.
This can also be found my cross applying sys.dm_exec_plan_attributes on the plan handle. Right away the integer returned can be a bit confusing as it only allows you to see if the plans have the same set options or differences. How this is calculated is by subtracting the largest value in the set option chart that you can and then working down until the number reaches zero. This will give you all the options that were enabled at runtime. These options and more details can be found on the MSDN page.
As a side note, since cursors have similar set options their information can be gathered in a similar format.
To get this information for your query run the below script, making sure to replace the SQL text in the where clause.

|
1 2 3 4 5 6 7 8 9 10 11 12 13 14 15 16 17 18 19 20 21 22 23 24 25 26 27 28 29 30 31 32 |
SELECT QueryPlan.query_plan as ExecutionPlan , SqlText.text as SQLText, PlanAttributes.value AS SetOptionsInt, IIF (CAST (PlanAttributes.value as INT) & 1 = 1 , N'Enabled' , N'Disabled') as [ANSI_PADDING], IIF (CAST (PlanAttributes.value as INT) & 2 = 2 , N'Enabled' , N'Disabled') as [Parallel_Plan], IIF (CAST (PlanAttributes.value as INT) & 4 = 4 , N'Enabled' , N'Disabled') as [FORCEPLAN], IIF (CAST (PlanAttributes.value as INT) & 8 = 8 , N'Enabled' , N'Disabled') as [CONCAT_NULL_YIELDS_NULL], IIF (CAST (PlanAttributes.value as INT) & 16 = 16 , N'Enabled' , N'Disabled') as [ANSI_WARNINGS], IIF (CAST (PlanAttributes.value as INT) & 32 = 32 , N'Enabled' , N'Disabled') as [ANSI_NULLS], IIF (CAST (PlanAttributes.value as INT) & 64 = 64 , N'Enabled' , N'Disabled') as [QUOTED_IDENTIFIER], IIF (CAST (PlanAttributes.value as INT) & 128 = 128 , N'Enabled' , N'Disabled') as [ANSI_NULL_DFLT_ON], IIF (CAST (PlanAttributes.value as INT) & 256 = 256 , N'Enabled' , N'Disabled') as [ANSI_NULL_DFLT_OFF], IIF (CAST (PlanAttributes.value as INT) & 512 = 512 , N'Enabled' , N'Disabled') as [NoBrowseTable], -- Indicates that the plan does not use a work table to implement a FOR BROWSE operation. IIF (CAST (PlanAttributes.value as INT) & 1024 = 1024 , N'Enabled' , N'Disabled') as [TriggerOneRow], --Indicates that the plan contains single row optimization for AFTER trigger delta tables. IIF (CAST (PlanAttributes.value as INT) & 2048 = 2048 , N'Enabled' , N'Disabled') as [ResyncQuery], --Indicates that the query was submitted by internal system stored procedures. IIF (CAST (PlanAttributes.value as INT) & 4096 = 4096 , N'Enabled' , N'Disabled') as [ARITH_ABORT], IIF (CAST (PlanAttributes.value as INT) & 8192 = 8192 , N'Enabled' , N'Disabled') as [NUMERIC_ROUNDABORT], IIF (CAST (PlanAttributes.value as INT) & 16384 = 16384 , N'Enabled' , N'Disabled') as [DATEFIRST], IIF (CAST (PlanAttributes.value as INT) & 32768 = 32768 , N'Enabled' , N'Disabled') as [DATEFORMAT], IIF (CAST (PlanAttributes.value as INT) & 65536 = 65536 , N'Enabled' , N'Disabled') as [LanguageID], IIF (CAST (PlanAttributes.value as INT) & 131072 = 131072 , N'Enabled' , N'Disabled') as [UPON], --Indicates that the database option PARAMETERIZATION was set to FORCED when the plan was compiled. IIF (CAST (PlanAttributes.value as INT) & 262144 = 262144 , N'Enabled' , N'Disabled') as [ROWCOUNT] FROM sys.dm_exec_query_stats AS QueryStats CROSS APPLY sys.dm_exec_query_plan(QueryStats.plan_handle) as QueryPlan CROSS APPLY sys.dm_exec_sql_text(QueryStats.plan_handle) as SqlText CROSS APPLY sys.dm_exec_plan_attributes (QueryStats.plan_handle) AS PlanAttributes where PlanAttributes.attribute = 'set_options' and SqlText.text like '%<Insert Query Text here>%'; |
Now, this may not seem like it should be an issue, but this is affecting many .net applications out there. In management studio, ARITHABORT is defaulted on, but for .NET Applications, it is set to OFF. This is a legacy issue from the early days when Microsoft violated some of the ANSI standards. This setting Terminates a query when an overflow or divide by zero occurs during query execution. Microsoft even publishes a warning about this on the ARITHABORT setting stating:
The default ARITHABORT setting for SQL Server Management Studio is ON. Client applications setting ARITHABORT to OFF can receive different query plans making it difficult to troubleshoot poorly performing queries. That is, the same query can execute fast in management studio but slow in the application. When troubleshooting queries with Management Studio always match the client ARITHABORT setting.
More information about the ARITHABORT option can be read here. While Microsoft does state that this setting can be changed in the connection string for the application I was not able to find the syntax for adding the options. If you do have or know what the syntax is, please share this information below. However, the best option currently when troubleshooting SQL queries is to set your ARITHABORT OFF when troubleshooting queries to make sure you receive the same query plan.
Another good way to get stuck spinning your wheels is to run a section of a stored procedure that requires a variable outside of a stored procedure. Most of us know that a troublesome stored procedure means that there is usually one bad section in the giant blob of code. This means that we end up removing and running sections one at a time. However, this can cause problems, when remove that section of code you will need to define that parameter. Most of us will default to either replacing the value directly in the SQL statement or declaring variables locally. This, of course, it allows SQL Server to make some assumptions about those values, allowing more accurate estimates and giving the query a better plan than what was inside the app.
The easiest work around to this is to either use SP_Executesql or simply create a dummy stored procedure with that section of code. These methods shown below, allow SQL Server to execute the query in a parameterized fashion and imitates the behavior of the stored procedure more accurately.
|
1 2 3 4 5 6 7 8 |
EXEC sp_executesql N'Select firstname, lastname from person where id = @param1', N'@param1 bigint', 26598 GO CREATE PROCEDURE #querytuning @param1 int AS BEGIN Select firstname, lastname from person where id = @param1 END GO EXEC #querytuning @param1 = 26598 |
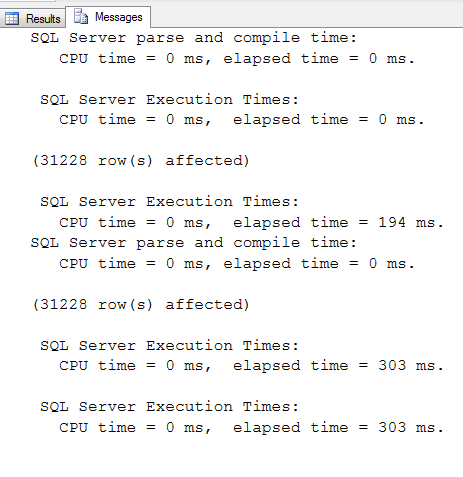
To demo this, using the adventureworks2017 database, I wrote the below queries to compare local variables with a dummy stored procedure. During this test, the local variable query ran roughly 50% faster consistently.
|
1 2 3 4 5 6 7 8 9 10 11 12 13 14 15 16 17 18 |
CREATE PROCEDURE #querytuningSalesPerson @param1 int AS BEGIN Select [SalesOrderNumber], [OrderDate], [Status] from [Sales].[SalesOrderHeader] where [TotalDue] >= @param1 END declare @param1 int set @param1 = 5 Select [SalesOrderNumber], [OrderDate], [Status] from [Sales].[SalesOrderHeader] where [TotalDue] >= @param1 EXEC #querytuningSalesPerson @param1 = 5 |
Finally, as hinted at briefly in the start of this article there are just going to be sometimes the query you are trying to tune is going to perform slow due to blocking issues in the DB that are not occurring during the time you are trying to tune this query. This is always slightly frustrating as it is one of the “intermittent issues” managers often complain about when running their quarterly reports or gathering large amounts of data. The best thing to do in this scenario is to keep good data on what queries tend to be the slowest and what queries you are receiving alerts on. It is also important to gather metrics for benchmarking and gathering baselines of how your server is performing over time. Microsoft talks about what metrics should be included when baselining your SQL Server and suggests some of their tools to gather metrics. However, at minimum you should be monitoring your processes on your SQL Server to gauge how often blocking is occurring. Many DBAs do this on the cheap by Logging SP_WhoisActive to a table, it is even documented how to configure this by viewing the documentation around the procedure online.
While we have only gone through a few of the steps that can cause different query plans and performance issues between your application and your management studio, I hope these topics help you with your performance tuning ventures as much as they did me.

My curious nature leads to me learn about different methodologies for accomplishing tasks more efficiently without compromising on the quality. This does tend to lead one down the rabbit hole, but it often ends in valuable experience that I enjoy sharing with anyone willing to take the time. You can find me on LinkedIn
- Preparing for SQL Server Database Corruption; initial reaction and analysis - February 6, 2019
- Considerations and concerns when setting up Database mail for SQL Server - August 31, 2018
- SQL Server Setup – Instant File Initialization (IFI) - August 31, 2018