

In this article, we are going to learn in detail about Azure Time Series Insights. Microsoft Azure is one of the leading cloud providers these days. With a lot of companies adopting or migrating to the cloud these days, it has become a usual trend to convert existing technologies into cloud-based services and consume them. This not only helps the companies to reduce their cost but also in turn allows them to focus on more business-related problems rather than concentrating on infrastructure costs.
Azure Time Series Insights is one of the cloud services that users can use to integrate with their data that is constantly changing with time such as data from various sensors or machines, data from satellites, airlines etc. Any data that can be generated on a high scale and needs to be analysed, can be used through Azure Time Series Insights. In this article, we will focus on a high-level introduction of this service along with some use cases in detail.
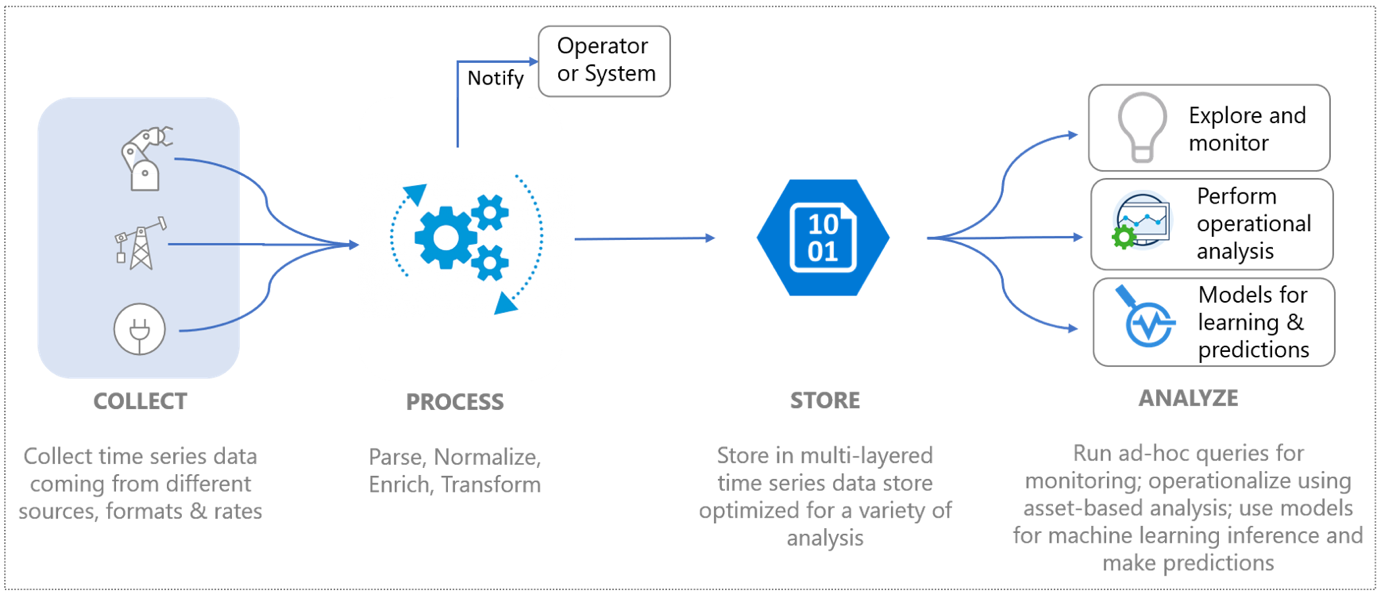
Figure 1 – IoT Data Flow (Source)
Overview of Azure Time Series Insights (TSI)
Azure Time Series Insights is a cloud-based service offered by Azure that can be used to ingest, model, query and visualize fast-moving time-series data generated by IoT devices.
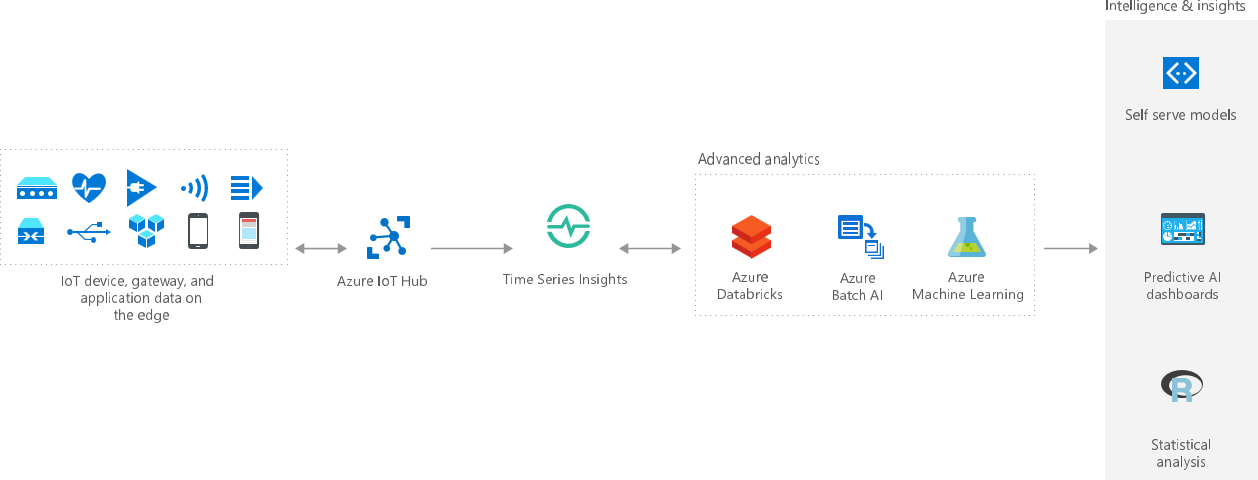
Figure 2 – Advanced Analytics using Azure Time Series Insights (Source)
As in the figure above, you can see a high-level architecture of how Azure TSI can be implemented in a real-life scenario. Real-time data in the form of a time-series can be generated by various devices like mobile devices, sensors, satellites, medical devices etc. Data from these devices can be fetched to the Azure environment using Azure IoT Hub. Azure IoT hub acts as a data integration pipeline to connect to the source devices and then fetch data and deliver it to the TSI platform. Once the data is in the TSI, it can then be used for visualization purposes, and can be queried and aggregated accordingly. Additionally, customers can also leverage existing analytics and machine learning capabilities on top of the data available in TSI. Data from TSI can be further processed using Azure Databricks and machine learning models can be applied based on pre-trained models that will offer predictions in real-time. This is how an overall architecture of Azure Time Series Insights can be enabled.
Using Azure TSI, users can easily visualize aggregated data using line charts or heat maps.
Components of Azure Time Series Insights
Azure TSI provides the following four components using which users can consume data from varied data sources as follows.
- Integration – TSI provides an easy integration from data generated using IoT devices by allowing connection between the cloud data gateways such as Azure IoT Hub and Azure Event Hubs. Data from these sources can be easily consumed in JSON structures, cleaned and then stored in a columnar store
- Storage – Azure TSI also takes care of the data that is to be retained in the system for querying and visualizing the data. By default, data is stored on SSDs for fast retrieval and has a data retention policy of 400 days. This supports querying historic data for up to a period of 400 days
- Data Visualization – Once the data is fetched from the data sources and stored in the columnar stores, it can be visualized in the form of line charts or heat maps. The visuals are provided out of the box by Azure TSI and can be leveraged for easy visual analysis
- Query Service – Although, visualizing the data will answer many questions, however, TSI also provides a query service using which you can integrate TSI into your custom applications
Usually, a time series data is indexed by timestamps. Therefore, you can build your applications by using TSI as a backend service for integrating and storing the data and using the client SDK for Azure TSI for building the frontend and display visuals like line charts and heat maps.
Understanding Storage Tiers and Data Availability in Azure TSI
As we have already discussed that data in Azure TSI is indexed by timestamps and stored in the Azure Storage Account. For Azure Time Series Insights, the data is provisioned to be stored in two types of storage –warm storage and cold storage. This is a very important concept as the data for only 30 days is stored in the warm store and the data for more than 30 days is stored in the cold store. This makes Azure TSI very fast while querying data within the last 30 days as it is being fetched from the warm store. However, if you need to query data for a longer duration, then it is read from the cold store.
Using Azure Time Series Insights in the Azure portal
Now that we have some idea about what the Azure TSI is all about, let us learn how to use it on the Azure portal. Azure TSI is just like any other Azure managed service and hence can be launched directly from the Azure portal. Navigate to https://insights.timeseries.azure.com/ and click on Check out a sample. Azure TSI usually works with data that has already been generated by some IoT devices in your environment. For the purpose of this article, we do not have any IoT devices linked to it, therefore, we would go by the sample that Azure provides for us by default.
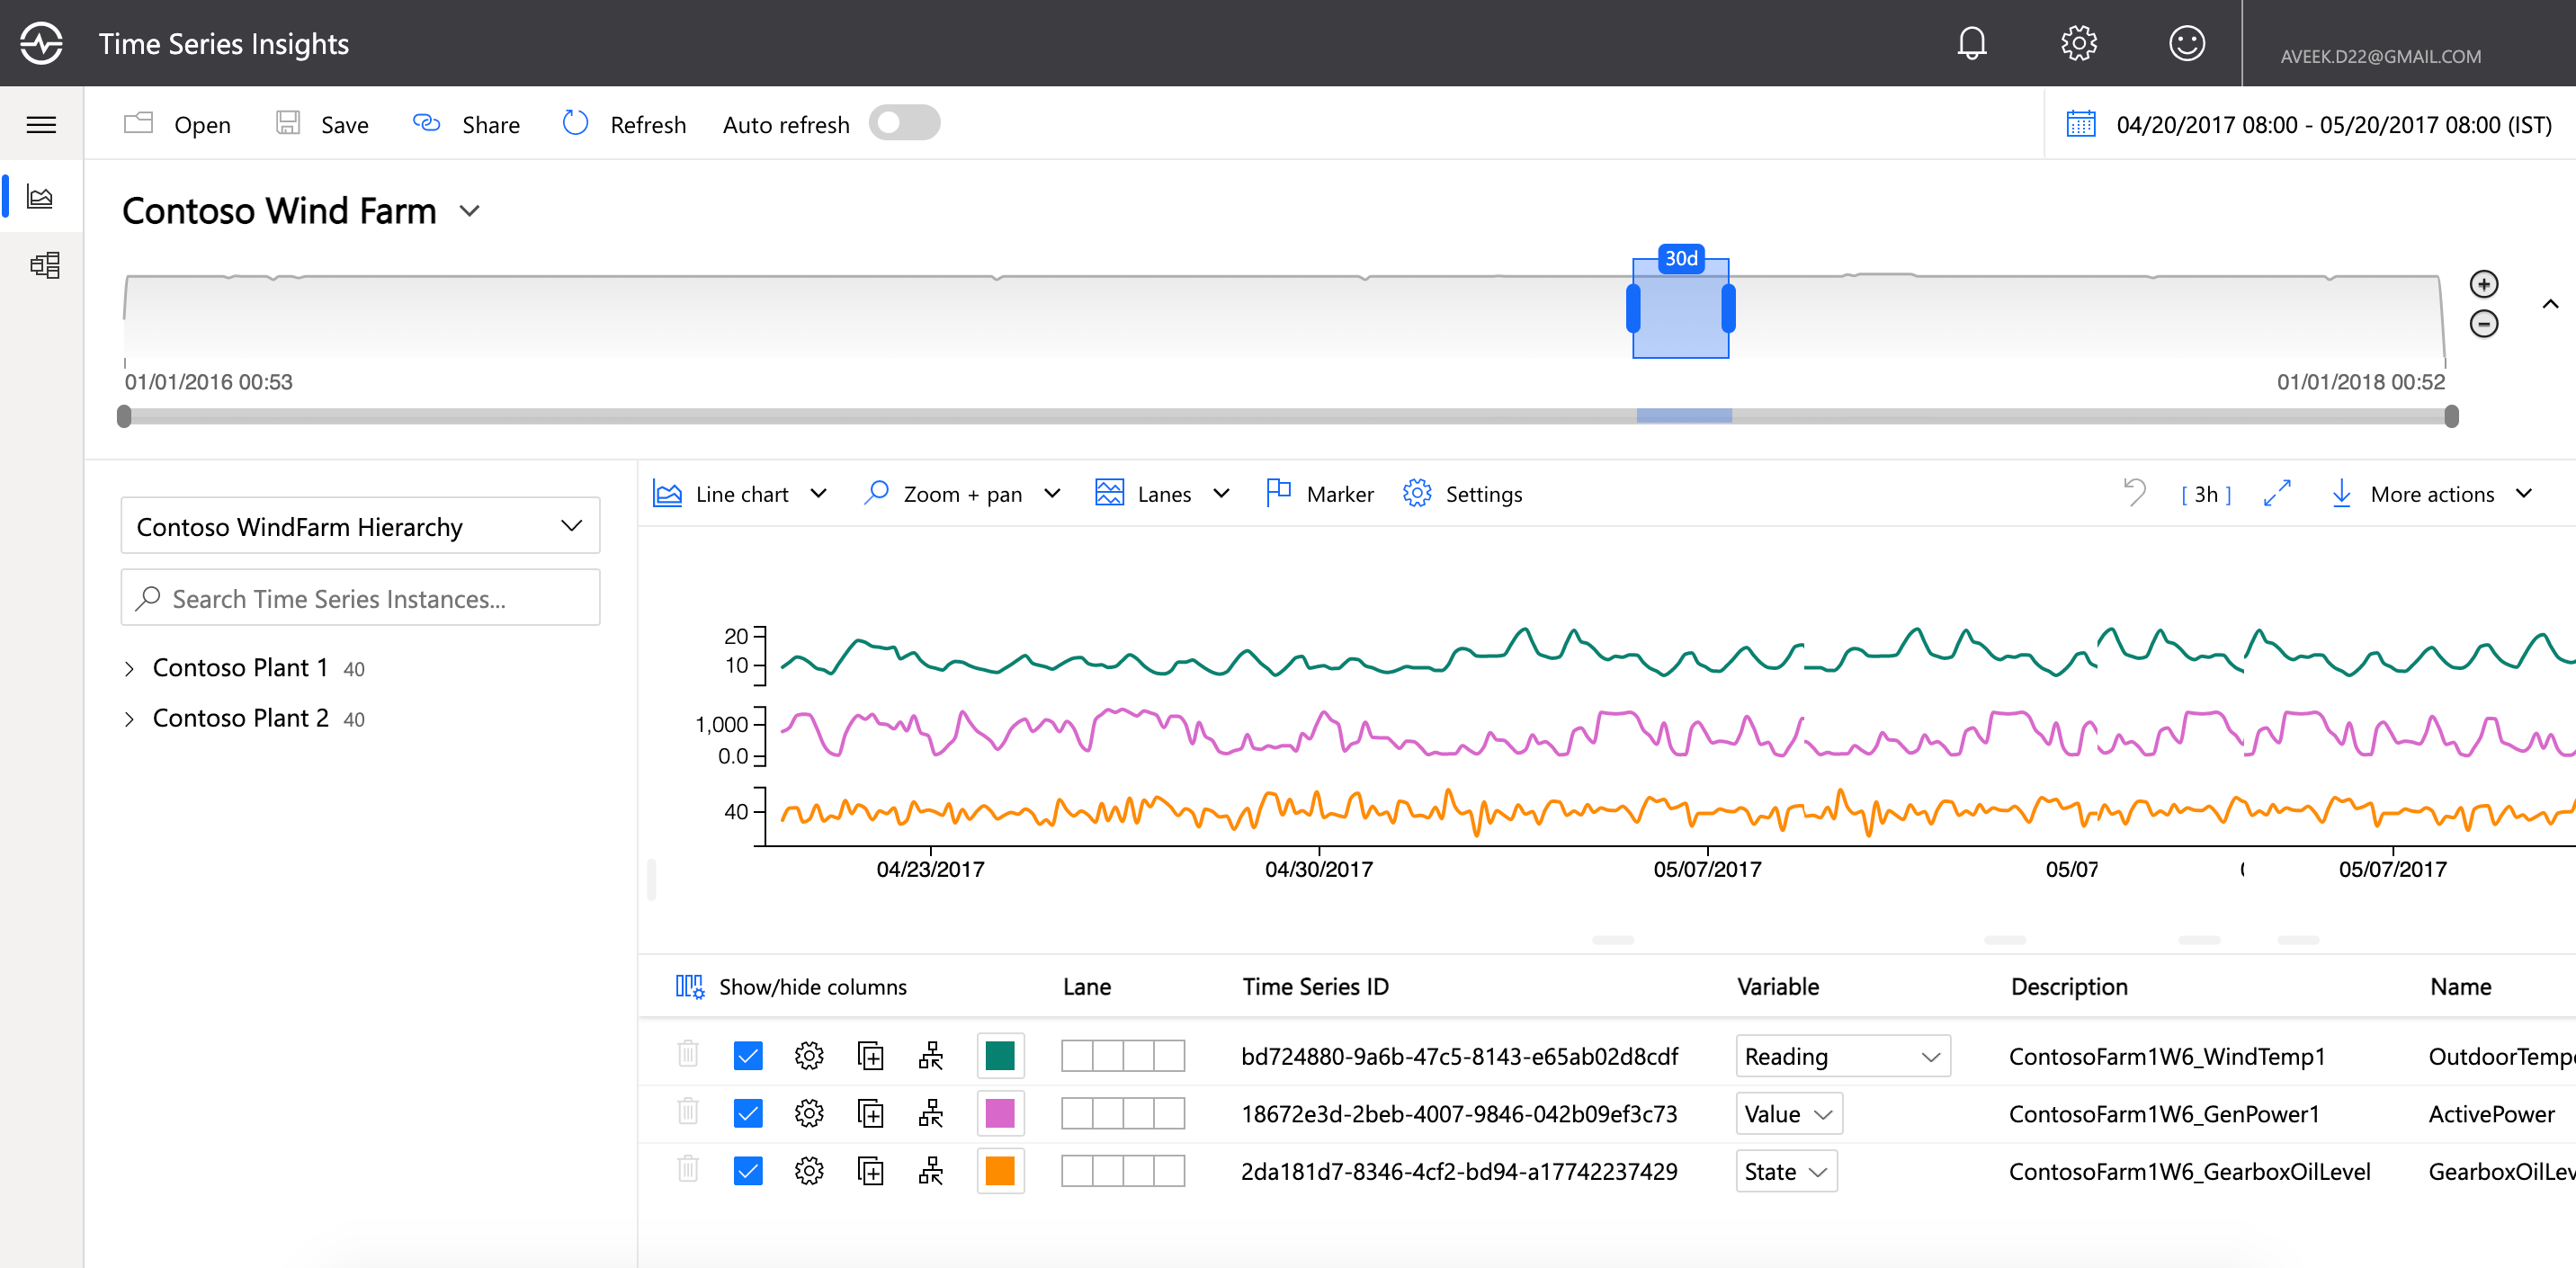
Figure 3 – Azure TSI portal with Demo IoT Environment
As soon as you navigate to the portal, the demo environment for the Contoso app opens up with some beautiful visualizations. The Contoso Wind Farm is a fictitious wind power plant that has two windmills W6 and W7 running on Plant 1 and Plant 2. Each of the plants has several Iot devices that collect information about the following.
- Gearbox System
- Generator System
- Pitch System
- Safety System
- Weather System
- Yaw System
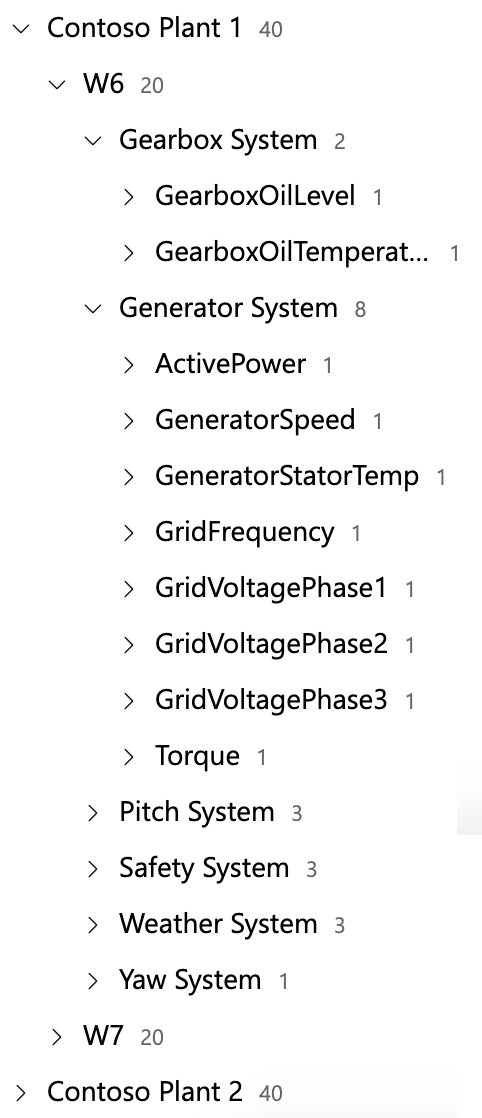
Figure 4 – Contoso Plant Hierarchy in Azure TSI portal
The IoT sensors or the devices listed in the plants will appear in a hierarchical way such that it becomes easier for the user to navigate and browse the readings from the devices.
There is a possibility to alter the date range of the visible window. You can do it just by dragging the time slicer handle left or right. Since the data here is indexed by timestamp, it is extremely fast and the visualizations reflect the changes with very low latency.
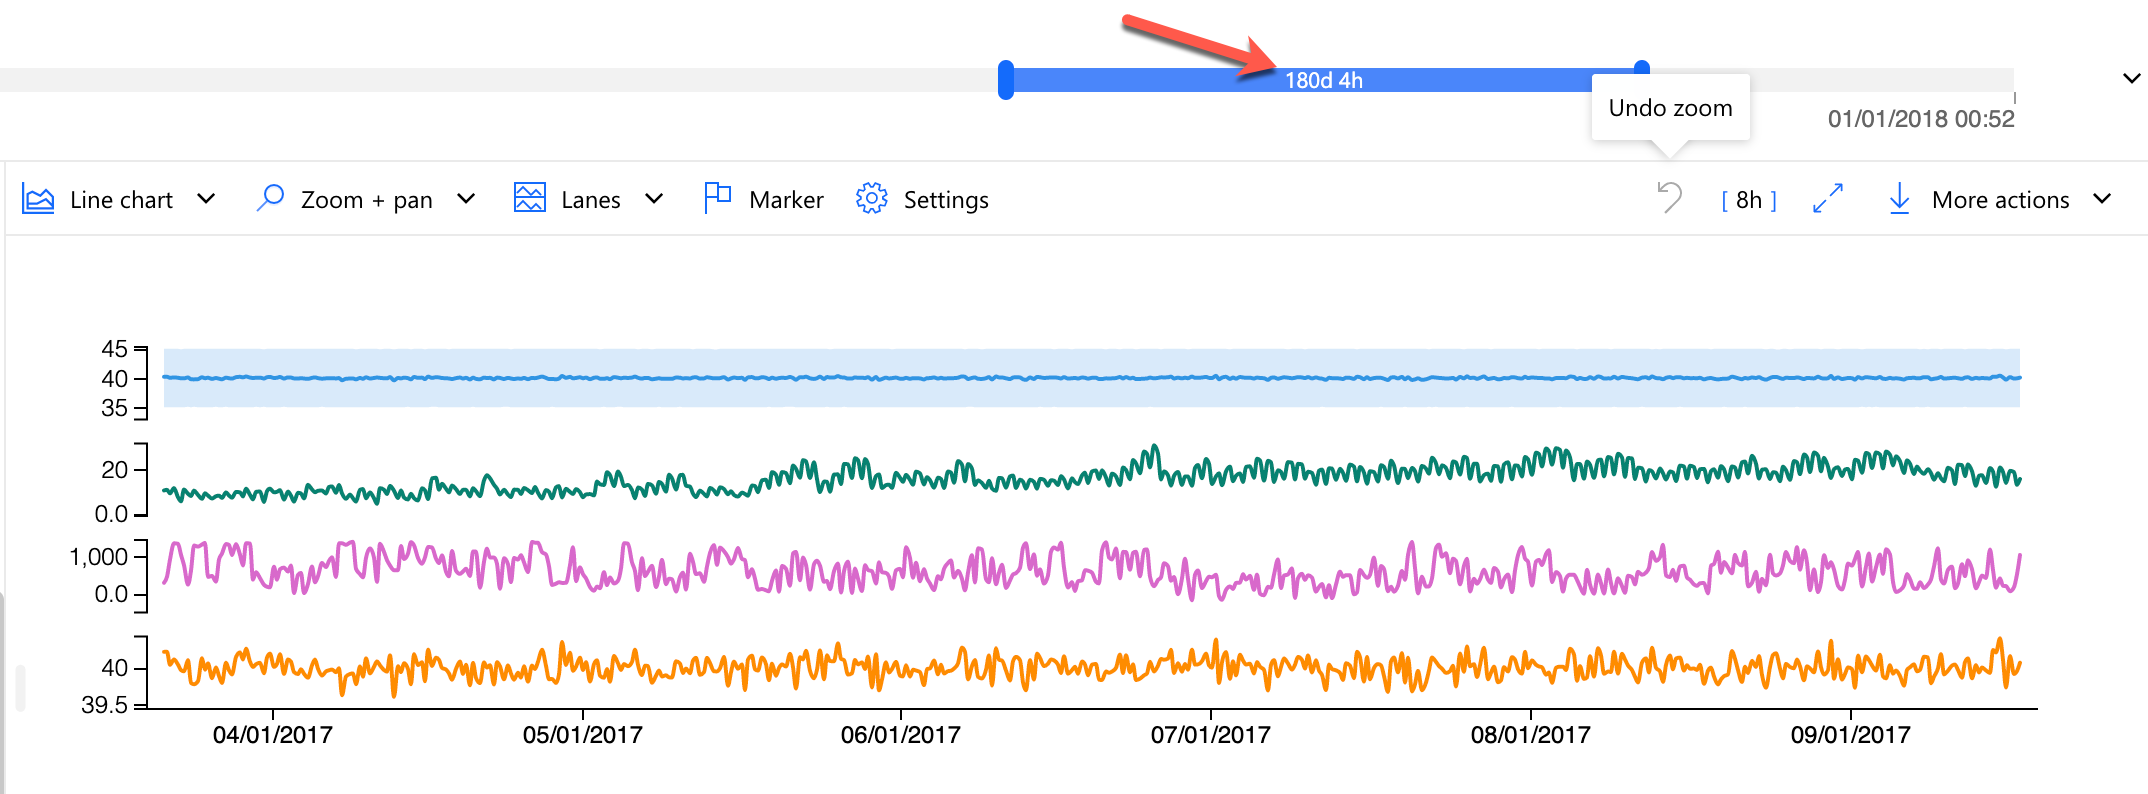
Figure 5 – Changed the time slicer from 30 days to 180 days
You can navigate through each of the devices that are being listed in the application. This provides visibility over the devices and their performance can be monitored. For example, in case of some defects within the plants, it can be investigated, and the root cause of the problems may be identified. A very good example of root cause analysis using Azure TSI can be found in the official documentation.
Conclusion
In this article, we have understood in detail the concepts of using Azure Time Series data for our constantly generated data that is based on time. This data can be generated across a wide variety of systems such as websites, users, or even IoT devices like sensors or medical equipment etc. We can use the data from these devices and implement various use cases as and when required. With this service, you can easily aggregate your fast-moving data from various data sources and get them visualized on a web application or a dashboard. Alternatively, you also have the capabilities to run queries against this data and obtain more simplified results.
To learn more, please follow the official documentation from Microsoft. You can stay updated with the latest news and announcements from the Azure TSI team by following their Twitter handle.

He is a prolific author, with over 100 articles published on various technical blogs, including his own blog, and a frequent contributor to different technical forums.
In his leisure time, he enjoys amateur photography mostly street imagery and still life. Some glimpses of his work can be found on Instagram. You can also find him on LinkedIn
View all posts by Aveek Das
- Getting started with PostgreSQL on Docker - August 12, 2022
- Getting started with Spatial Data in PostgreSQL - January 13, 2022
- An overview of Power BI Incremental Refresh - December 6, 2021