
Introduction
Have you ever written up a complex query using Common Table Expressions (CTEs) only to be disappointed by the performance? Have you been blaming the CTE? This article looks at that problem to show that it is a little deeper than a particular syntax choice and offers some tips on how to improve performance.
CTEs Revisited
Common Table Expressions first appeared in SQL Server 2005. Combined with the WITH statement, they provide a way to reorganize a complicated hierarchy of sub queries into an easy-to-read linear form. CTEs also allow for recursive behavior, though that is beyond the scope of this article. Quoting from Books Online, a CTE:
Specifies a temporary named result set, known as a common table expression (CTE). This is derived from a simple query and defined within the execution scope of a single SELECT, INSERT, UPDATE, or DELETE statement. This clause can also be used in a CREATE VIEW statement as part of its defining SELECT statement. A common table expression can include references to itself. This is referred to as a recursive common table expression.
Generally, you set up a query using CTEs like this:
|
1 2 3 4 5 6 7 8 9 10 11 12 13 14 |
WITH cte1 AS ( SELECT … ), Cte2 AS ( SELECT … ), … SELECT … FROM cte1 JOIN cte2 ON cte1.<join column> = cte2.<join column> |
You can have any number of CTEs and the final statement (which can be any valid DML) can use all, some or none of them. Assuming there are just two, as above, this can be rewritten using subqueries:
|
1 2 3 4 5 6 7 8 9 10 |
SELECT … FROM ( SELECT … ) cte1 JOIN ( SELECT … ) cte2 ON cte1.<join column> = cte2.<join column> |
There is no difference between the first query and the second as far as how it is parsed, compiled and executed. The execution plans will be identical. The difference is in readability. When subqueries are complex, it can be easier to pull them out and put them into CTEs then combine them in a WITH statement.
Performance?
Maybe you have written or debugged a CTE that seems to run slowly. Or, perhaps you’ve seen postings in some SQL Server forum complaining that some CTE runs slowly. What the complainant is really suggesting is that somehow when SQL Server compiles a query built from CTEs it does it differently than the same query using sub-queries and somehow does a worse job of it. That is simply not the case. In fact, if the forum poster had reformatted the query into (possibly nested) subqueries and not use the WITH…CTE structure, the same performance characteristics would no doubt have been observed.
So, why does it run so slowly! Good question. To try to understand why, let’s look at a simple example:
|
1 2 3 4 5 6 7 8 9 10 11 12 13 14 15 16 17 |
DECLARE @t TABLE (id INT, name SYSNAME); INSERT INTO @t (id, name) SELECT TOP(1000000) a.object_id, a.name FROM sys.all_columns a, sys.all_columns b; WITH cte AS ( SELECT id, name FROM @t ) SELECT c.id, c.name FROM cte c JOIN sys.all_columns s ON c.name = s.name |
What does this do? After the table variable declaration, it populates the table with the first one million rows from the Cartesian product of the sys.all_columns view. Depending on how big the database is that you run this against there may be thousands, tens of thousands and maybe many more rows in that table. A million rows in the result is enough for our purposes. After populating the table variable, the script continues in a WITH statement using a CTE that just pulls rows from the table variable. Doesn’t look that bad, right? Before you run it on some handy production system, though, read on.
A little math will help you see what’s at stake. If I just run:
|
1 2 3 |
SELECT COUNT(*)FROM sys.all_columns; |
I get a result of 7364 on my system – and that’s just LocalDB! Since that is being joined with the Cartesian product of the same view, that could result in 7.364 billion rows. I let it run on my own (non-production!) system. I had to stop it before it could complete. I admit to being a little impatient!
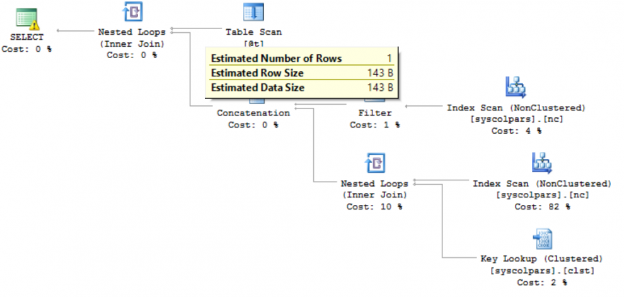
Curious to see what’s going on behind the curtain, I displayed the execution plan. It looks like this:
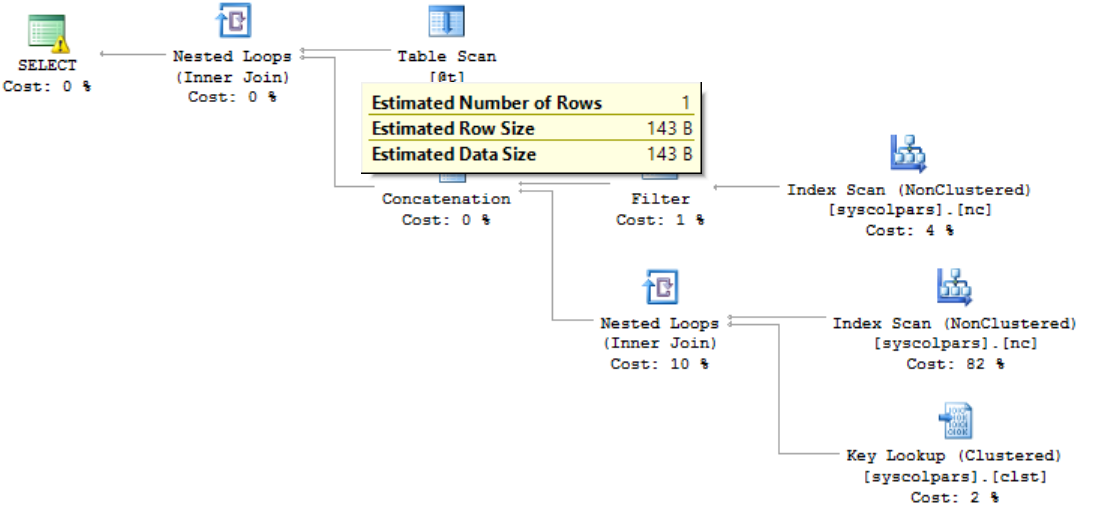
Note that a Nested Loops operator was selected and that the estimated number of rows coming from my table variable is 1! Even though I just loaded it with 1 million rows! How can this be? The sad truth is that SQL Server does not maintain statistics for table variables, so at the time the query is compiled, it does not know how may rows are really there. If I had just one row, a nested loop would be fine! Here’s how that’s defined in BOL:
The nested loops join, also called nested iteration, uses one join input as the outer input table (shown as the top input in the graphical execution plan) and one as the inner (bottom) input table. The outer loop consumes the outer input table row by row. The inner loop, executed for each outer row, searches for matching rows in the inner input table.
So, for every one of the million rows in my table variable, SQL will do a scan of the object catalog view. Not! Good!
My second attempt replaces the table variable with a temp table. The script is identical except that it starts off with:
|
1 2 3 |
CREATE TABLE #t (id INT, name SYSNAME); |
And replaces @t with #t in the rest of the script. This time the execution plan looks like this:
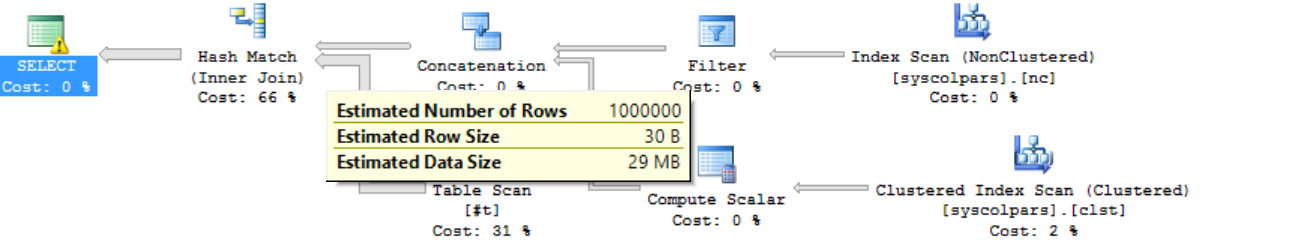
This looks better! For one thing, the estimated number of rows coming from the temporary table is correct. For another, the complier chose a hash match – a much better choice for this join than the table scans we had before.
I let this query run to completion. It ran for just over 3 minutes on my (admittedly old and slow!) laptop and produced 16.7 billion rows before hitting an out of memory error (that’s a lot of rows!) Reducing the number of rows in the temporary table to 100,000 allowed it to finish in a comfortable nine seconds.
All of this means that there is nothing wrong with the CTE construct; something else must be going on. That something else is statistics. The SQL Server compiler uses statistics (e.g. row counts) to inform the optimizer. However, statistics are not created or updated for table variables. This is the “Aha!” moment! Changing the script to use a temporary table instead of a table variable meant that statistics were available to choose a better execution plan.
Digging Deeper
That something else is in the little phrase near at the beginning of the quotation from BOL:
Specifies a temporary named result set
Why is that significant? Can you think of another type of temporary named result set? How about a table variable! We already found out that table variables, which have no statistics, can wreak havoc with execution plans because of incorrect row counts. However, a CTE holds something similar in a temporary result set. When compiling a complex CTE, it may not have enough information available to derive an optimal plan. When I think that is happening, here’s what I do:
-
Test each CTE on its own from top to bottom to see if/where execution times or row counts explode. This is easy to do in SSMS by adding a
123SELECT * FROM <CTE name>
Just before the main query that pulls the CTEs together and highlighting and running the script down to that point.
- Verify that the culprit is correctly written with proper predicates.
- Ensure that the predicates are indexed, if possible (more on that later).
- Resume testing from that CTE onward until the end.
There is at least one problem that cannot be fixed with this process. It is not always possible to ensure that all predicates are indexed, especially for derived results. In that case, there is another option to break the bottleneck:
This will mean restructuring your query. Basically, you will take the top half of the query and write the results to a temporary table, then index the table, then resume the query, starting with the temporary table. For example, suppose I have:
|
1 2 3 4 5 6 7 8 9 10 11 12 13 14 15 16 17 |
WITH CTE1 AS ( SELECT … ), CTE2 AS ( SELECT … ), … CTEn AS ( SELECT … ) /* Main Query */ SELECT … FROM CTE1 JOIN CTE2 … |
Assume further that the problem is at CTE10. This will become:
|
1 2 3 4 5 6 7 8 9 10 11 12 13 14 15 16 |
WITH CTE1 AS ( SELECT … ), CTE2 AS ( SELECT … ), … CTE9 AS ( SELECT … ) SELECT … INTO #CTE9 FROM CTE1 JOIN CTE2 … |
Now that we have the results so far in a temporary table, index it:
|
1 2 3 |
CREATE INDEX IX_#CTE9 ON #CTE9(col1, col2, …) |
Now, let’s finish the query:
|
1 2 3 4 5 6 7 8 9 10 11 12 13 14 15 16 17 18 |
WITH CTE9 AS ( SELECT … FROM #CTE9 ), CTE10 AS ( SELECT … ), … CTEn AS ( SELECT … ) /* Main Query */ SELECT … FROM CTE9, JOIN CTE10, … |
Note that you may still have to continue the process outlined above until you reach your performance goals.
And Another Thing
Whatever you do, get used to reading Execution plans. There is a wealth of information there and hundreds if not thousands of great resources on understanding them. As a final sanity check, though, right-click on the left-most entry in the graphical execution plan. That will likely be a SELECT, UPDATE, INSERT or DELETE. Now in the context menu, choose Properties. Make sure that you see this, about half-way down:
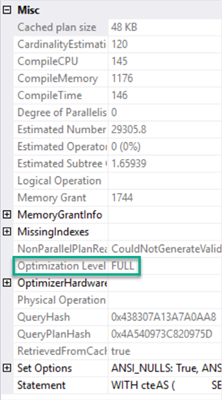
If you don’t see Optimization Level FULL, it is an indicator that your query is too complex. Consider breaking it up some more, using the temporary table technique outlined above.
Conclusion
Common Table Expressions are just another way to write subqueries. They are not magic, nor does SQL Server treat them any differently from normal, nested subqueries, except for their recursive cousins. CTEs can make code easier to read and maintain, since, when used properly, you can separate concerns by CTE. (Notice how I snuck in an Object-Oriented programming principle?)
When they perform badly, though, don’t blame the CTE. Dig deeper to understand what is going on beneath the covers. The execution plan is the perfect way to do that.

Gerald specializes in solving SQL Server query performance problems especially as they relate to Business Intelligence solutions. He is also a co-author of the eBook "Getting Started With Python" and an avid Python developer, Teacher, and Pluralsight author.
You can find him on LinkedIn, on Twitter at twitter.com/GeraldBritton or @GeraldBritton, and on Pluralsight
View all posts by Gerald Britton
- Snapshot Isolation in SQL Server - August 5, 2019
- Shrinking your database using DBCC SHRINKFILE - August 16, 2018
- Partial stored procedures in SQL Server - June 8, 2018