
Introduction
If you are reading this I am sure you already know what a deadlock is, but just in case you are new to SQL, a deadlock is when 2 queries are blocking each other in such a way that neither of the two can be completed.
For example, 2 queries are holding shared locks on a table, but both queries need to escalate their locks to exclusive locks to perform an update. Since neither query can proceed, intervention is required. SQL Server routinely performs a check for deadlocks and will choose to kill one of the processes to allow the other to proceed. This killed process is known as the deadlock victim.
There are multiple ways to go about troubleshooting deadlocks which include:
Trace flags 1222, 1204
Profiler (trace events)
Extended events
In this particular article I will only focus on the Deadlock Graph or the file in .rdl format (graphical representation) , what you can know by looking at the graph image, this is handy if you just want to get the basic information quickly. Generally, however looking at the XML version of the file, reveals more information which can make troubleshooting deadlocks a lot easier. I will cover that in my next article: Understanding the deadlock graph part 2: The XML description.
Creating a deadlock
For the purpose of this demonstration I will create a very simple deadlock in the AdvetureWorks2012 database to allow us to see what we can learn from looking at the deadlock graph.
I will execute 2 queries simultaneously:
Query 1
|
1 2 3 4 5 6 7 8 9 |
BEGIN TRAN UPDATE Person.Address set StateProvinceID = 78 where AddressID = 1 WAITFOR DELAY '00:00:05' UPDATE Person.Person set FirstName = 'John' where BusinessEntityID = 1 COMMIT TRAN |
Query 2
|
1 2 3 4 5 6 7 8 9 |
BEGIN TRAN UPDATE Person.Person SET FirstName = 'John' WHERE BusinessEntityID = 1 WAITFOR DELAY '00:00:05' UPDATE Person.Address SET StateProvinceID = 78 WHERE AddressID = 1 COMMIT TRAN |
These queries are fairly simple, as you can see query 1 tries to update Person.Address and then waits for 5 seconds, and then tries to update Person.Person. Query 2 attempts to do the same but in reverse order.
Since neither query can proceed, this results in a deadlock and the deadlock message will be displayed for one of them, which means that that query was terminated and rolled back (deadlock victim) and the other query will complete successfully.
Query 1 Results
(1 row(s) affected)
Msg 1205, Level 13, State 51, Line 5
Transaction (Process ID 61) was deadlocked on lock resources with another process and has been chosen as the deadlock victim. Rerun the transaction.
Query 2 Results
(1 row(s) affected)
(1 row(s) affected)
In this instance query 1 was chosen as the deadlock victim. Various factors are taken into account when a victim is selected, as I mentioned in my previous article on Deadlocks.
How to obtain the deadlock graph
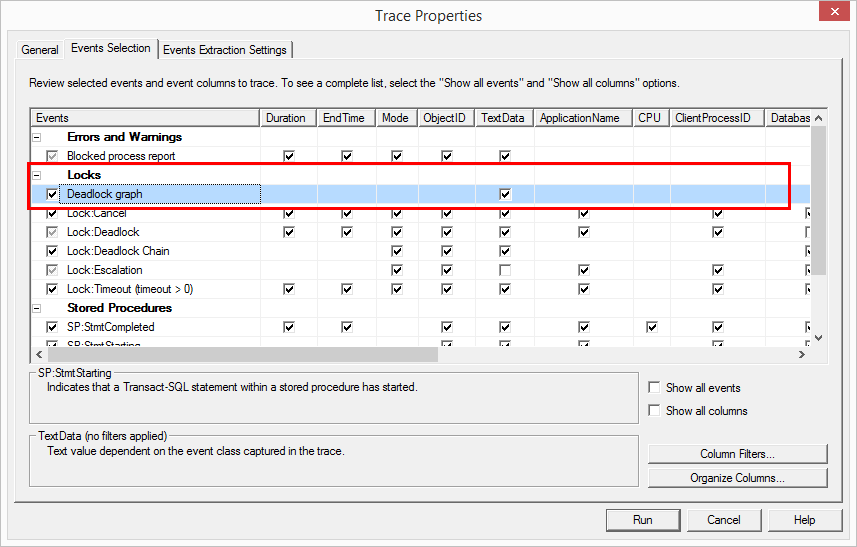
The easiest way to obtain the deadlock graph is by using Profiler. You can use the standard TSQL_Locks template. The event that we are interested in is the Deadlock Graph.
On the Events Extraction Settings tab you can choose to have the deadlock events saved to an XML File.
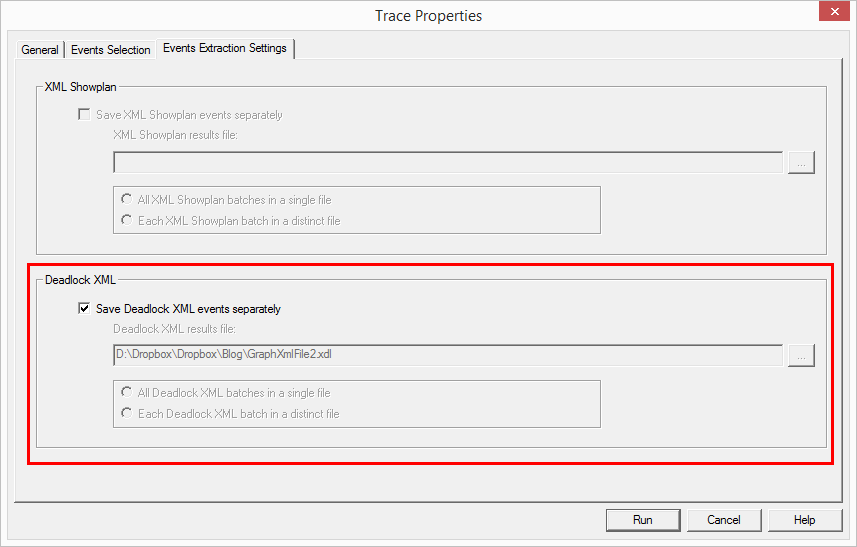
This will save the event data to an .xdl file, which you can then open in SSMS. On occasion you might encounter the following error:
Failed to initialize deadlock control
When this happens the easiest way around it, is to go to the deadlock graph line in profiler, right click and select Extract Event Data…
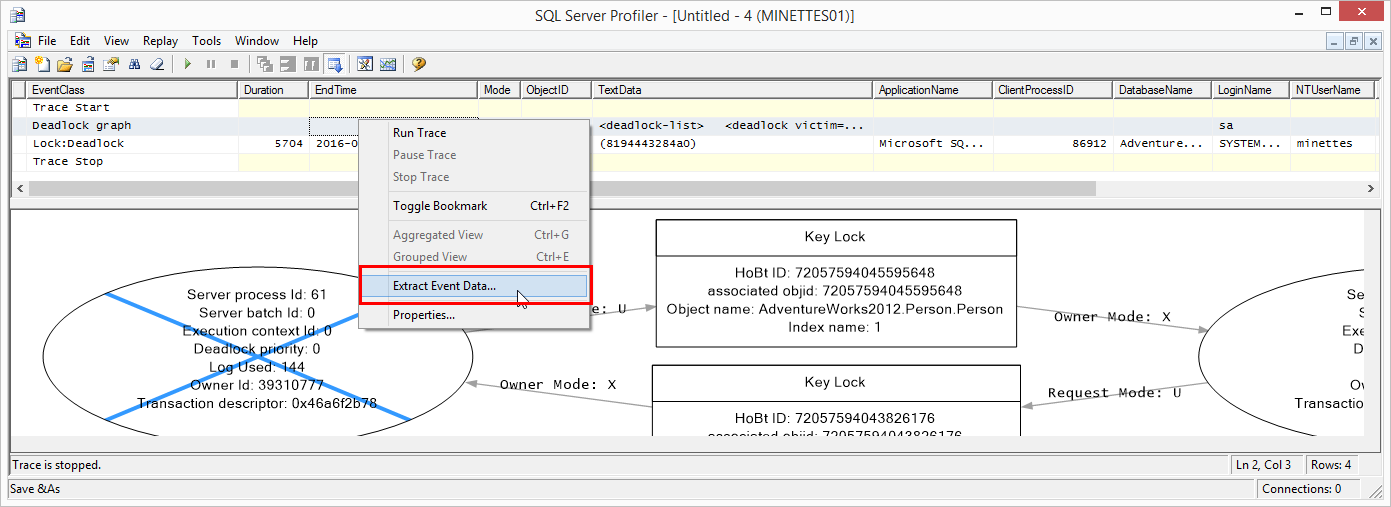
Save the file and then open it in SSMS.
Looking at the deadlock Graph
The deadlock graph consists out of 3 concepts as shown below


Resource nodes
The resource nodes display the objects which are involved in the deadlock. Such as tables, indexes or rows.

Process nodes
The process nodes display information about the processes themselves. This is the process which is performing the data modification.

Edges
The edges indicates the relationships between the resource and process nodes. There are 2 types of edges:
Request edge
Occurs when a resource is waiting on a process. In this case SPID 61 (query 1) is waiting to gain access to the Person.Person table. And Spid 62 is waiting to gain access to the Person.Address table.
Owner edge
Occurs when resources are waiting on processes. In this case the Person.person table is waiting on process 62 to release it.
So what can we tell instantly?
-
The processes involved
We can see from this graph that there are 2 processes involved in this deadlock. Process 61 and process 62.
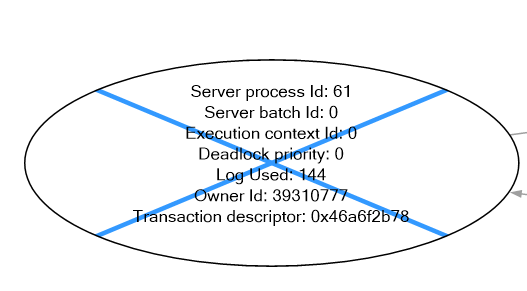
Each process node (indicated in light orange above) displays the following data:
The process id
This is the SPID (session process id) of the process
The server batch id
The identifier for the server batch. This is 0 if there is no batch.
The execution context id
If the thread is associated to another SPID and it is not the main thread it will have a number identifying the subthread. If it is the parent thread this will be 0, like in this example.
The deadlock priority
If a deadlock priority for the specific process was set, this will be displayed here. Typical values are
- LOW : -5,
- NORMAL : 0 and ,
- HIGH: 5
Log use
The amount of space in the transaction log used by the process
Owner id
This is the transaction id of the transaction which owns the request. This value corresponds to the request_owner_id field in the sys.dm_tran_locks DMV.
Transaction descriptor
A pointer to obtain the state if the transaction
Input buffer
This is visible when you hover over the process node in the graph, in this case it will display the Transact-SQL command executed by the process.
Statement
According to msdn this is the type of statement which can be: insert, update, delete, unknown or NOP (no operation)
The deadlock victim
The most obvious information visible to us by looking at the Graph is that Process 61 was chosen as the deadlock victim. We know this because it is crossed out. It is also usually displayed on the left. SQL Server will choose the process with the lowest cost as the victim. One of the criteria is the amount of log used. Since both processes has a deadlock priority of 0 and Process 61 used less log than process 62, it can be rolled back faster and is therefore the victim in this case.

Figure 5: Victim Process -
The resources involved
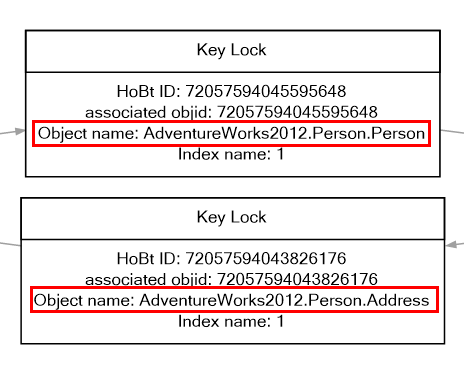
Next we can see which objects are involved in the deadlock. In this case the objects in question are AdventureWorks2012.Person.Person and AdventureWorks2012.Person.Address.
Figure 6: Resources Involved Additional information displayed in the resource nodes are:
The Lock Type
This could be Key Lock (like in this case) , Page lock etc.
The HoBT
This identifies the heap or b-tree which is involved in the deadlock.
The associated objid
The id of the relevant partition as per sys.partitions
The object name
The name of the object on which the lock occurred
The Index name
The index which is involved
-
The lock mode of the held and requested locks
By looking at the description of the edges you can which lock modes are being held or requested.
In this particular case each process is requesting an update lock (Request Mode: U) and each resource has an exclusive lock (Owner Mode: X). To get more information on lock modes and lock compatibility check out the Technet article on Lock Modes.
-
The queries involved
To see the SQL which was involved in the deadlock you can hover over the process nodes to see the queries displayed in a tooltip.
Figure 7: Viewing the queries

Conclusion
There are multiple methods which can be used in troubleshooting deadlocks. Out of all of these, I find the deadlock graph the most useful in order to get a quick overview of what has happened to cause the deadlock. Of course, the deadlock graphical representation on its own is not always enough. There is some information which is not available just by looking at the graph, which is available in the XML description. So please look out for my next article: Deadlocks Part 3: Understanding the XML description of the Deadlock Graph
Other articles in this series:
- What is a SQL Server deadlock?
- Understanding the XML description of the Deadlock Graph in SQL Server

Minette currently works as a Data Platform Solution Architect at Microsoft South Africa.
View all posts by Minette Steynberg
- The end is nigh! (For SQL Server 2008 and SQL Server 2008 R2) - April 4, 2018
- 8 things to know about Azure Cosmos DB (formerly DocumentDB) - September 4, 2017
- Introduction to Azure SQL Data Warehouse - August 29, 2017