
The network parameters is the metric category often neglected when troubleshooting SQL Server issues. Sometimes, SQL Server problems are caused by network congestion. It doesn’t mean that the cause of the bottlenecks originate on SQL Server
All network performance metrics are easiest to read and understand when there are no applications except SQL Server running on the server, as nailing down the application that causes excessive network traffics is simple. Then, you should search for SQL queries, clients, and events that transfer large amount of data over network
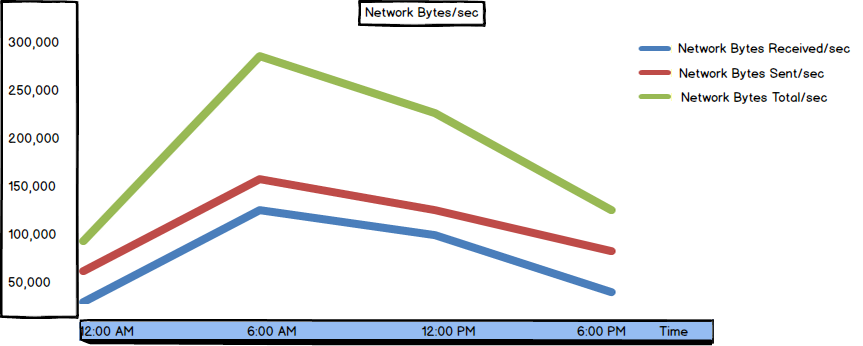
Network Bytes Received/sec
The Network Bytes Received/sec counter shows the byte rate at which information is received over each network adapter. The bytes used for data packet framing are also counted and included in the value
The counter shows “how many bytes you get from the NIC. This is a measure of the inbound traffic” [1]
You can use this counter to calculate the incoming data rate based on the total available network bandwidth, as this information is easier to understand and identify potential network clogging
There is no specific threshold value. However, have in mind that Network Bytes Received/sec is a component of the Total bytes/sec counter, which should be less than 50% of total network bandwidth
It’s recommended to watch this counter overtime and determine trends. Any unexpected peak in network activity should be investigated and the origin of the massive network traffic should be identified
Network Bytes Sent/sec
Similar to the Network Bytes Received/sec counter, the Network Bytes Sent/sec counter shows the rate at which bytes are sent over each network adapter. Again, it’s useful to calculate the outgoing data rate as a percentage of the total network bandwidth
“This is how many bytes of data are sent to the NIC. This is a raw measure of throughput for the network interface. We are really measuring the information sent to the interface which is the lowest point we can measure. If you have multiple NIC, you will see multiple instances of this particular counter.” [1]
The same as with Network Bytes Received/sec, there is no specific threshold, but you should have in mind the Total bytes/sec value
Network Bytes Total/sec
As expected, the sum of Bytes Received/sec and Bytes Sent/sec is equal to the Bytes Total/sec value. It is the byte rate at which data is received and sent over each network adapter. Framing bytes are included
“This is simply a combination of the other two counters. This will tell you overall how much information is going in and out of the interface. Typically, you can use this to get a general feel, but will want to look at the Bytes Sent/sec and the Bytes Received/sec for a more exact detail of the type of traffic.” [1]
When investigating high Bytes Total/sec values, check the %Disk Time counter for the physical disk and %Processor Time values. If the latter two are normal, this is an indication of a capacity problem that can be solved by network interface configuration or adding an additional network adapter. Also, network re-configuration and creating subnets can solve the problem
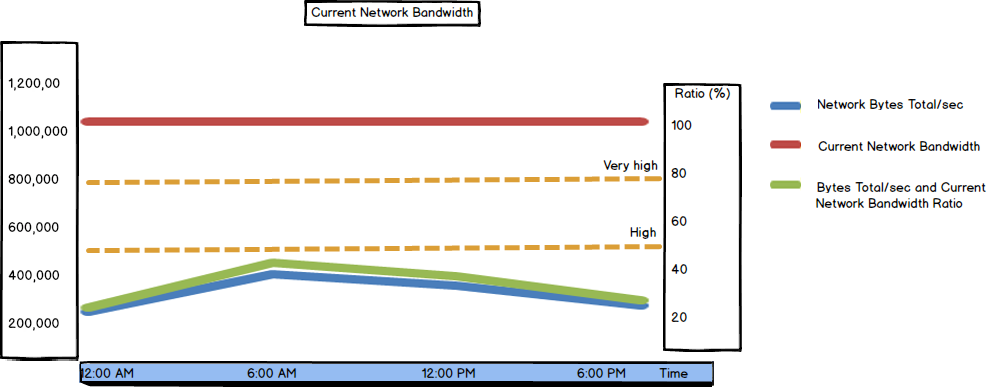
Current Network Bandwidth
The network bandwidth shows how much data can be transferred through a network interface over time. Some other resources define it as the maximum rate of a network data transfer, or network capacity. The network bandwidth depends on the network infrastructure. What you can control and configure is the amount of network bandwidth used by your servers
The Current Network Bandwidth metric “Shows an estimate of the current bandwidth of the network interface in bits per second (BPS). For interfaces that do not vary in bandwidth or for those where no accurate estimation can be made, this value is the nominal bandwidth.” [2]
A network with a high bandwidth is a prerequisite for good SQL Server performance over network
For performance monitoring, compare the Current Network Bandwidth value to Bytes Total/sec. The Bytes Total/sec and Current Network Bandwidth ratio is also called Network utilization
The Bytes Total/sec value for all servers on a network should be less than 50% of the total network bandwidth. If constantly higher, additional investigation is required. The first step is to determine the applications that are saturating the network. Have in mind that some operations, such as creating SQL Server database backups on a remote storage, use a lot of network bandwidth
The ratio values higher than 80% indicate very high network utilization that should be attended immediately. If the ratio is close to 100%, it means that you’re using almost maximum network capacity, and that additional traffic will cause bottlenecks, which will reflect in delays. This situation can be solved by increasing the bandwidth (which is sometimes not easy to achieve, or not possible at all), or segmenting the network
To see real-time values of network performance metrics listed above – Network Bytes Received/sec, Network Bytes Sent/sec, and Network Bytes Total/sec, use Windows Resource Monitor
- Open Windows Task Manager (press Ctrl+Alt+Delete)
- Open the Performance tab
- Click Open Resource Monitor at the bottom
- Open the Network tab
It consists of four sections – Processes with Network Activity, Network Activity, TCP Connections, and Listening Ports
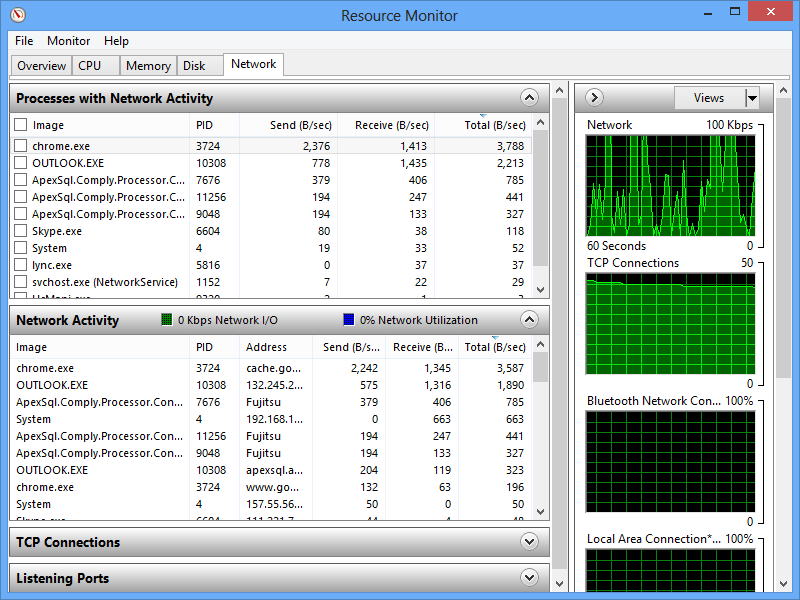
Selecting a process in the first section displays its details in the other three
The TCP Connections and Listening Ports sections show information useful for deeper investigation and troubleshooting
Besides the network performance metrics listed above, there are many more. The metrics available in Windows Performance Monitor are Processor : % DPC Time, Processor : DPCs queued/sec, Network Segment : %Broadcasts, Network Segment : %Multicasts, TCP : Segments Sent/sec, TCP : Segments Received/sec, TCP : Segments/sec, TCP : Segments Retransmitted/sec, TCP : Connection Failures, TCP : Connections Reset, and TCP : Connections Established. However, these metrics are rarely used for troubleshooting SQL Server performance issues
To solve SQL Server network bottlenecks, start with optimizing your workload. Consider optimizing and/or reducing network traffic between your client application and the SQL Server instance. It requires design changes, such as using stored procedures instead of queries, reusing execution plans, calling smaller data sets where applicable, etc.
If this doesn’t provide adequate performance improvement, add network adapters and re-configure network settings

She has been working with SQL Server since 2005 and has experience with SQL 2000 through SQL 2014.
Her favorite SQL Server topics are SQL Server disaster recovery, auditing, and performance monitoring.
View all posts by Milena "Millie" Petrovic
- Using custom reports to improve performance reporting in SQL Server 2014 – running and modifying the reports - September 12, 2014
- Using custom reports to improve performance reporting in SQL Server 2014 – the basics - September 8, 2014
- Performance Dashboard Reports in SQL Server 2014 - July 29, 2014