
In this part, we will continue with SQL Server memory performance metrics and present Lazy Writes, Free List Stalls/sec, and Memory Grants Pending
Lazy Writes
To understand the Lazy Writes metric better, we’ll explain the lazy writer process and checkpoints first
Best performance is provided when SQL Server reads pages it needs from the buffer instead from disk. As the space available in the buffer is limited by physical memory, pages are constantly moved from the buffer to disk, to free up the space for new pages. These pages are usually moved at a check point, which can be automatic (occurs automatically to meet the recovery interval request) , indirect (occurs automatically to meet the database target recovery time), manual (occurs when the CHECKPOINT command is executed), and internal (occurs along with some server-level operations, such as backup creation)
At a checkpoint, all dirty pages containing both committed and uncommitted transactions are flushed to disk. Then, the page in the buffer cache is marked for overwriting
"For performance reasons, the Database Engine performs modifications to database pages in memory—in the buffer cache—and does not write these pages to disk after every change. Rather, the Database Engine periodically issues a checkpoint on each database. A checkpoint writes the current in-memory modified pages (known as dirty pages) and transaction log information from memory to disk and, also, records information about the transaction log."[1]
The lazy writer is a process that periodically checks the available free space in the buffer cache between two checkpoints and ensures that there is always enough free memory. When the lazy writer determines free pages are needed in the buffer for better performance, it removes the old pages before the regular checkpoint occurs
If a dirty data page (a page read and/or modified) in the buffer hasn’t been used for a while, the lazy writer flushes it to disk and then marks as free in the buffer cache
If SQL Server needs more memory then currently used and the buffer cache size is below the value set as the Maximum server memory parameter for the SQL Server instance, the lazy writer will take more memory. On the other hand, the lazy writer will release free buffer memory to the operating system in case there’s insufficient memory for Windows operations
The Lazy writes metric is defined as "Number of times per second SQL Server relocates dirty pages from buffer pool (memory) to disk" [2]
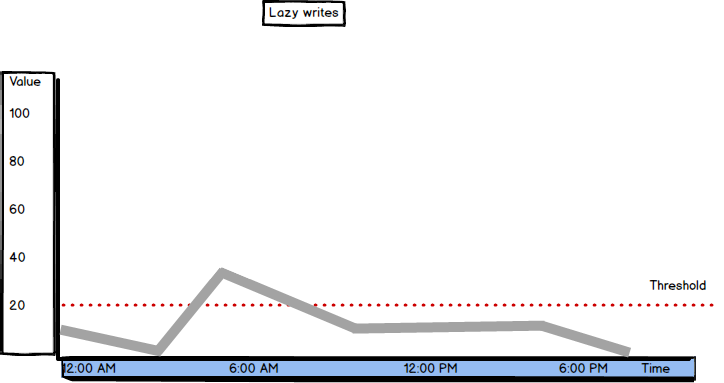
The threshold value for Lazy Writes is 20. If SQL Server is under memory pressure, the lazy writer will be busy trying to free enough internal memory pages and will be flushing the pages extensively. The intensive lazy writer activity can cause a system bottleneck, as it affects other resources by causing additional physical disk I/O activity and using more CPU resources
If the Lazy Writes value is constantly higher than 20, to be sure that the server is under memory pressure, check Page Life Expectancy. If its value is low (below 300 seconds), this is a clear indication of memory pressure. Check the Free List Stalls/sec value as well. If above 2, consider adding memory to the server
Ideally, Lazy Writes should be close to zero. That means that the buffer cache doesn’t have to free up dirty pages immediately, it can wait for the automatic check point
It would be logical to obtain the Lazy Writes value by querying the sys.dm_os_performance_counters view, like for other Buffer Manager counters
|
1 2 3 4 5 6 |
SELECT object_name, counter_name, cntr_value, cntr_type FROM sys.dm_os_performance_counters WHERE [object_name] LIKE '%Buffer Manager%' AND [counter_name] = 'Lazy writes/sec' |
But, the value returned is higher by several orders of magnitude from the recommended minimum
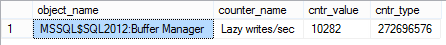
The reason for this is that the value shown for the cntr_type 272696576 in the view is incremental and represents the total number of lazy writes from the last server restart. To find the number of Lazy Writes in a second, find the difference in the Lazy Writes counter values in two specific moments and divide by the time
|
1 2 3 4 5 6 7 8 9 10 11 12 |
DECLARE @LazyWrites1 bigint; SELECT @LazyWrites1 = cntr_value FROM sys.dm_os_performance_counters WHERE counter_name = 'Lazy writes/sec'; WAITFOR DELAY '00:00:10'; SELECT(cntr_value - @LazyWrites1) / 10 AS 'LazyWrites/sec' FROM sys.dm_os_performance_counters WHERE counter_name = 'Lazy writes/sec'; |
Free List Stalls/sec
Free list stalls/sec is another SQL Server metric available in Buffer Manager
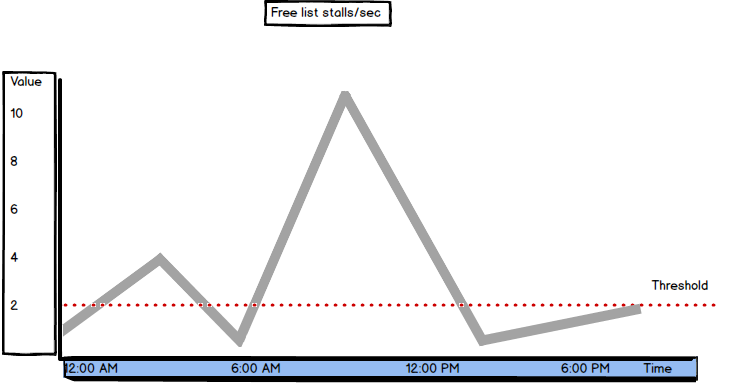
"Indicates the number of requests per second that had to wait for a free page."[2]
If there were no free pages in the buffer cache, a request is stalled and has to wait until a page in the buffer is freed
The recommended value is below 2. When the Free list stalls/sec value is higher than the recommended, check the Page Life Expectancy and Lazy Writes/sec values, as well. If the Page Life Expectancy value is below 300 seconds and Lazy Writes/sec above 2, it’s a clear sign of memory pressure
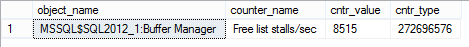
As the Free list stalls/sec counter type is 272696576, the current value has to be calculated using the same method as for Lazy Writes
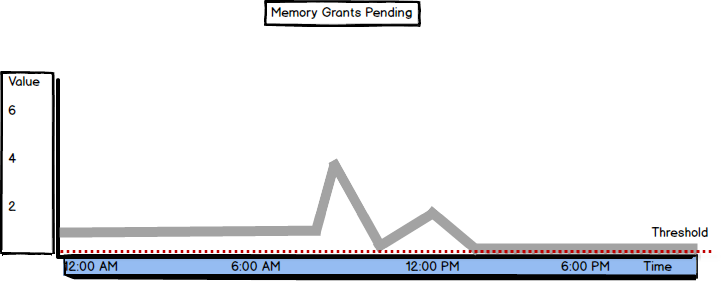
Memory Grants Pending
Memory Grants Pending is the metric available in SQL Server Memory Manager
Its value shows the total number of SQL Server processes that are waiting to be granted workspace in the memory
The recommended Memory Grants Pending value is zero, meaning no processes are waiting for the memory, as there’s enough memory so the processes are not queued. If the value is constantly above 0, try with increasing the Maximum Server Memory value
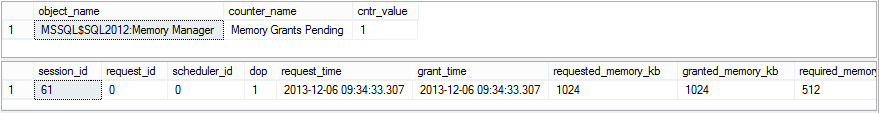
The value for this metric can be queried from the sys.dm_os_performance_counters view. No additional calculation is needed, as the cntr_type value 65792 shows the current value
|
1 2 3 4 5 6 |
SELECT object_name, counter_name, cntr_value FROM sys.dm_os_performance_counters WHERE [object_name] LIKE '%Memory Manager%' AND [counter_name] = 'Memory Grants Pending' |
For troubleshooting the insufficient memory issues when the processes are waiting for memory to be granted, it is useful to know what processes and queries are waiting
The sys.dm_exec_query_memory_grants view "Returns information about the queries that have acquired a memory grant or that still require a memory grant to execute. Queries that do not have to wait on a memory grant will not appear in this view." [3]
The grant_time value is NULL if the memory hasn’t been granted memory yet
|
1 2 3 4 5 |
SELECT * FROM sys.dm_exec_query_memory_grants WHERE grant_time IS NULL |
As high Memory Grants Pending values can be caused by inefficient queries, bad or missing indexing, sorts or hashes, query tuning and workload optimization are the first steps in resolving this issue. The last resource is adding more physical memory
If the memory granted is insufficient for a query, which is especially the case with expensive operations that use a lot of resources, such as hashes and sorts, a hash or sort warning will be logged into a SQL trace
"A hash warning occurs when the hash build doesn’t fit in memory and must be spilled to disk (its actually written to tempdb). A sort warning occurs when a multi-pass sort is required because the granted memory was insufficient."[4]
If a query spends too much time waiting for the memory to be granted, it will time out. If many queries wait for the memory grants, it’s likely that they will cause a block before they time out
Other SQL Server Memory Manager metrics that indicate memory usage by queries are:
Memory Grants Outstanding – shows the number of granted memory requests
Granted Workspace Memory (KB) – shows how much of query memory is currently in use
Maximum Workspace Memory (KB) — shows the memory that SQL Server has designated as query memory
So far, we have presented the most important and commonly used SQL Server memory metrics. They provide three different types of information they provide. The first type is straightforward where the value clearly indicates bad or good performance, like Memory Grants Pending. The second is where checking the other metrics values is highly recommended because the bad value of the metric itself doesn’t have to be an indication of bad performance. This is the case with Buffer Cache Hit Ratio. The third group of metrics are the ones that have no specific values for good and bad performance, but you should monitor them for a while and establish a baseline that you will consider as normal operation

She has been working with SQL Server since 2005 and has experience with SQL 2000 through SQL 2014.
Her favorite SQL Server topics are SQL Server disaster recovery, auditing, and performance monitoring.
View all posts by Milena "Millie" Petrovic
- Using custom reports to improve performance reporting in SQL Server 2014 – running and modifying the reports - September 12, 2014
- Using custom reports to improve performance reporting in SQL Server 2014 – the basics - September 8, 2014
- Performance Dashboard Reports in SQL Server 2014 - July 29, 2014