
Introduction
Oft times we are forced into situations where we clearly need to think outside of the box. A case at hand arose early in 2014 where one of our client’s required a “quick and dirty” front end to modify data within a table that reflected the outstanding balances (of their clients) and the attempts that they had made to recover these funds. Master Data Services seemed to be the way to go!
Unorthodox Yes!! Abnormal No!!
In our get together today, we shall construct a similar application utilizing Master Data Services. Further I have aimed our conversation at a general level to give you all a flavour for what the product can actually do and how it can help you in your day to day business activities.
This said, I would ask for your feedback after having read this article, as to whether or not you would like to learn more on this topic!!
Finally, in the interest of simplicity and time, I have taken the liberty of pre-loading Master Data Services with Product Data from Contoso and with this we shall create a working application from scratch.
Let’s get started!
Getting started
As a starting point, I am going to assume that your SQL Server instance has access to Master Data Services. If not, the installation of the product is fairly simple and instructions are readily available on line. As always, should you have any issues, please do contact me.
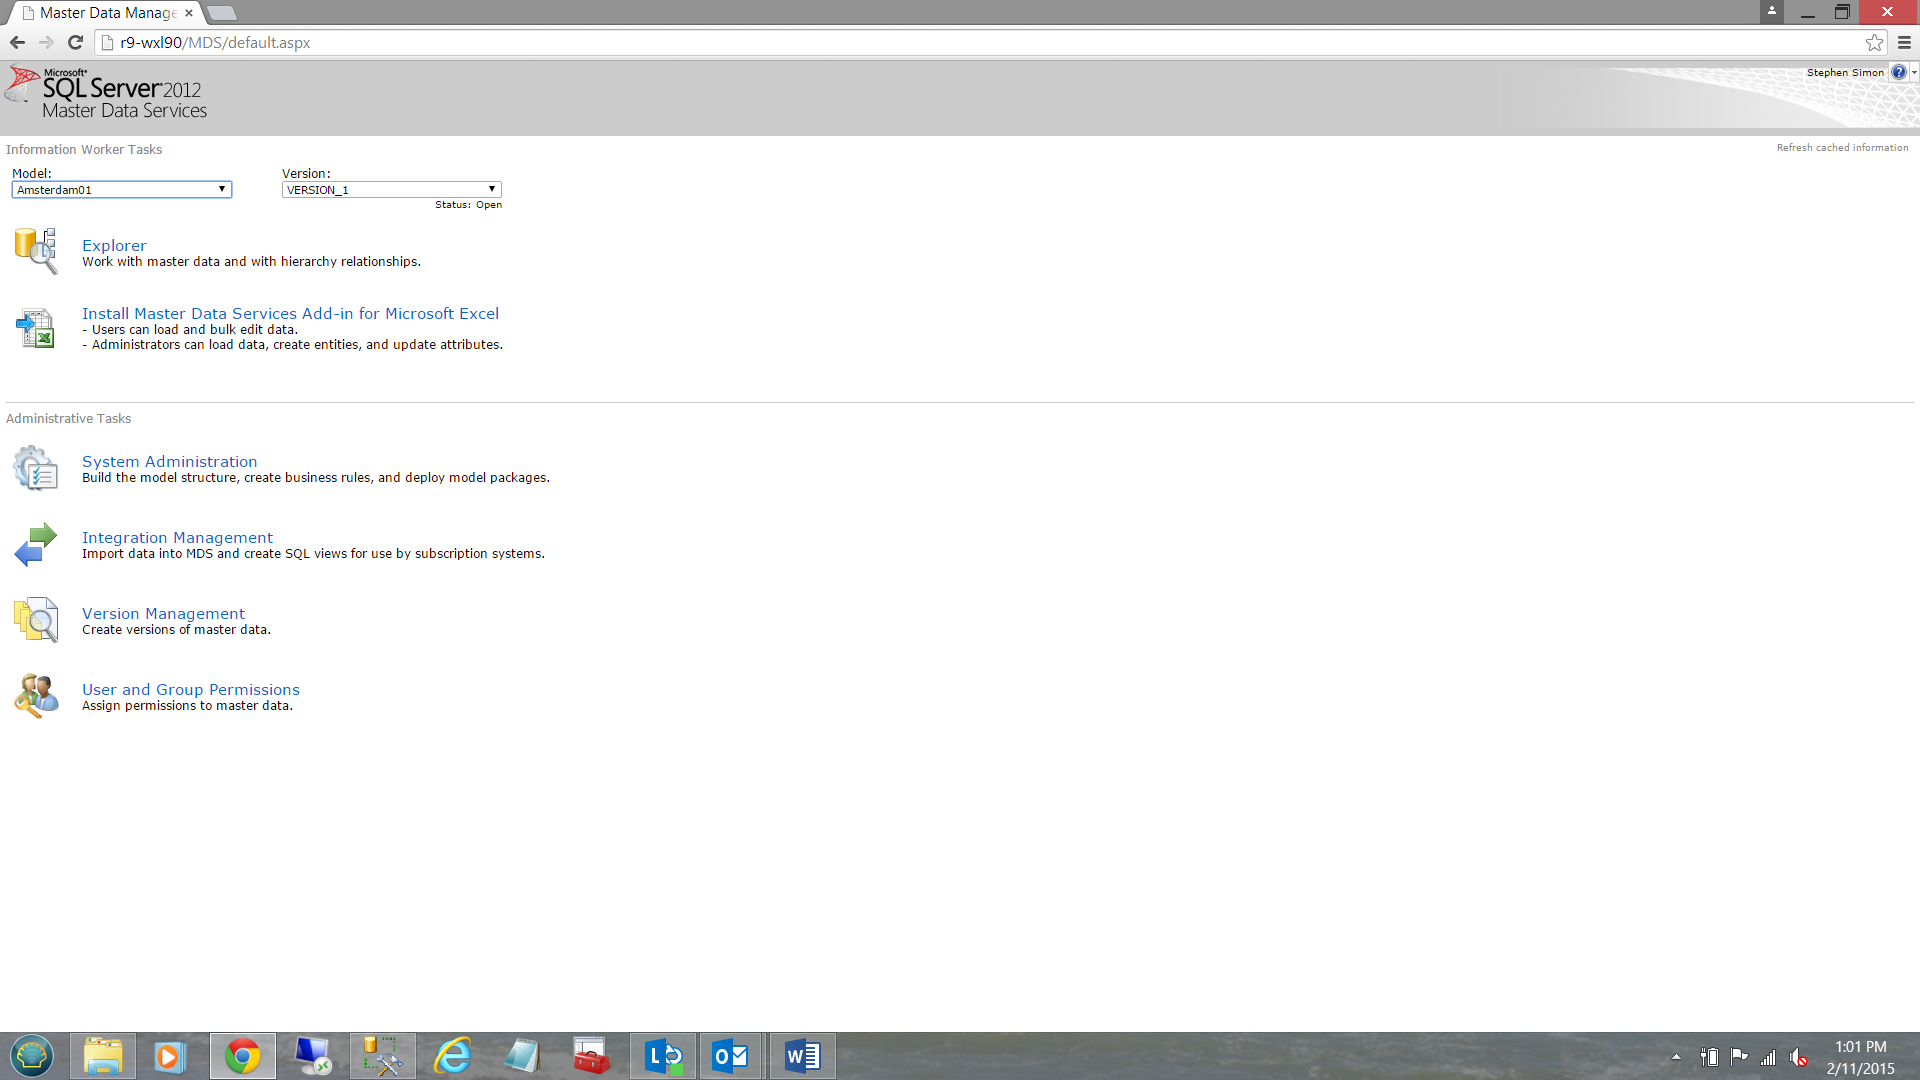
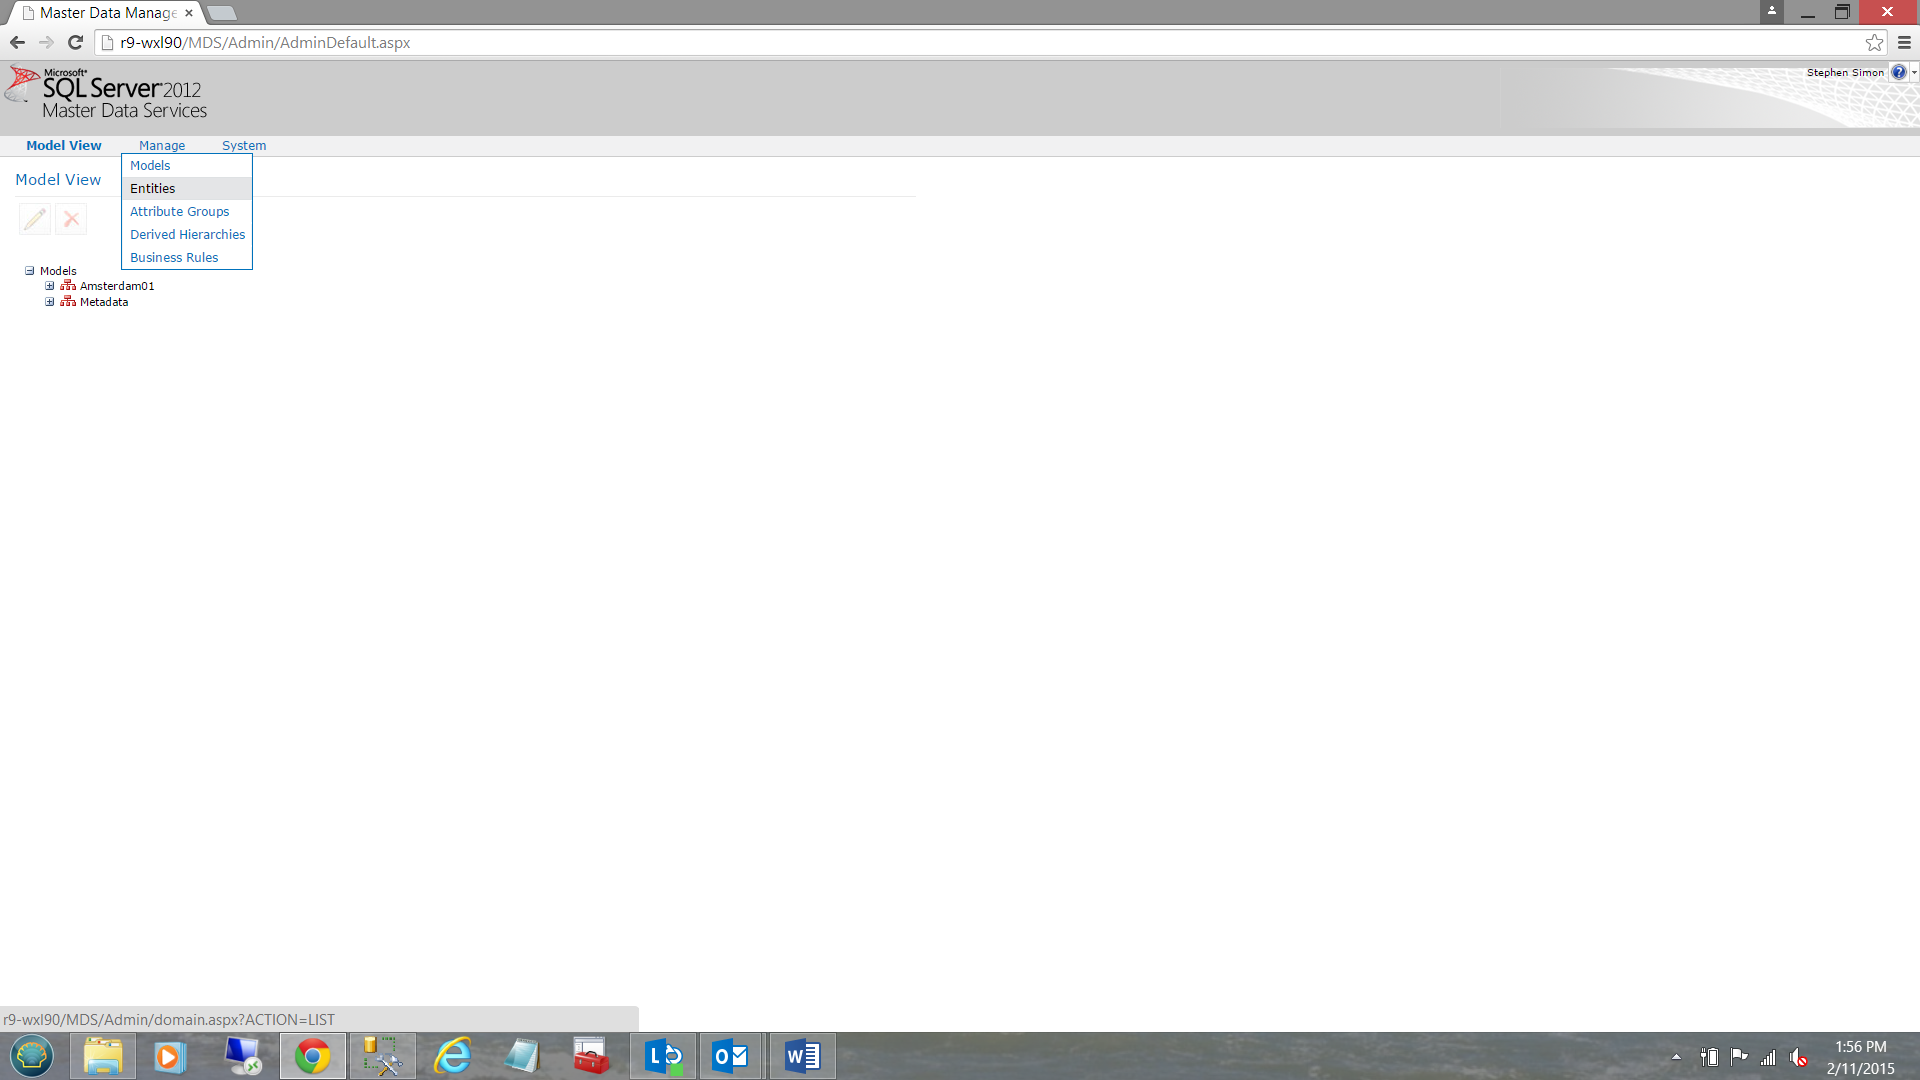
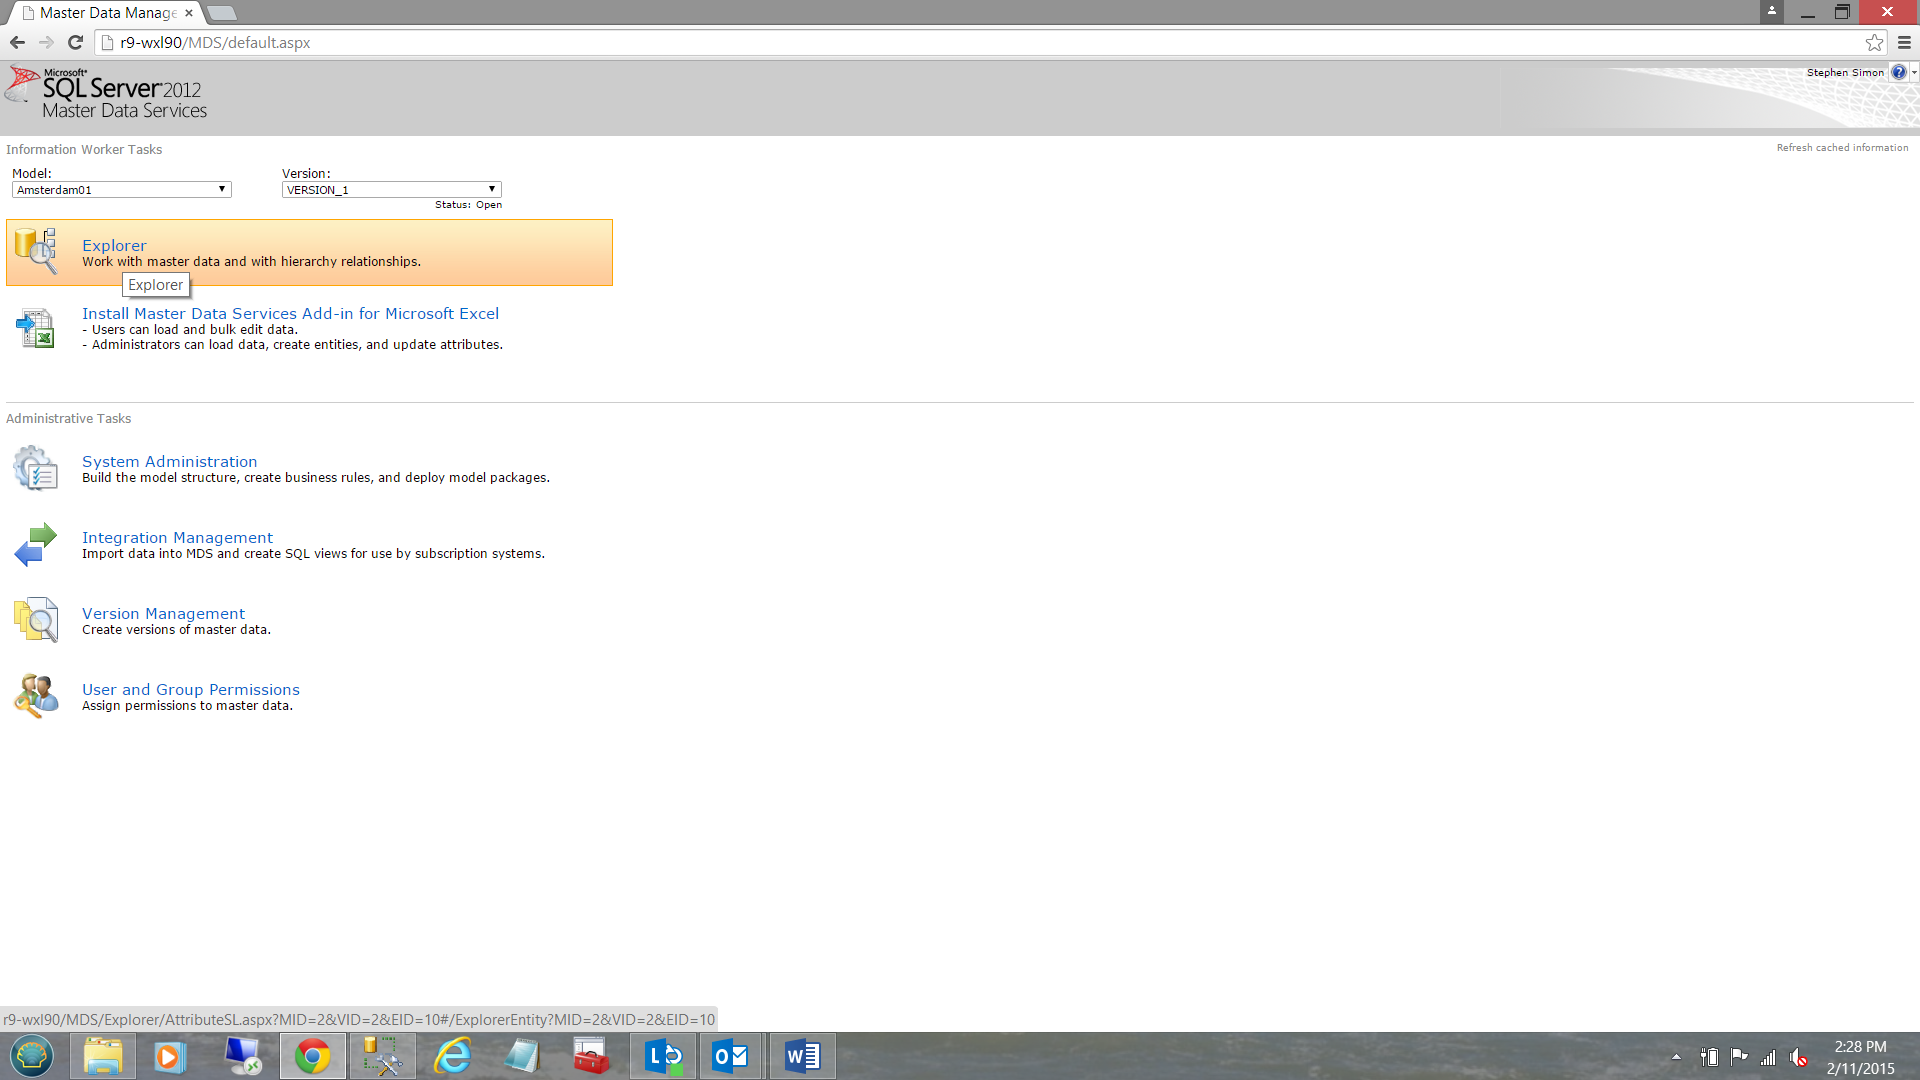
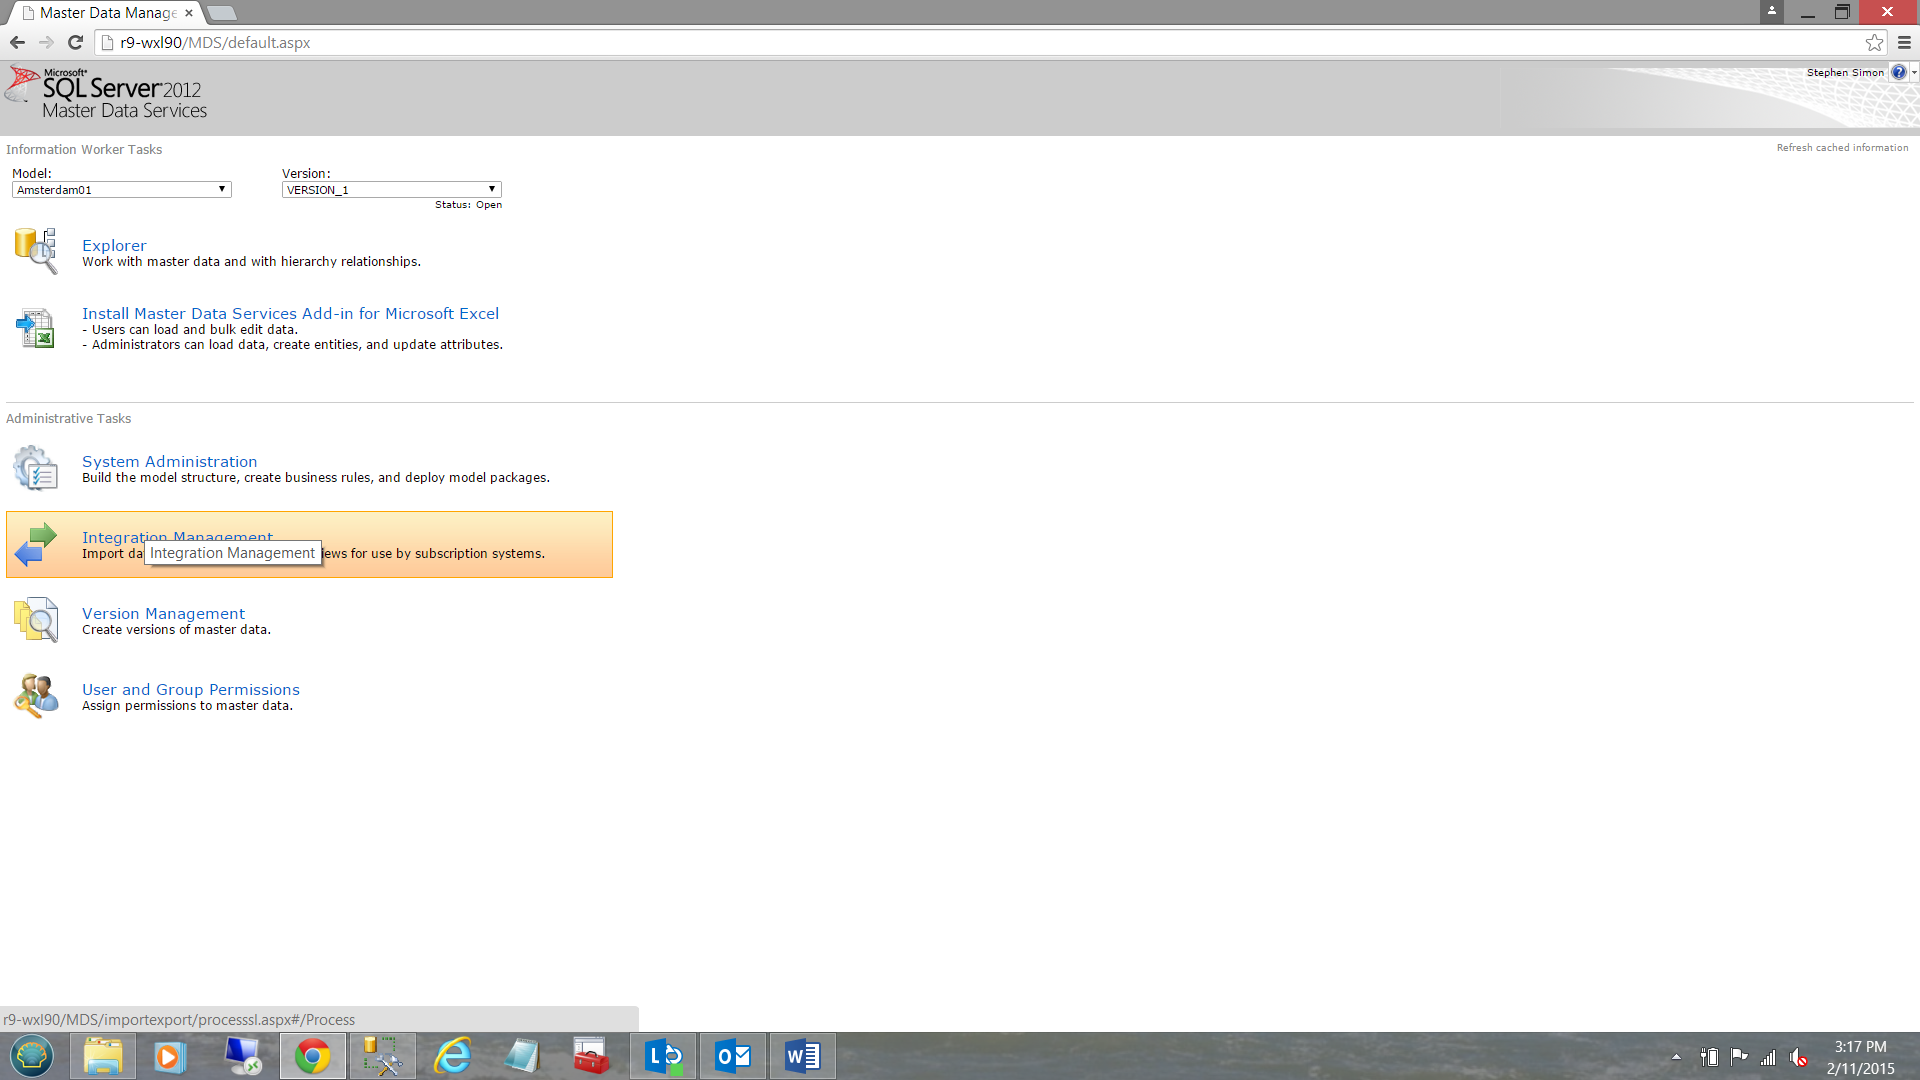
The Master Data Services client is web based. We enter the client URL and the SQL Server Master Data Services frontend is brought into view (see above).
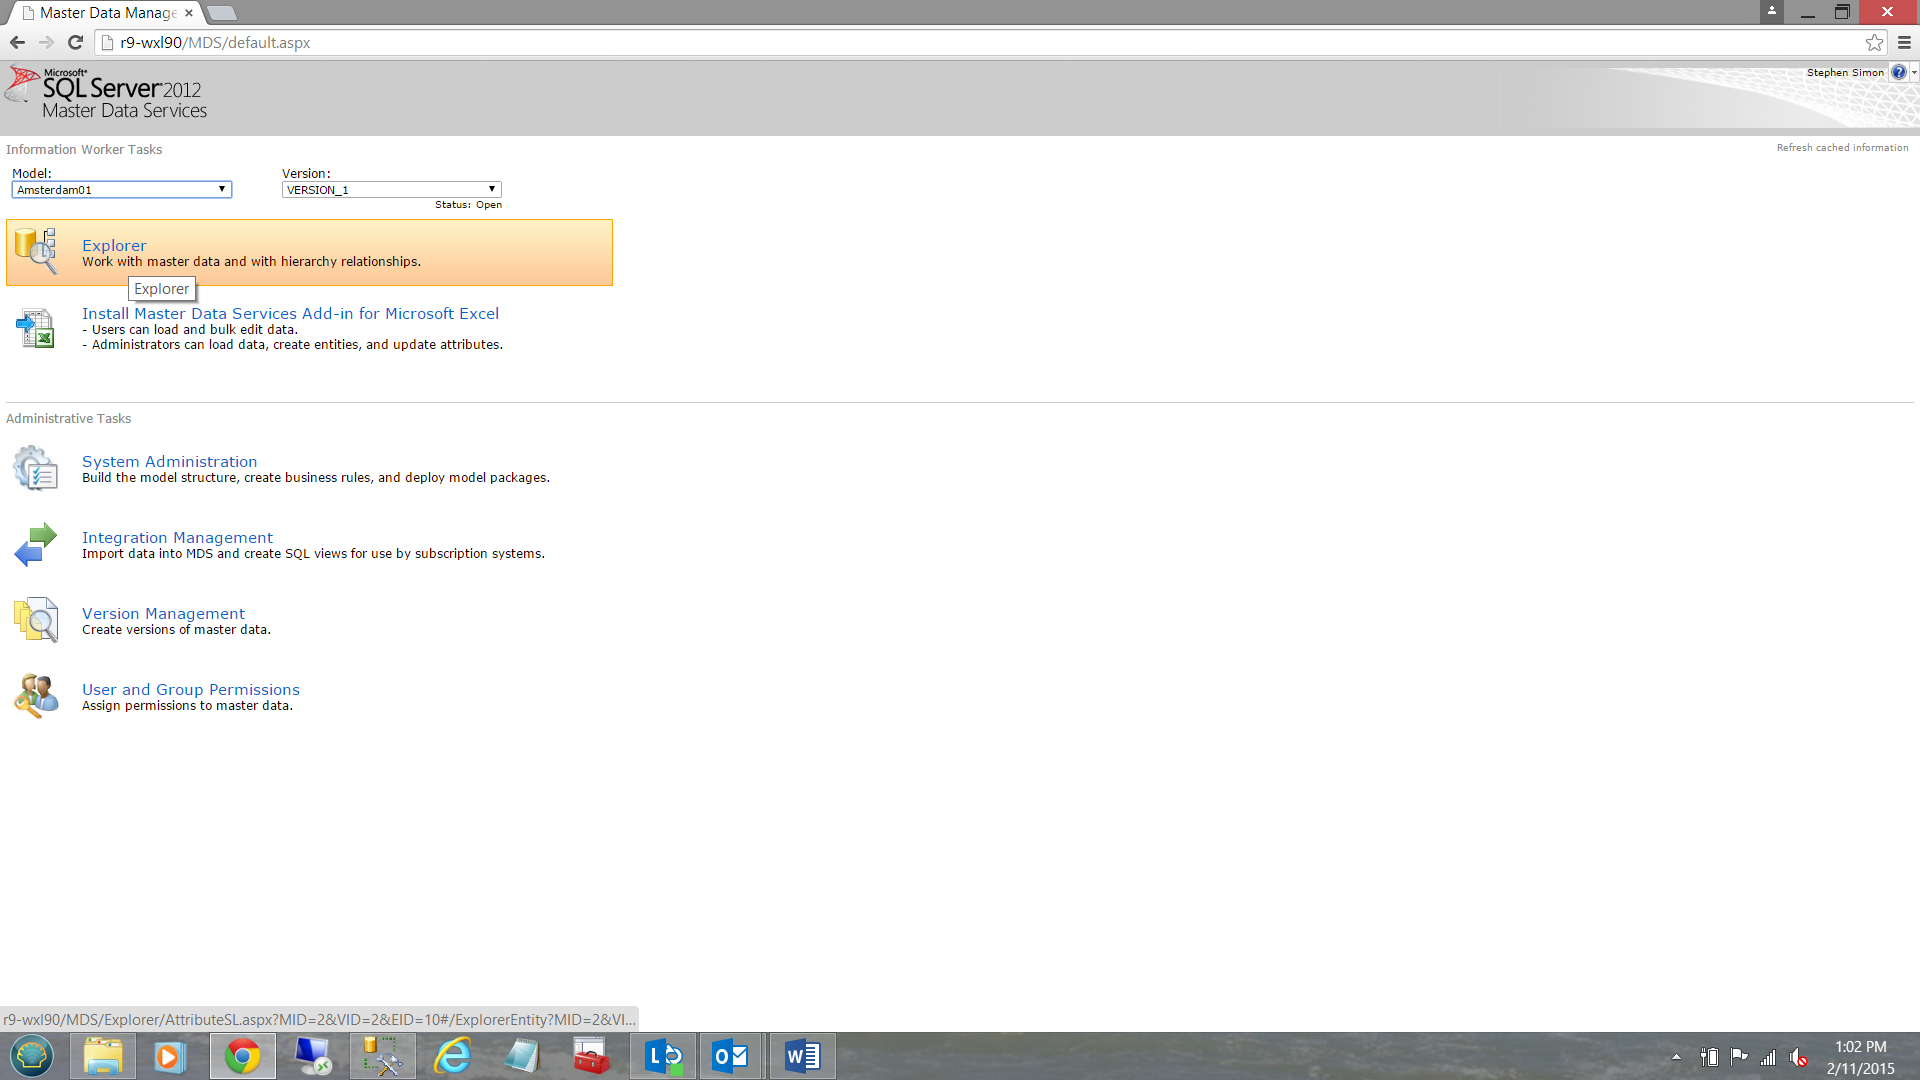
We note that there are six distinct tabs or activities. In todays “get together” as I want you to get the million meter view of the product, we shall primarily utilize the “Explorer” (see above). Note also, that the model that we shall be utilizing is the “Amsterdam01” model (which is the model that I used for my Master Data Services presentation at the PASS Amsterdam Rally, a few years back).
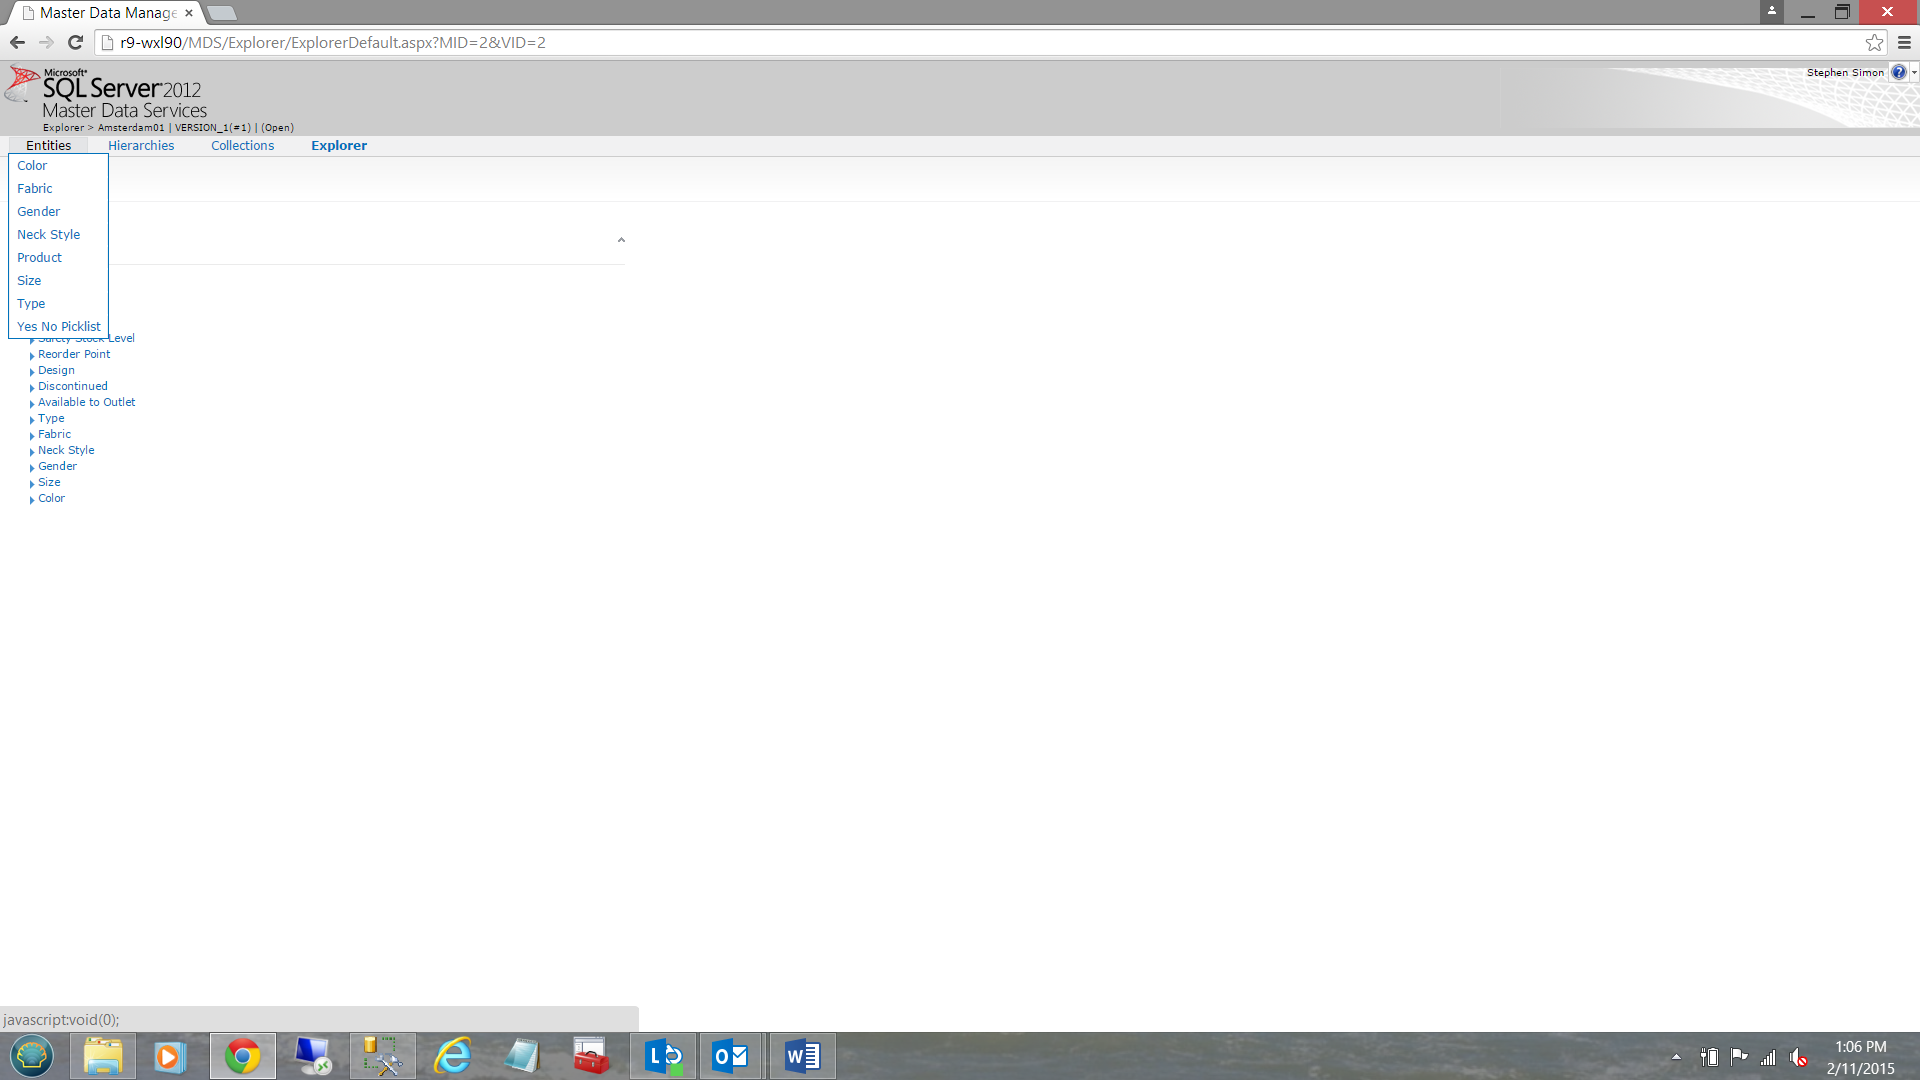
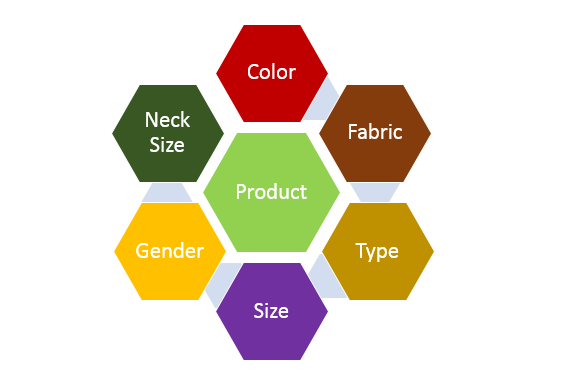
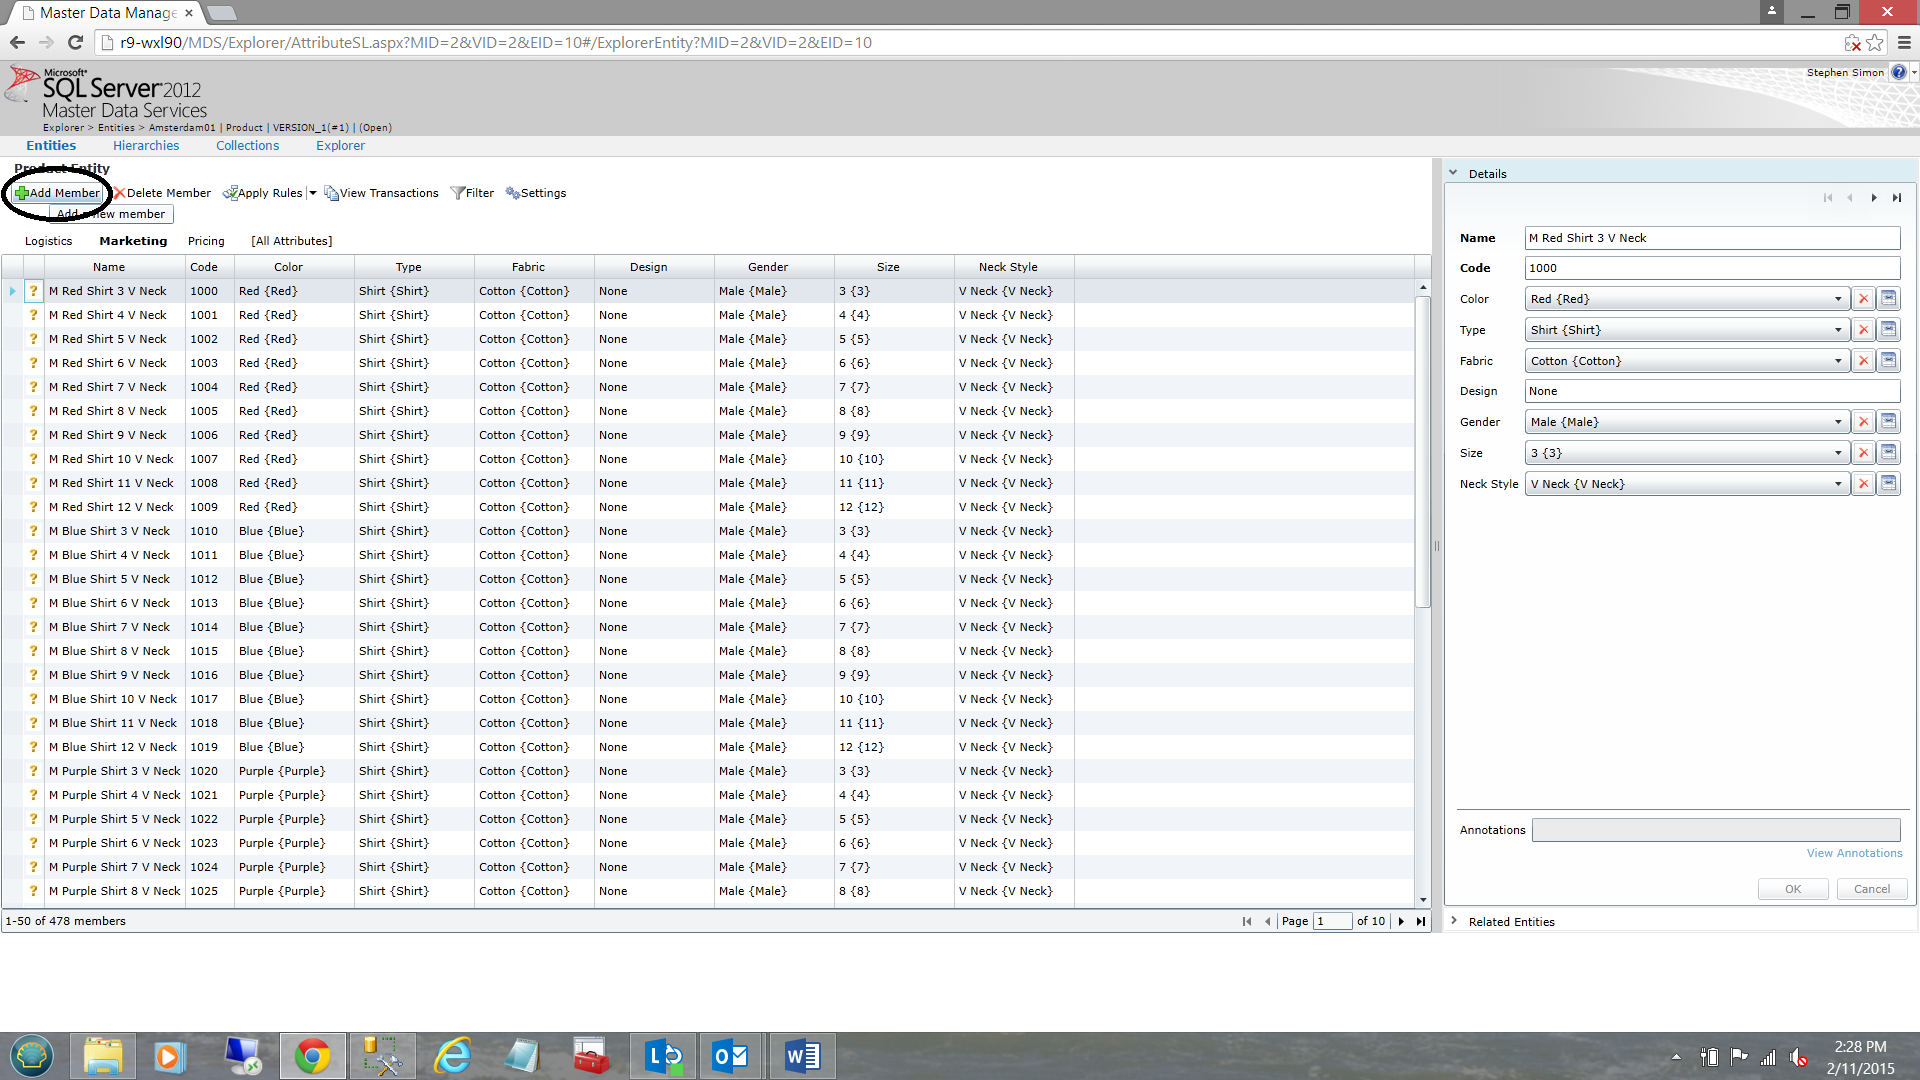
Clicking on the explorer tab, we find ourselves at the “Entities” tab (see above). For our purposes an entity is the same as a “table”. Our main entity / table is “Product”. Products have one or more attributes such as Color, Gender, Neck Style, Fabric, Size and Type amongst many others. This is the ‘lay of the land’ (see below).
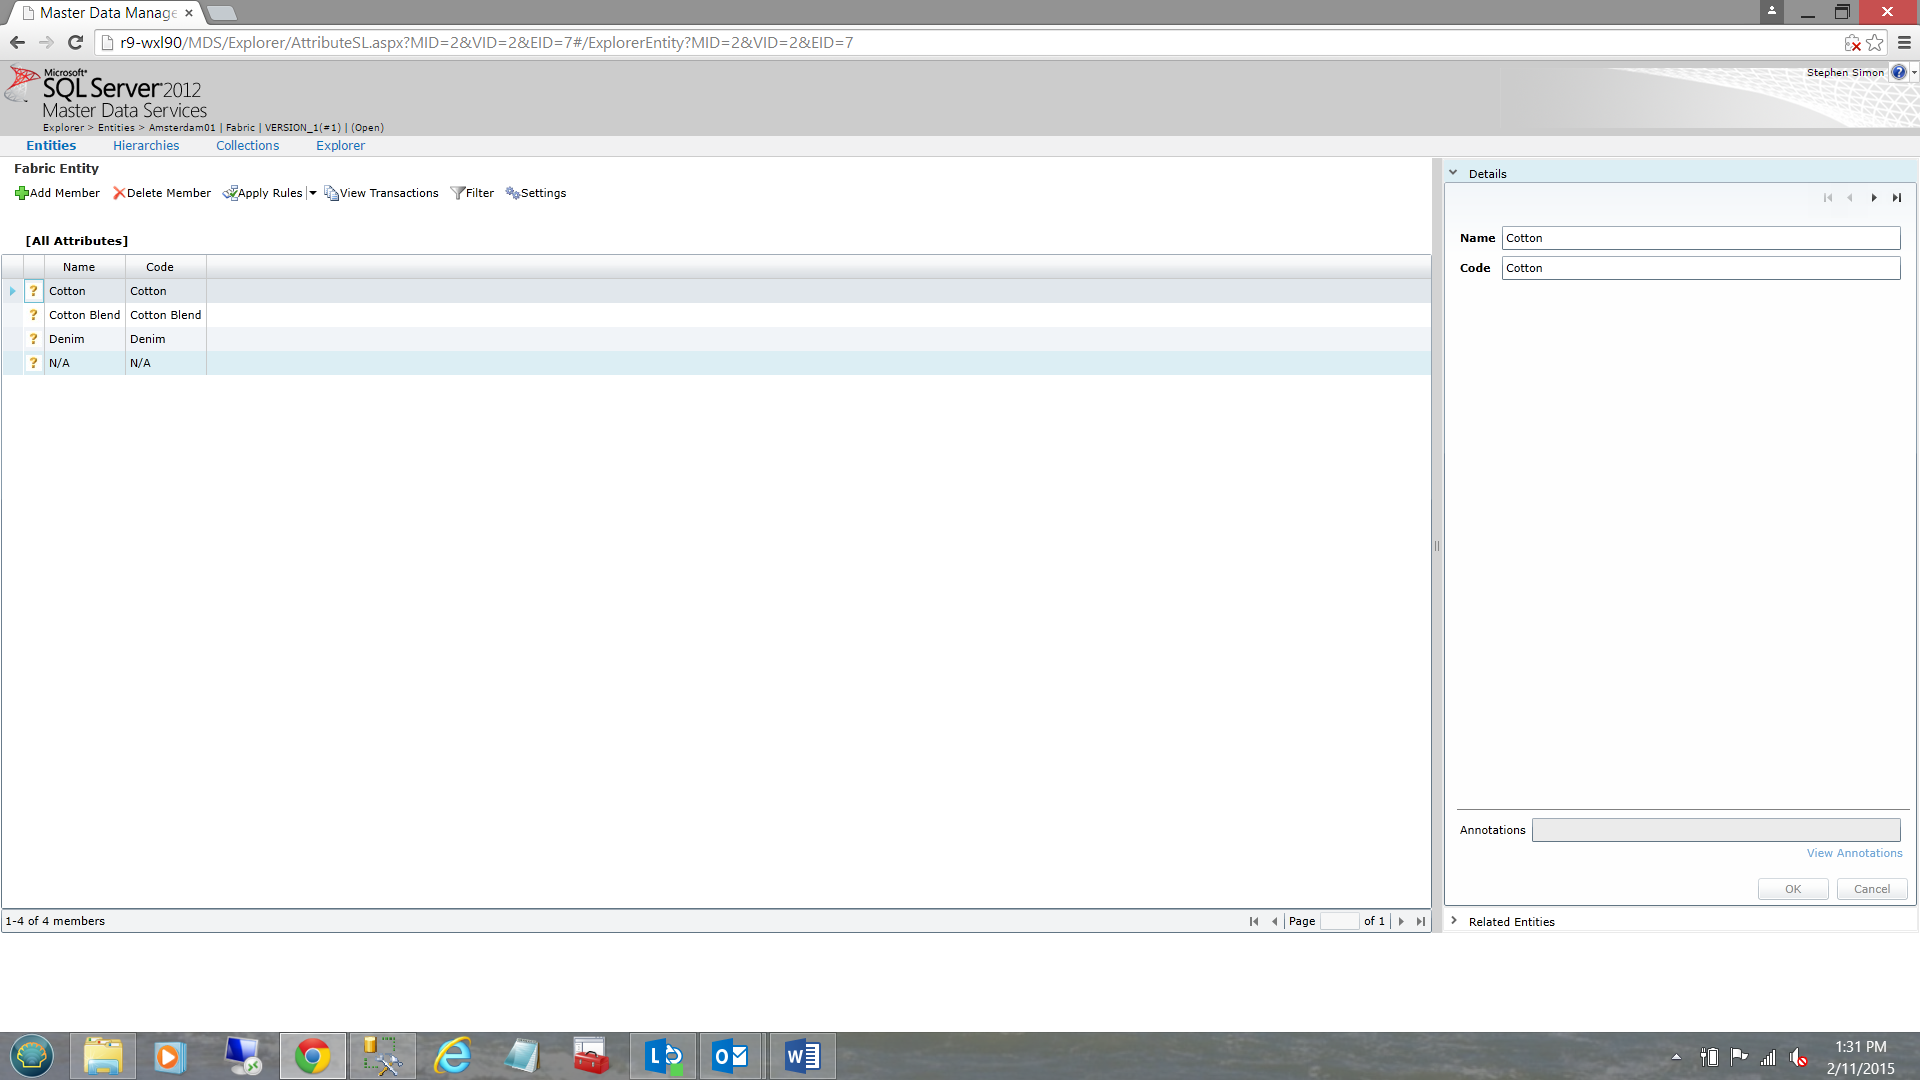
Opening the Color entity (see above) we find the following “Pick List”.
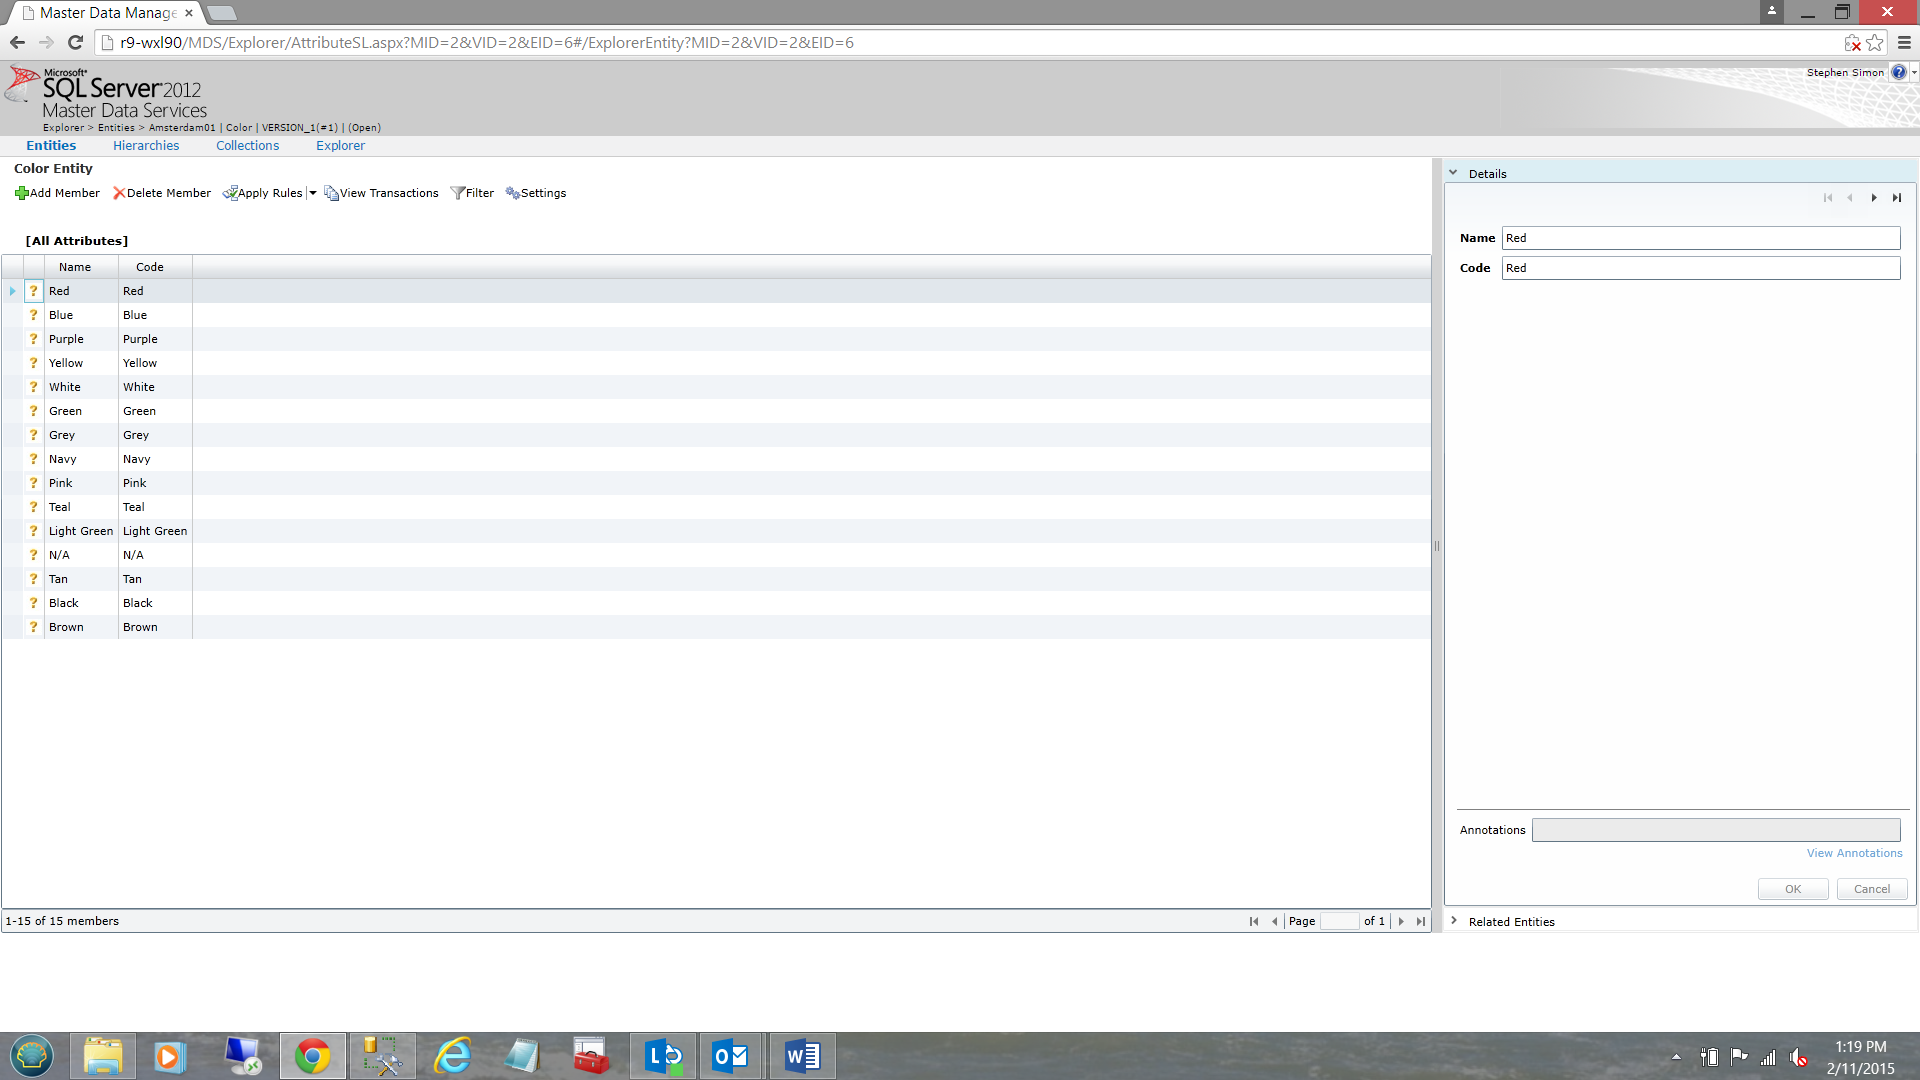
The astute reader will note that there are two “fields” to the entity (Name and Code). These are system defined fields and are an integral part of Master Data Services. Looking at the members of the entity we note a plethora of colors (see above).
We note the dialogue box to the right of the screen. This is the “Details” box. Note that the color “Red” is shown for both the “Name” and “Code” fields (see above).
The IMPORTANT point is yet to come. We can manually enter another color should we wish, to meet changing business rules!!
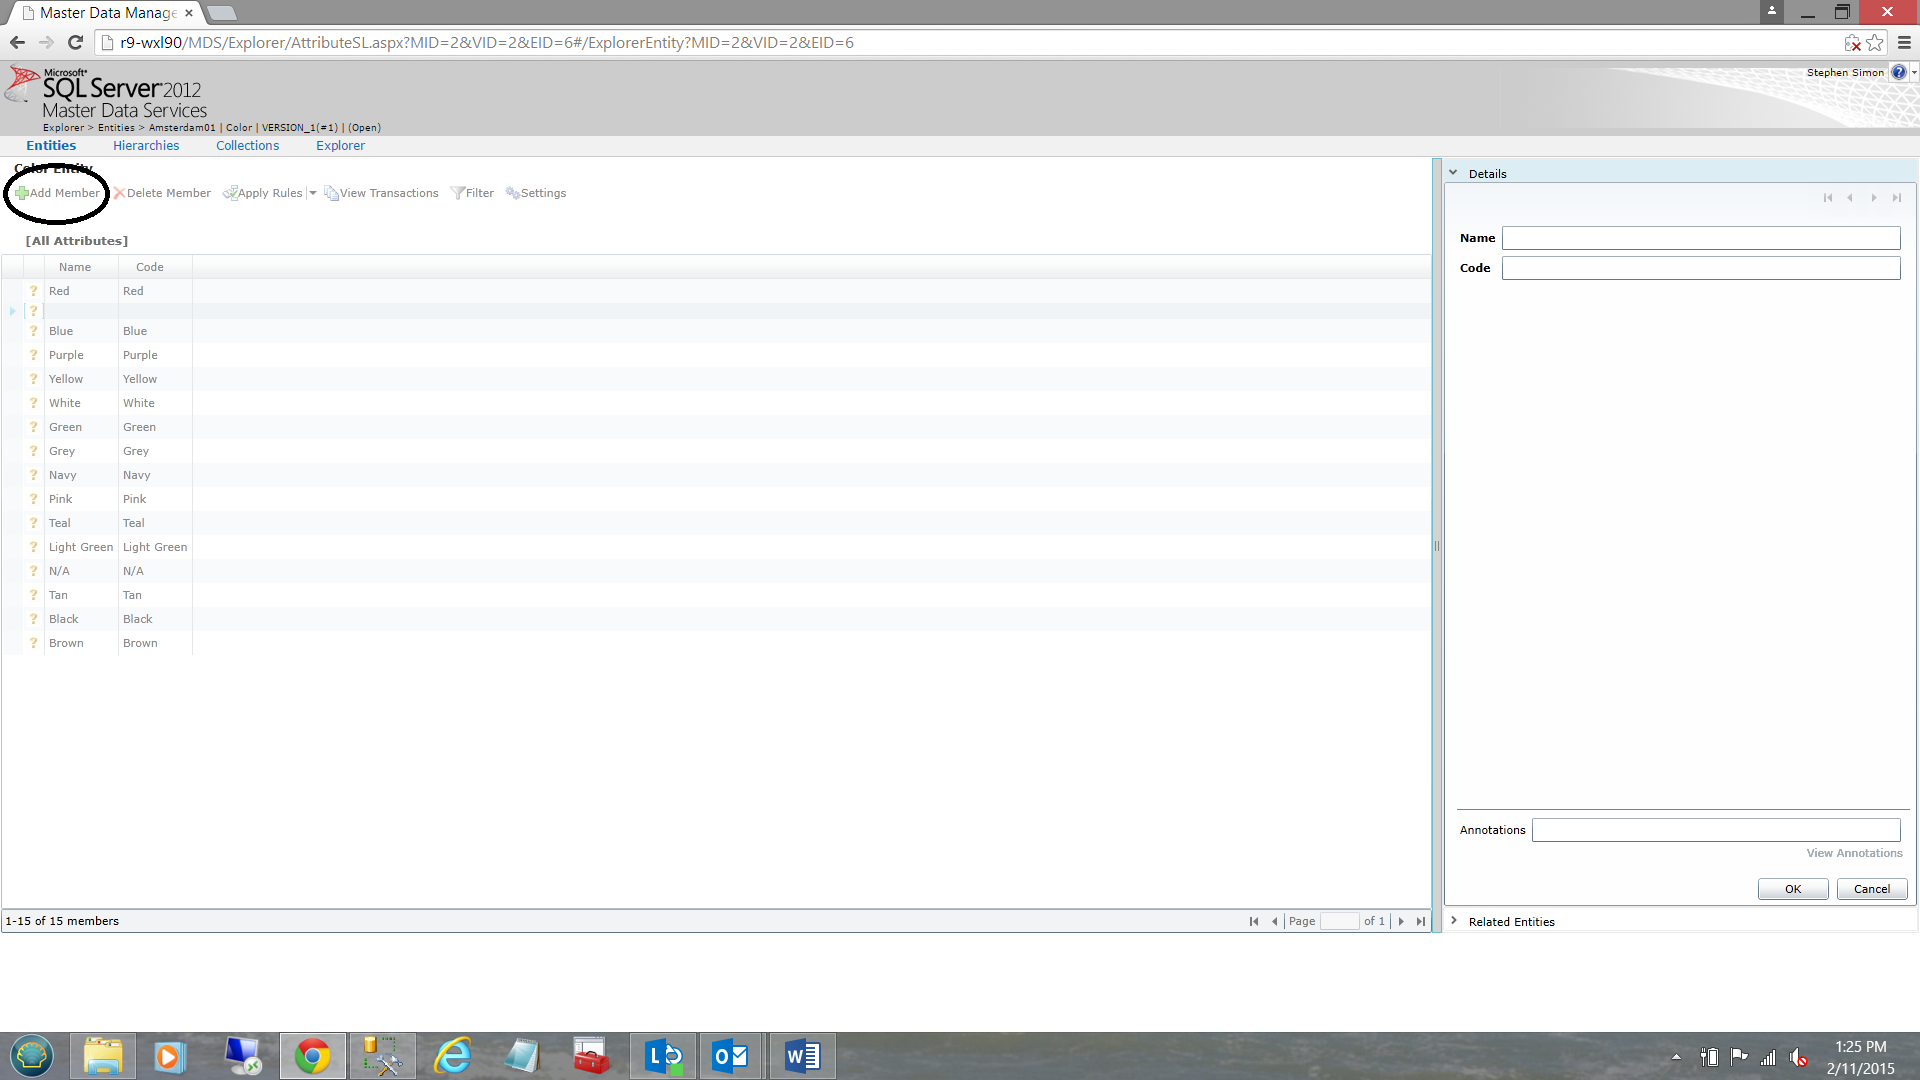
By clicking on “Add Member” (see above) our “Detail” box is refreshed and two text boxes are displayed for us to enter a new color (see above and to the right).
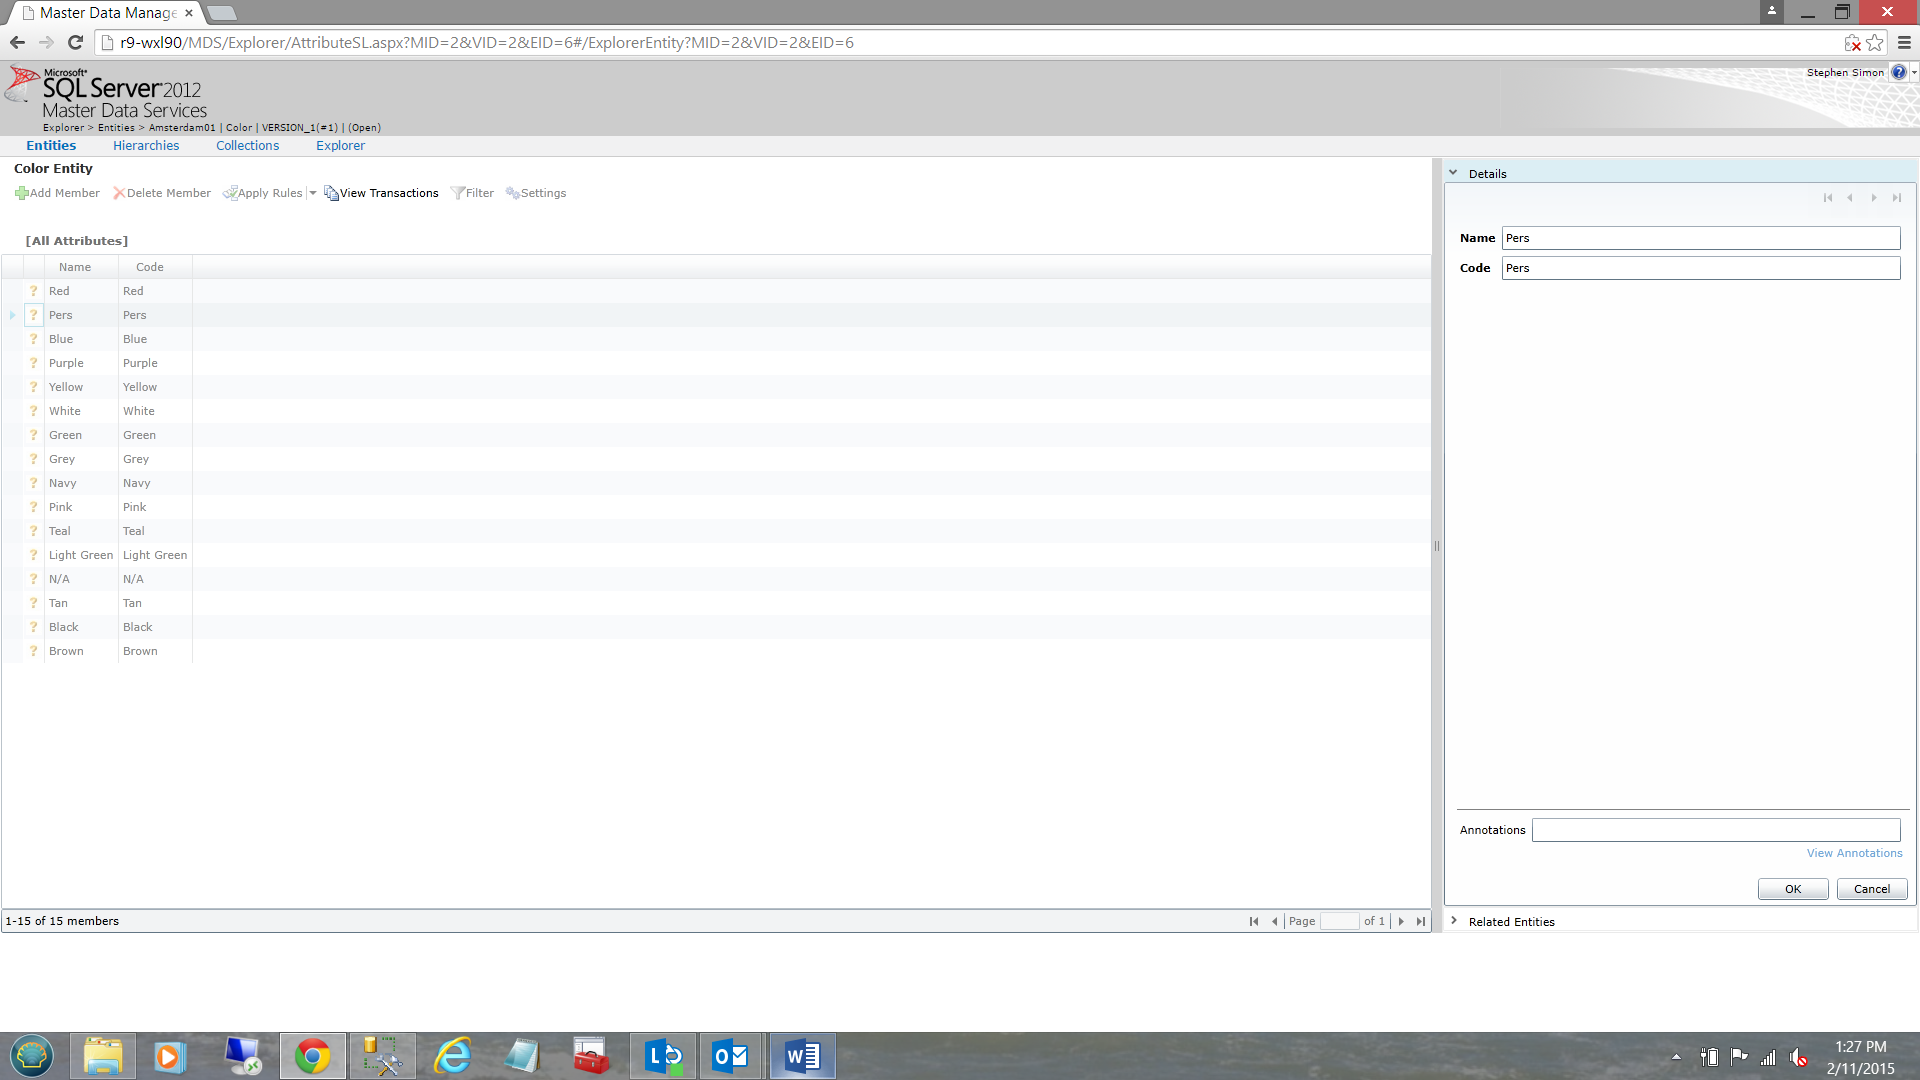
We enter “Pers” for the “Name” and for the “Code” of our “New Color”. Pers is the Dutch word for Purple. Whilst I have a purple, Pers will help me identify entries from our Dutch office. I click OK to accept the color addition.
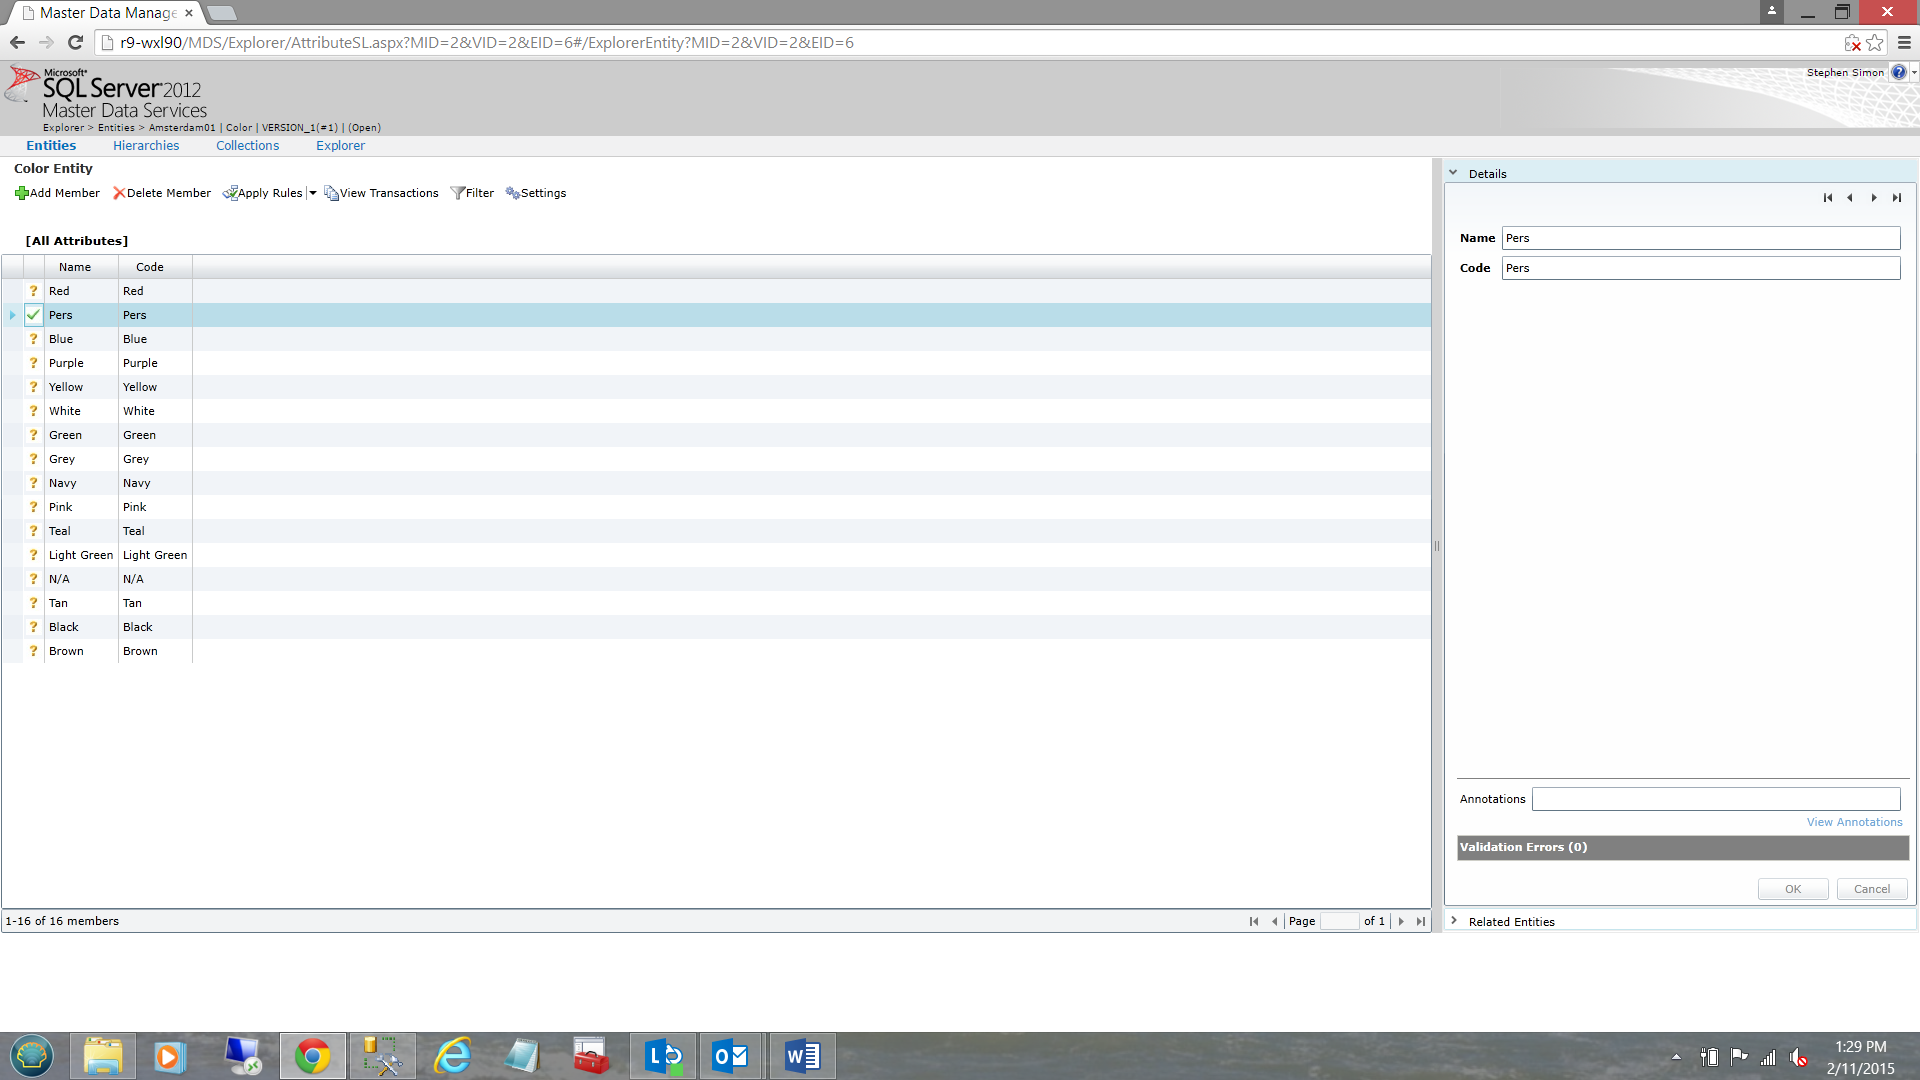
In the screen shot above, we note that our new color “Pers” has been added to the list of Colors that objects may be.
As with the “Color” entity, we can add members to the “Fabric” entity. Deleting or modifying entries requires some care as “orphaned products” are not permitted. This is common sense.
The Product Entity
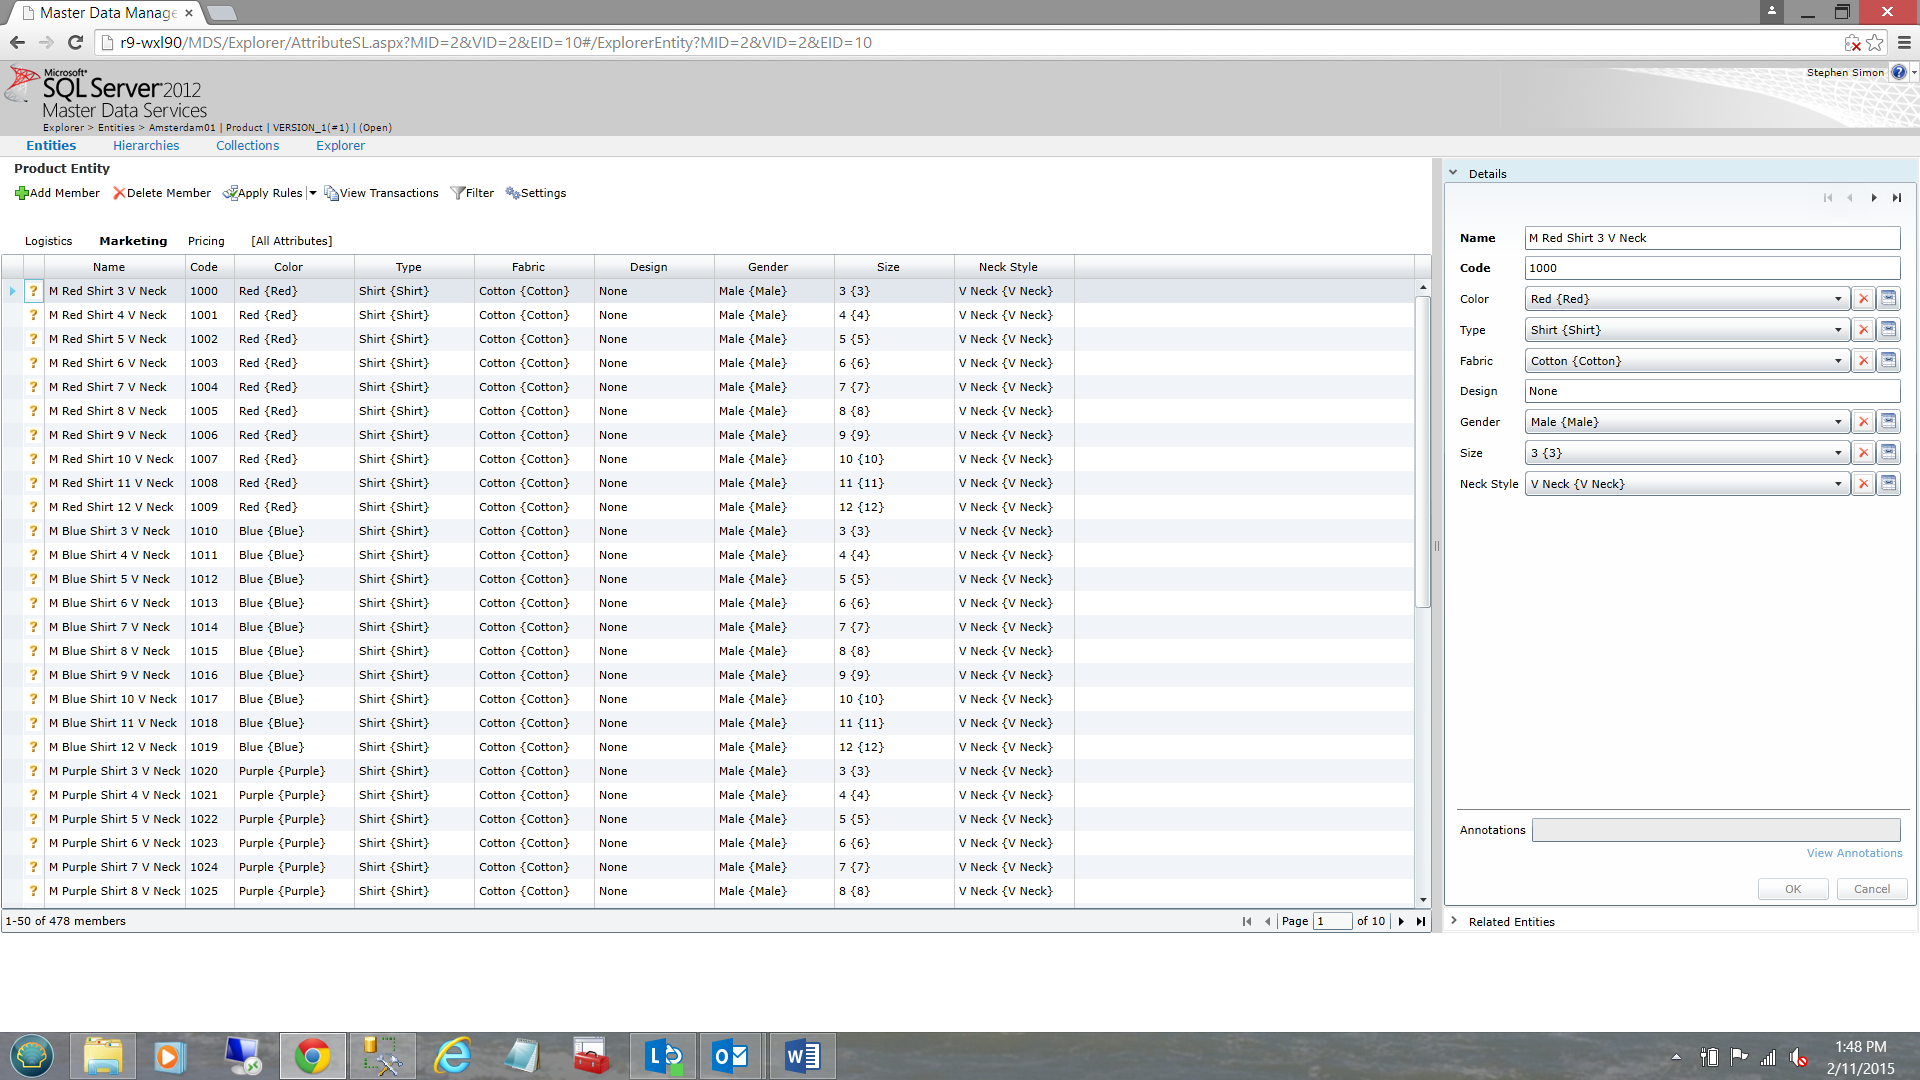
Opening the “Product” entity, we note that each member within the entity has a “Code” and a “Name” (see above). Note also that “Product” has been linked to the attribute “Pick lists” (Color, Fabric, Type etc.). Let us quickly look at how the attribute pick lists have been linked to the “Product” entity.
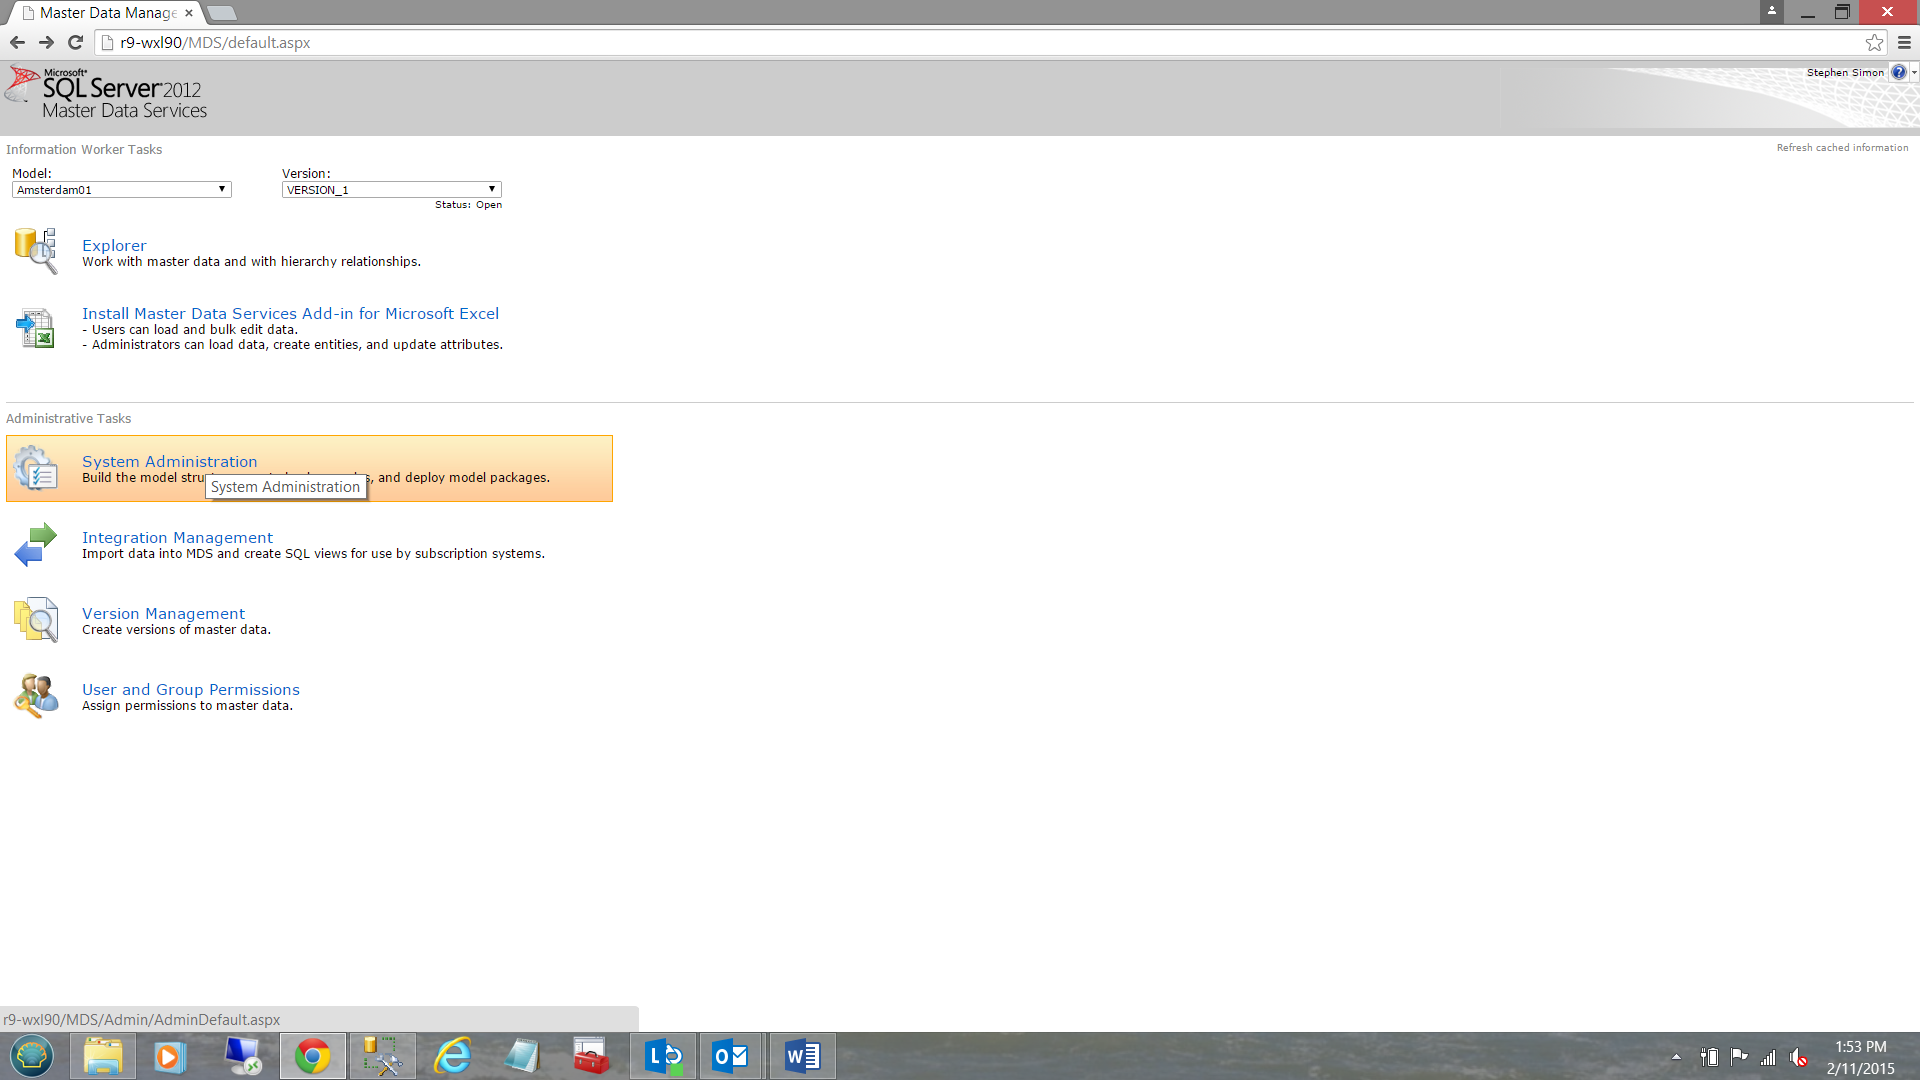
In order to see this we return to our main client screen by clicking on the SQL Server logo located at the top left portion of the client (see above). We click the “System Administration” tab (see above).
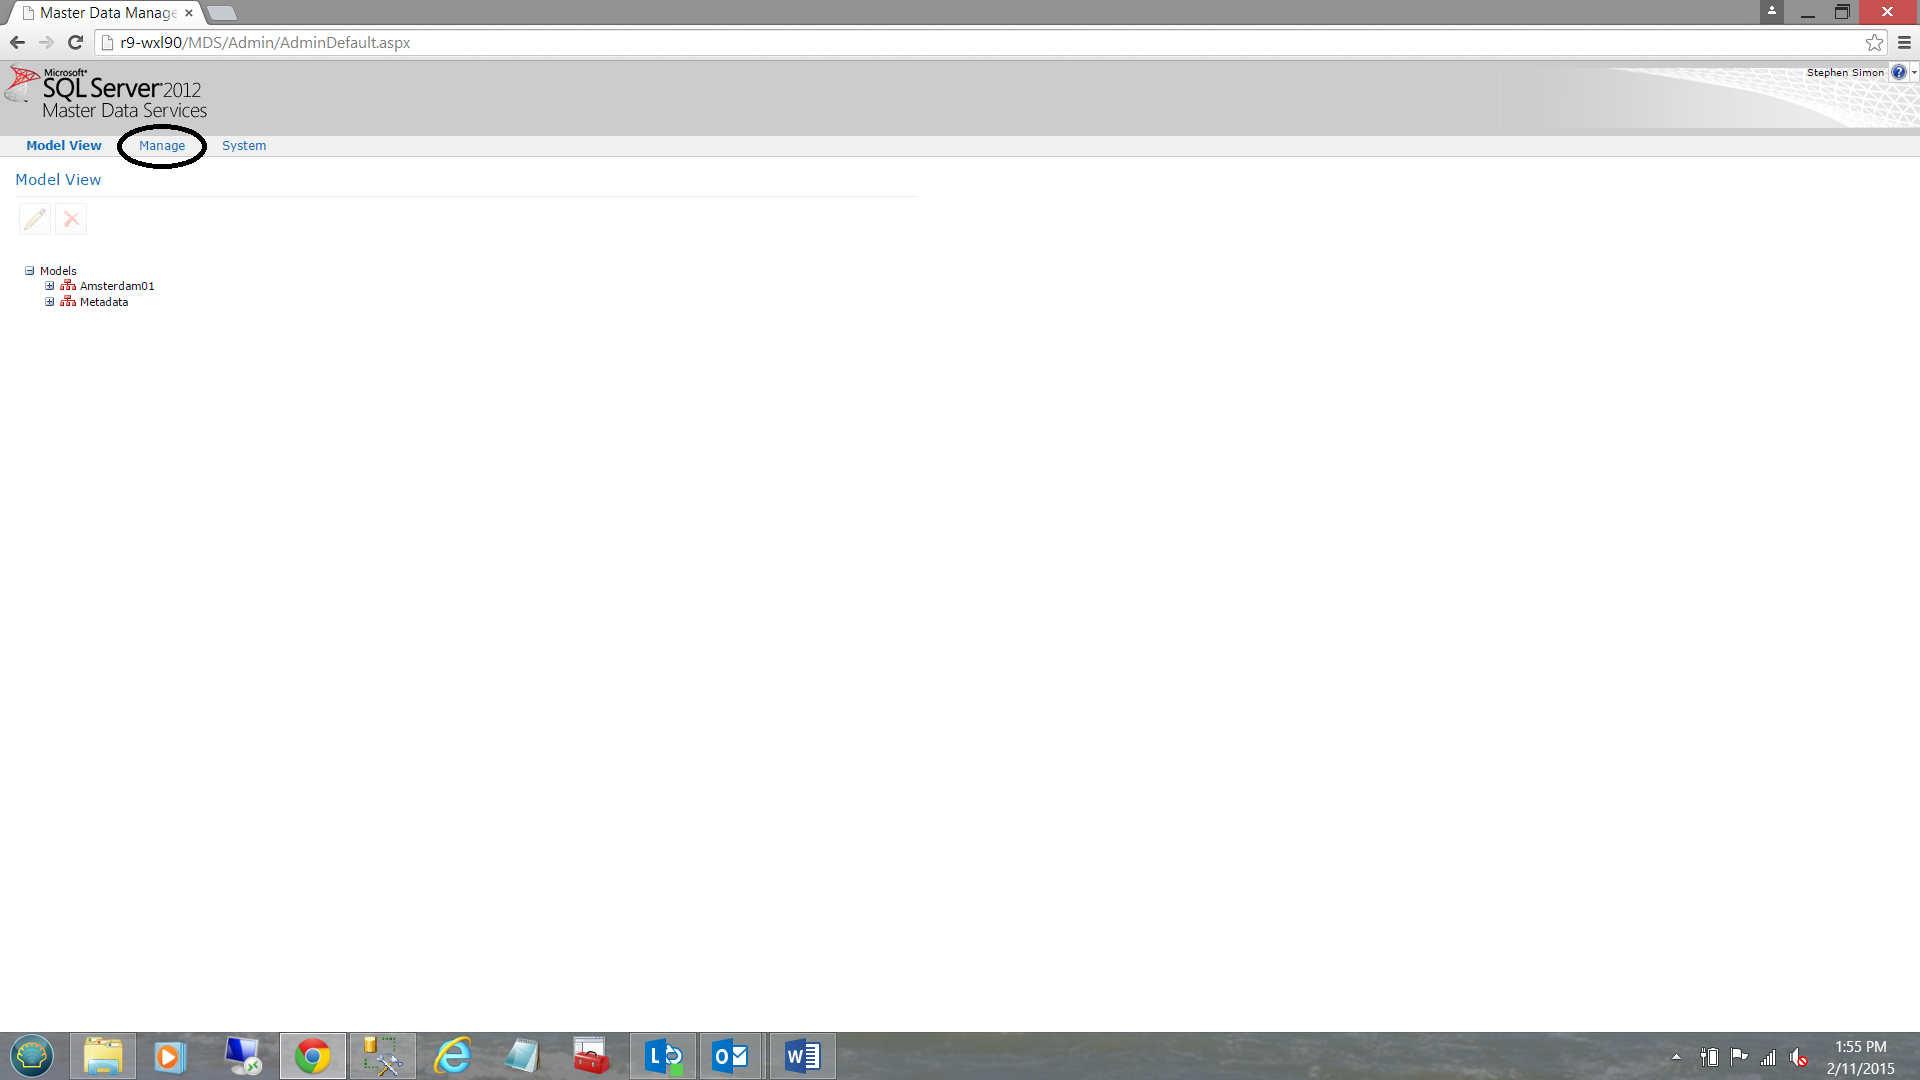
The “System Administration” main screen is brought into view. We click the “Manage” tab and select “Entities” (see below).
Our “Manage Entity” dialogue box opens.
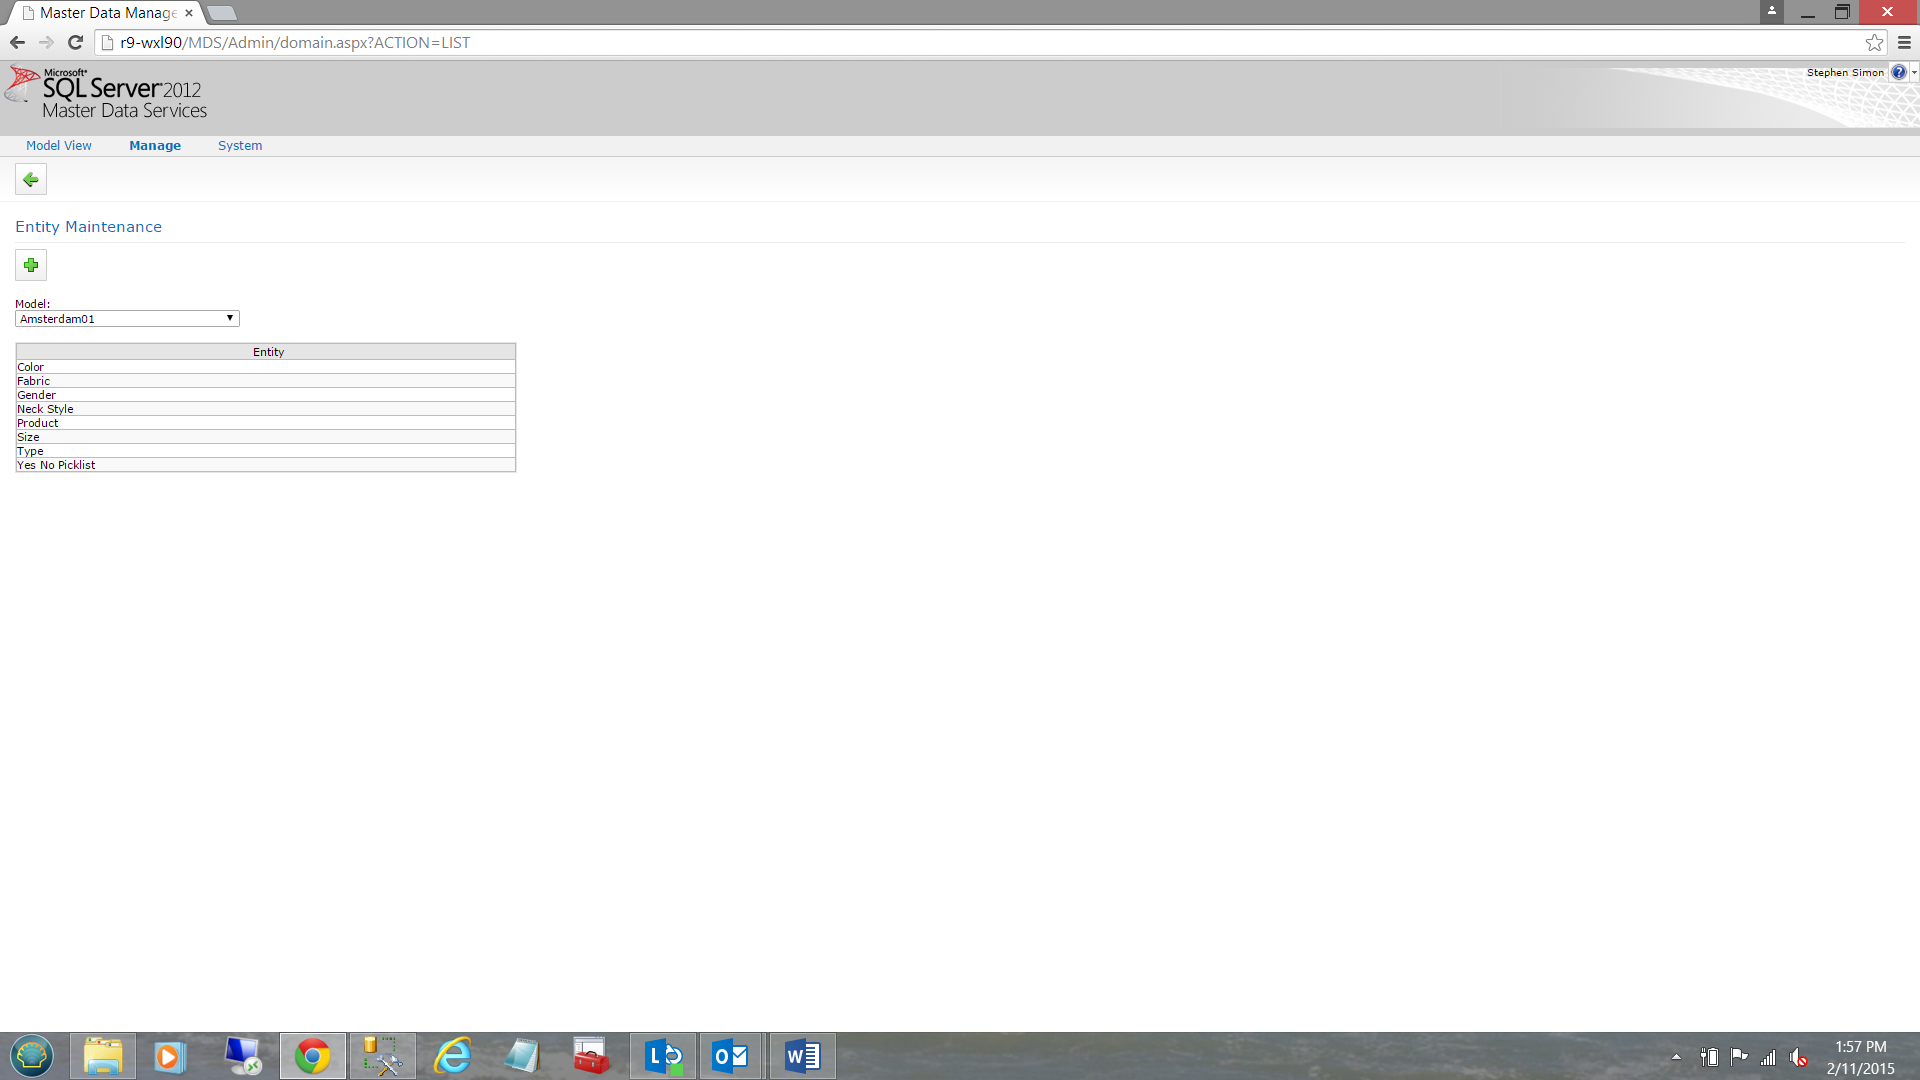
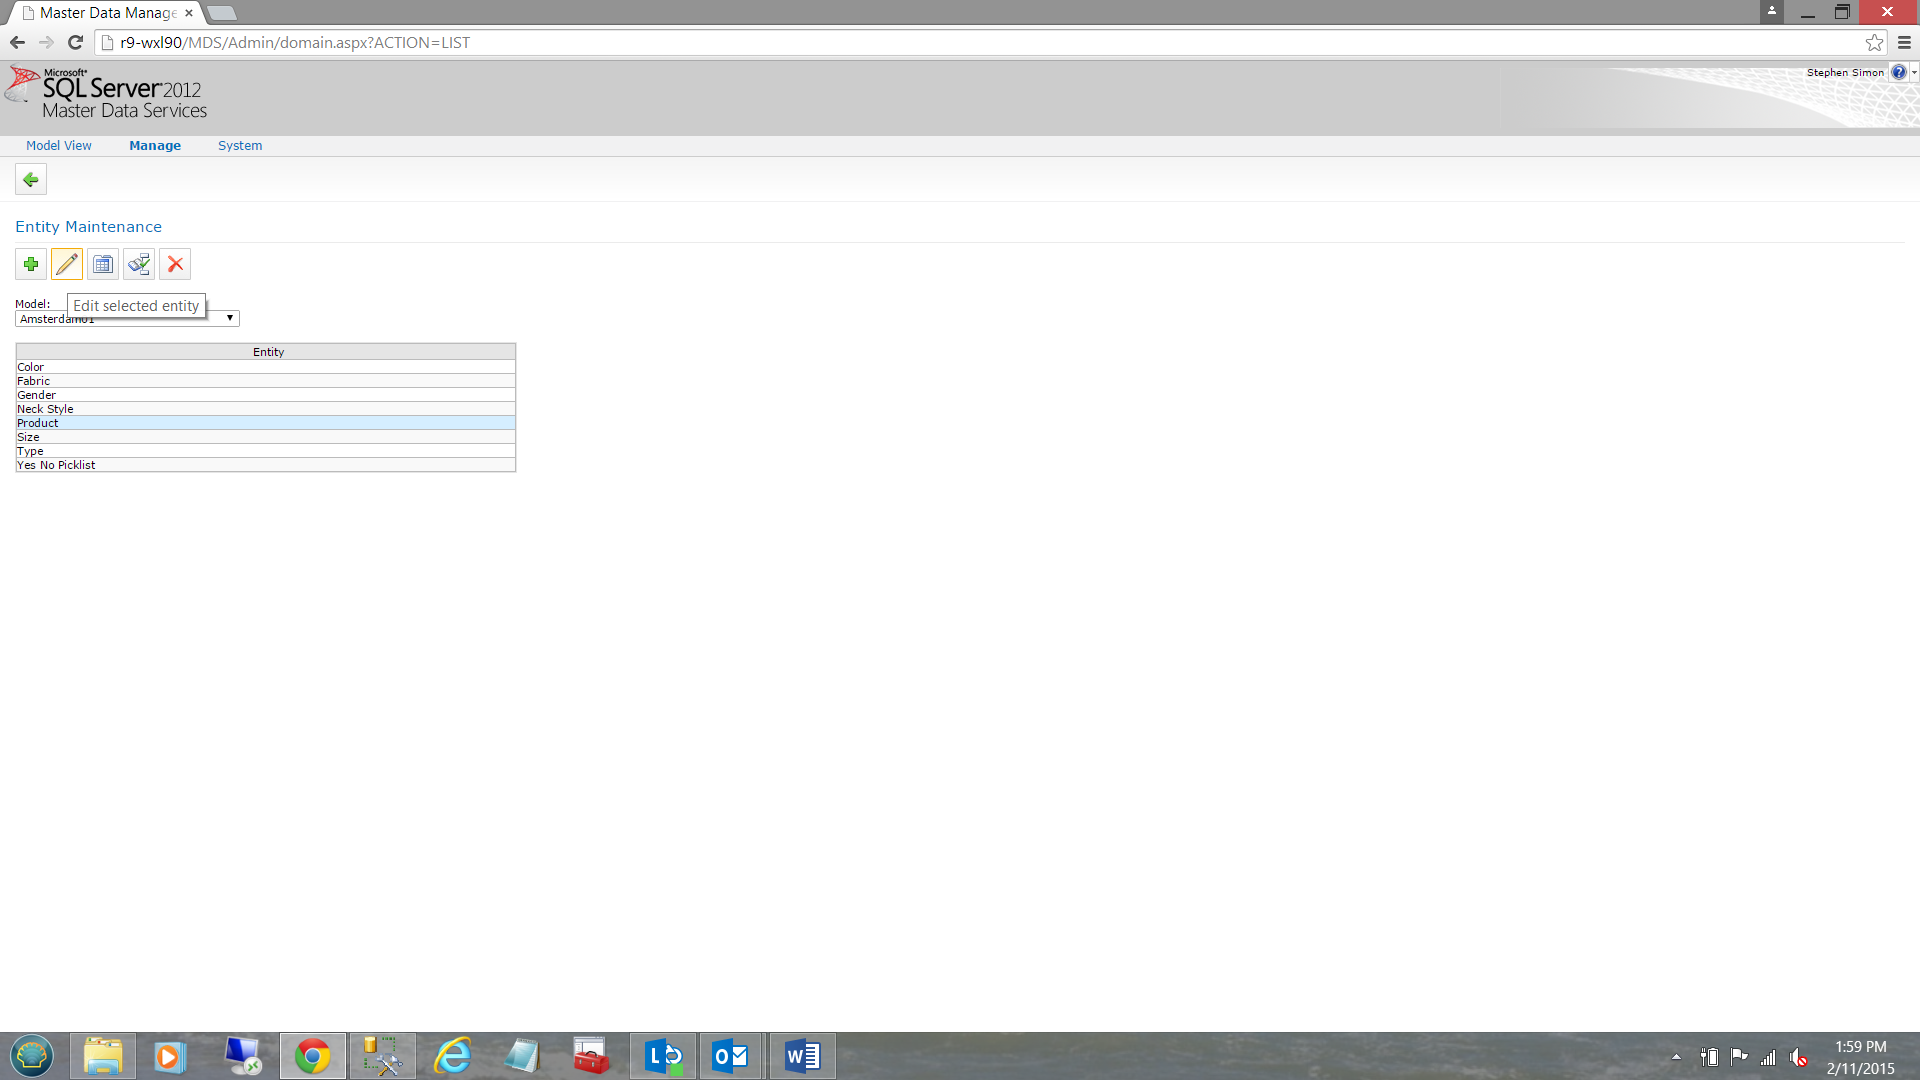
As we may see above, all of our entities are present. We are interested in having a peak at our main entity “Product”.
We click upon “Product” and select the pencil (see below).
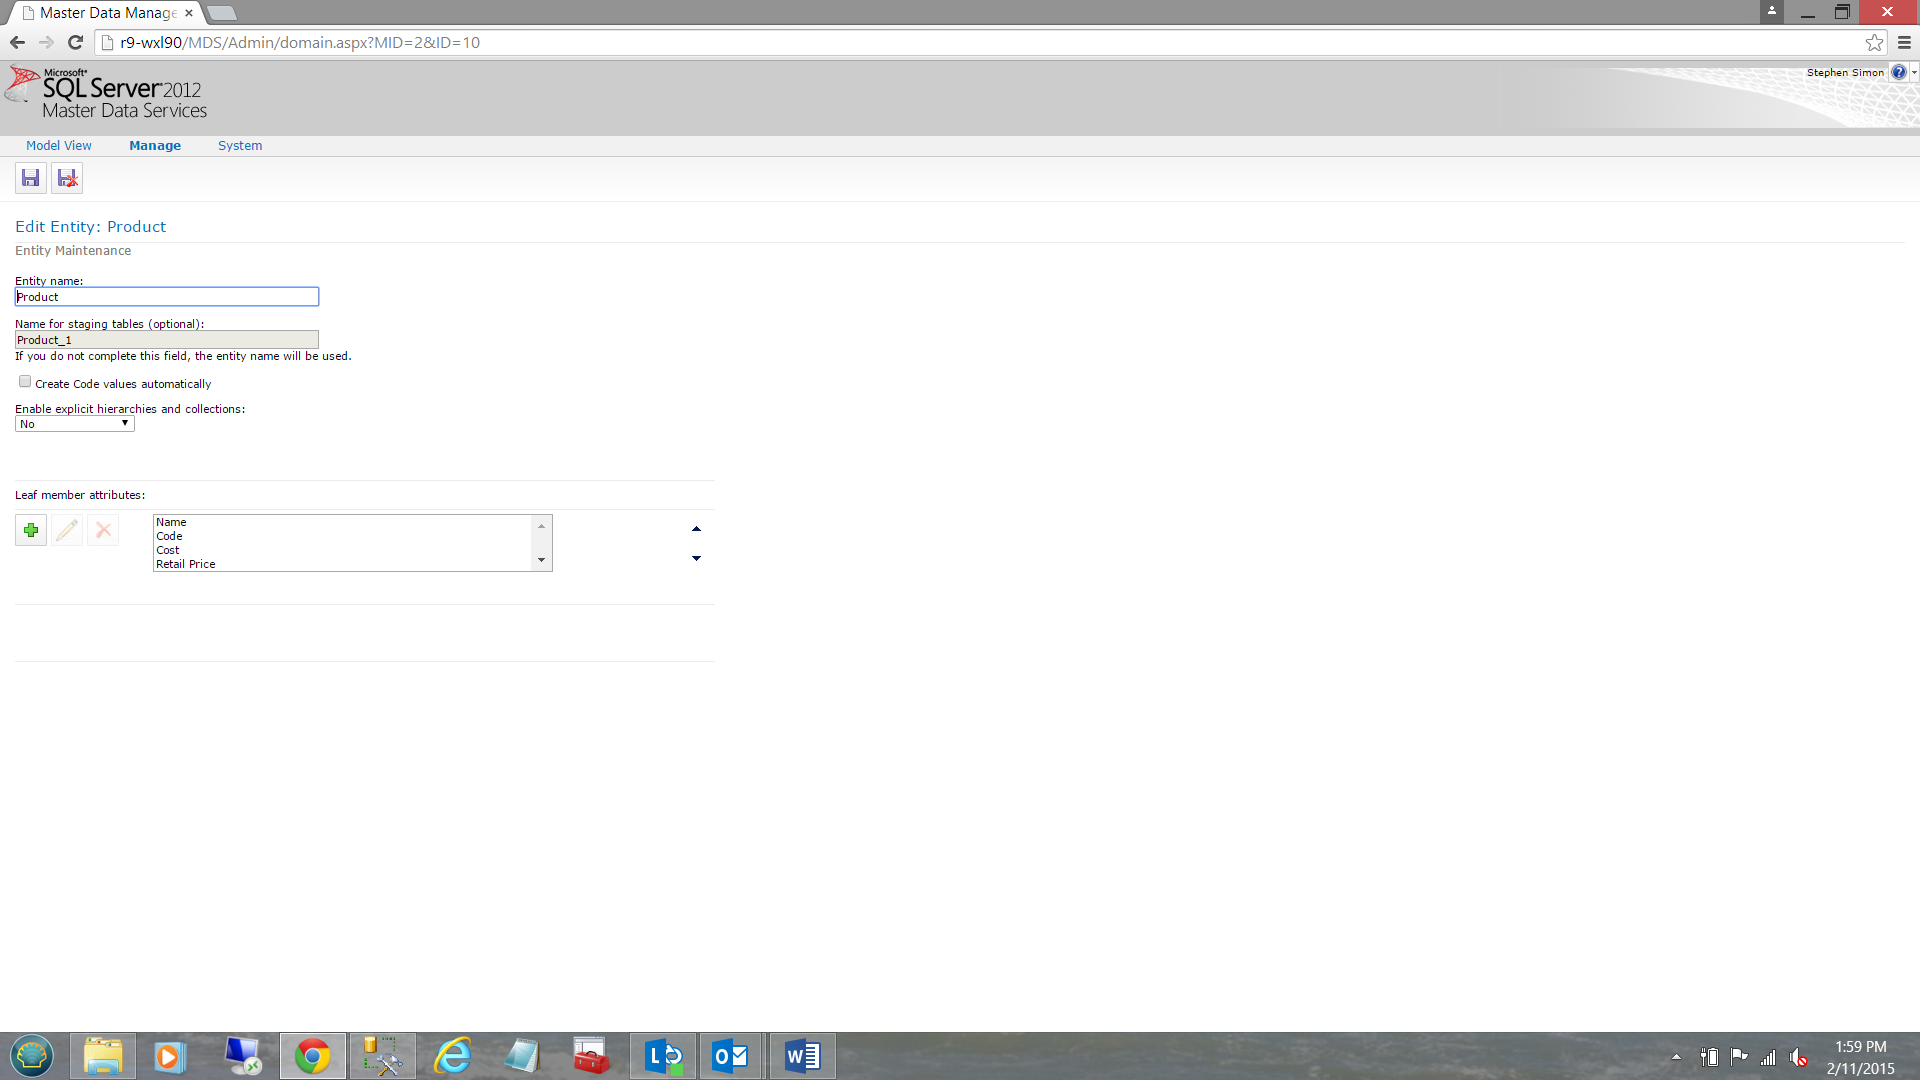
The “Product” entity dialogue box is opened and we shall have a quick look at the “Color” attribute.
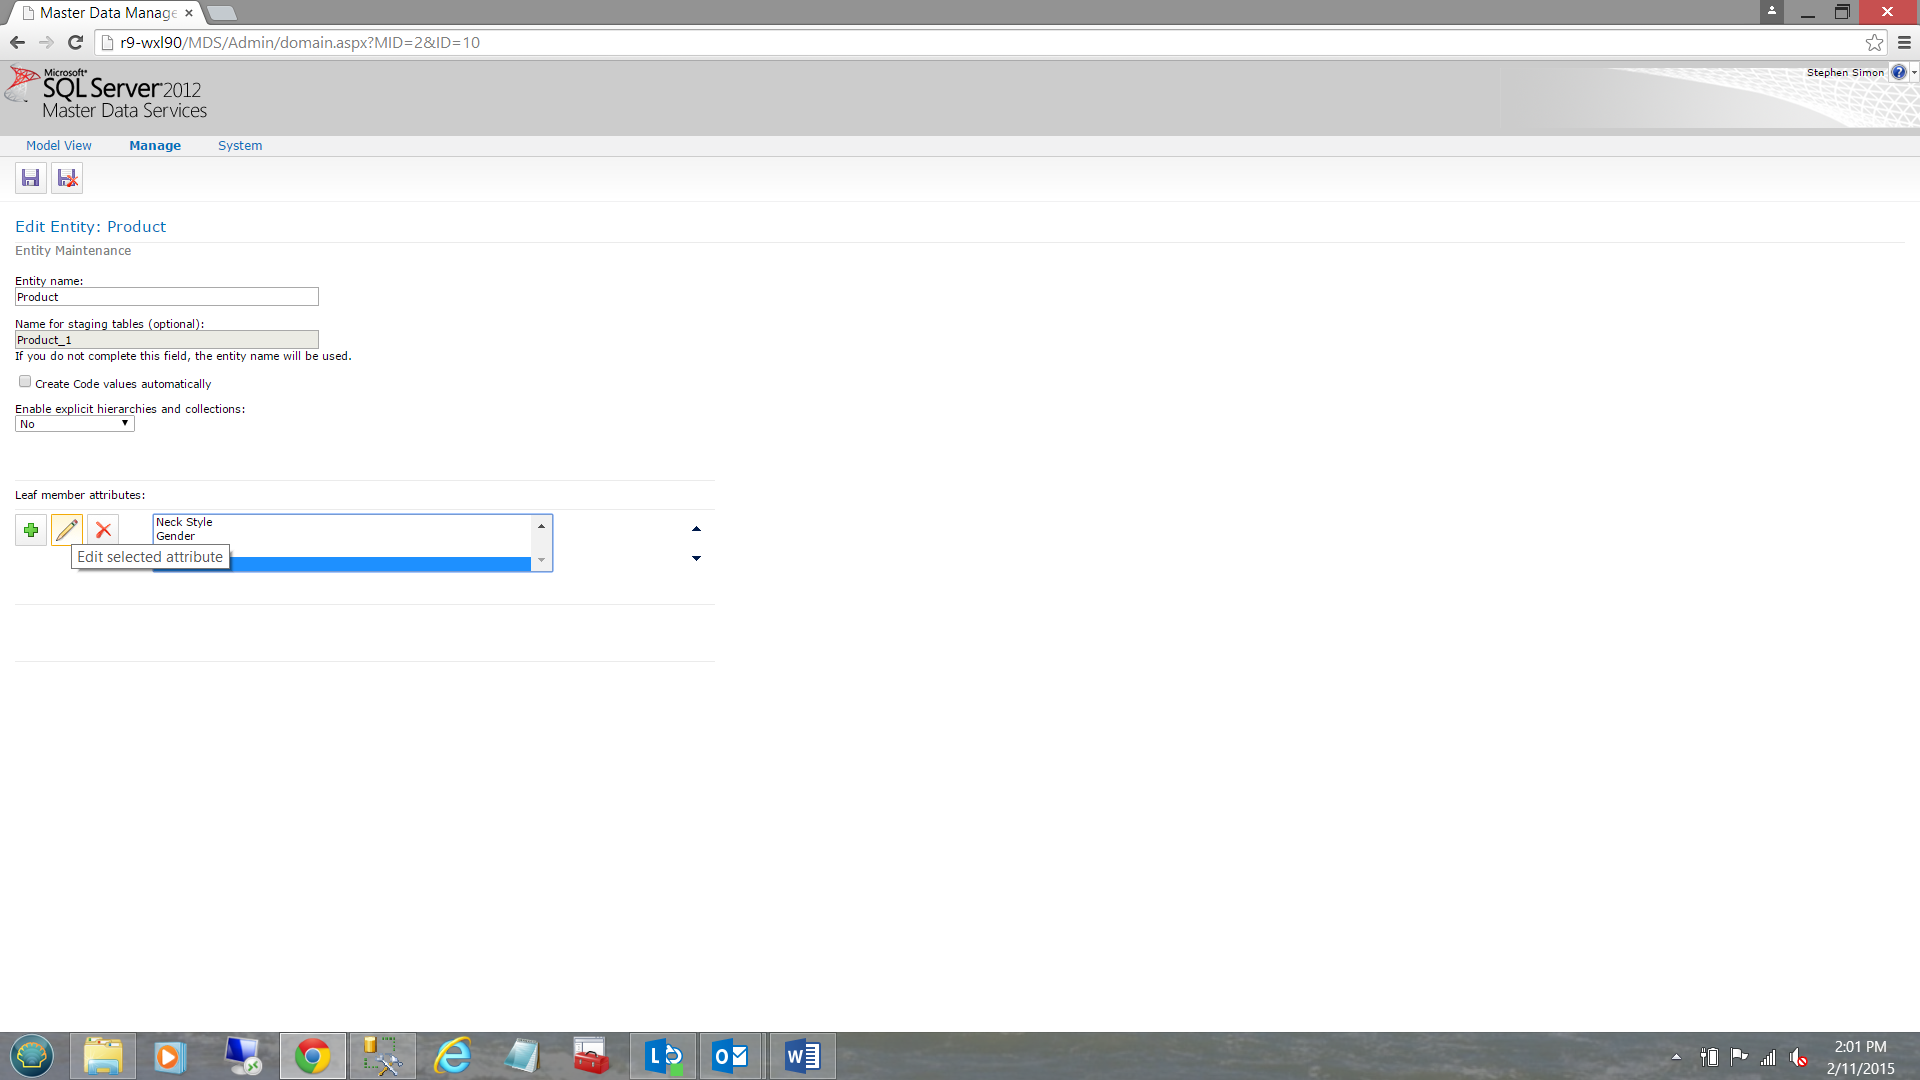
We highlight the “Color” entity (see above) and click the pencil.
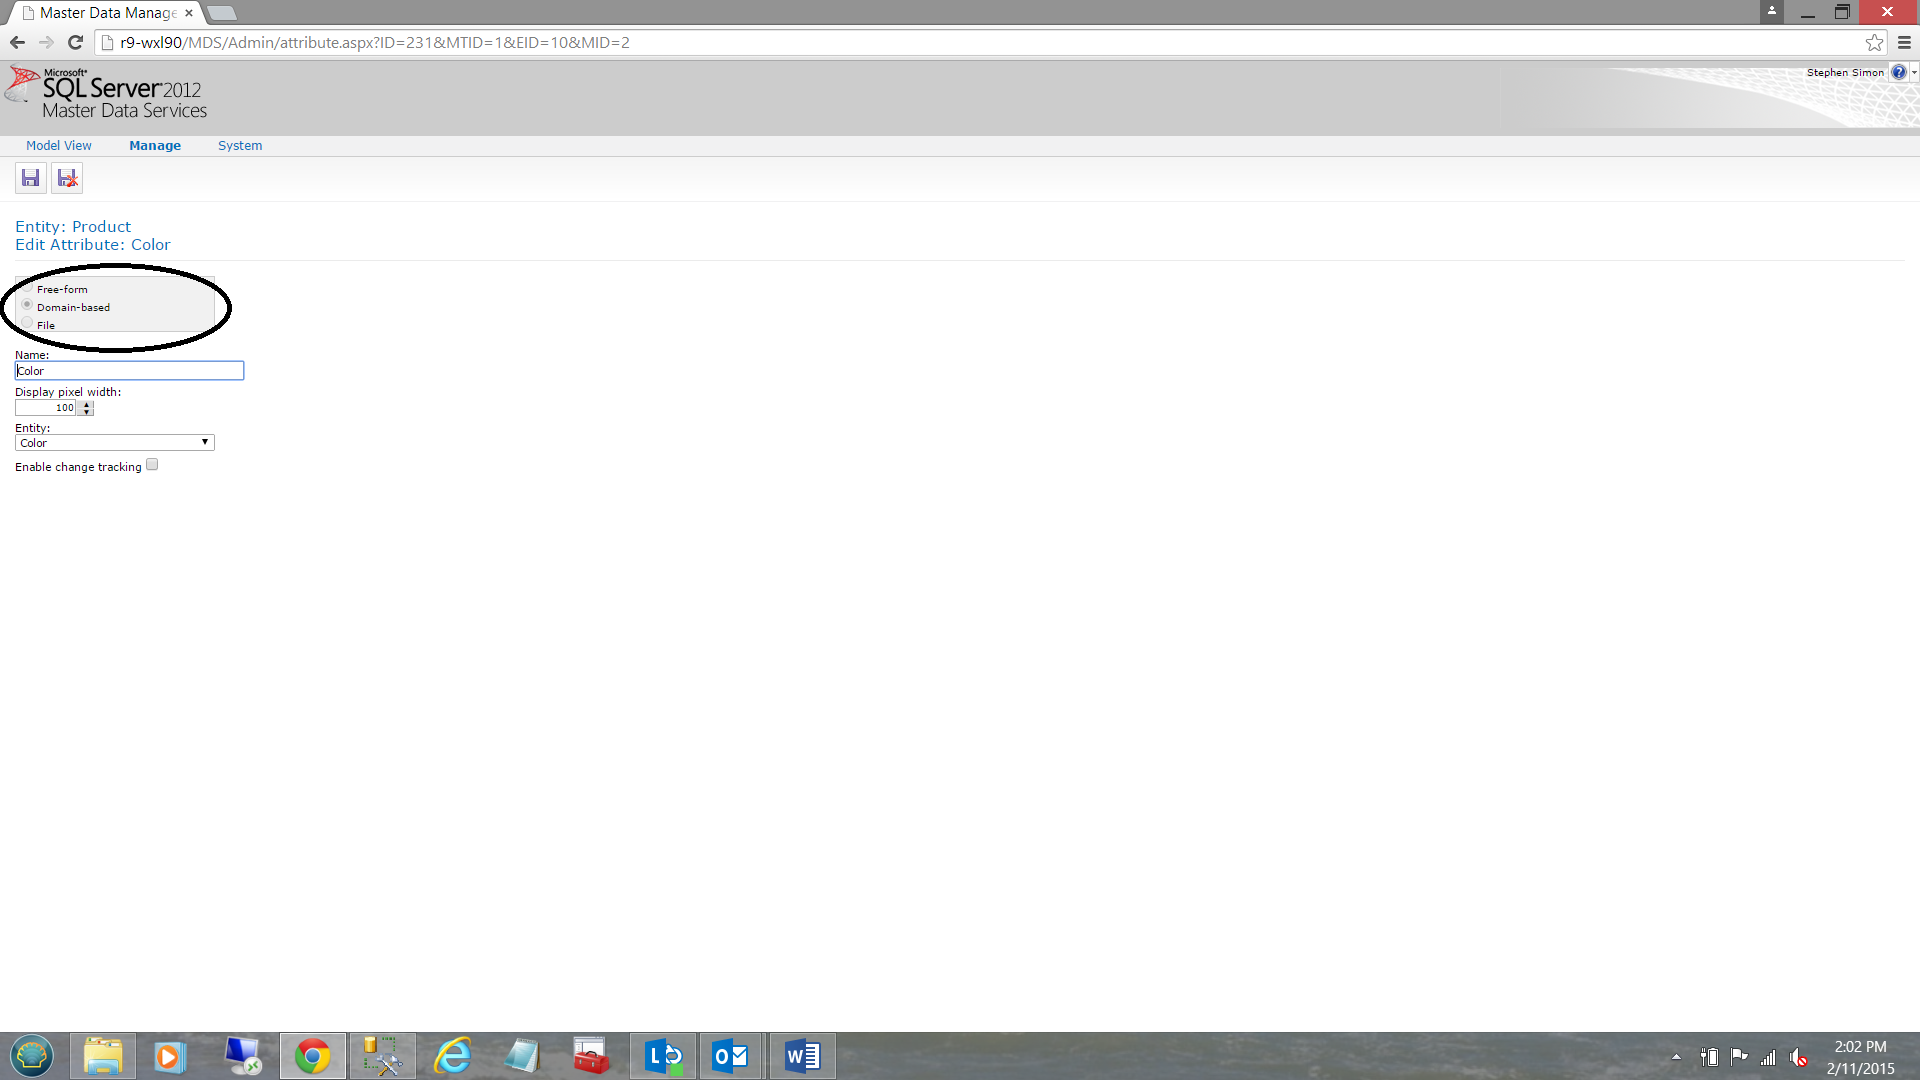
The attribute dialogue box opens. The reader will note that the source of the attribute data is “Domain based” (see above) which means that Color attribute (within the “Product” entity) is joined to another entity (our Color entity) by the “Code”. In data structure terms. The “Product” entity color code is the “key” and the corresponding color code within the “Color” entity is the “foreign key”. Any other “Product” related data that is NOT related to a satellite data entity would be classified a “Free form” entry. As a closing thought, the astute reader will realize that the “Domain based” entities must exist prior to being able to link them to the “Product” entity.
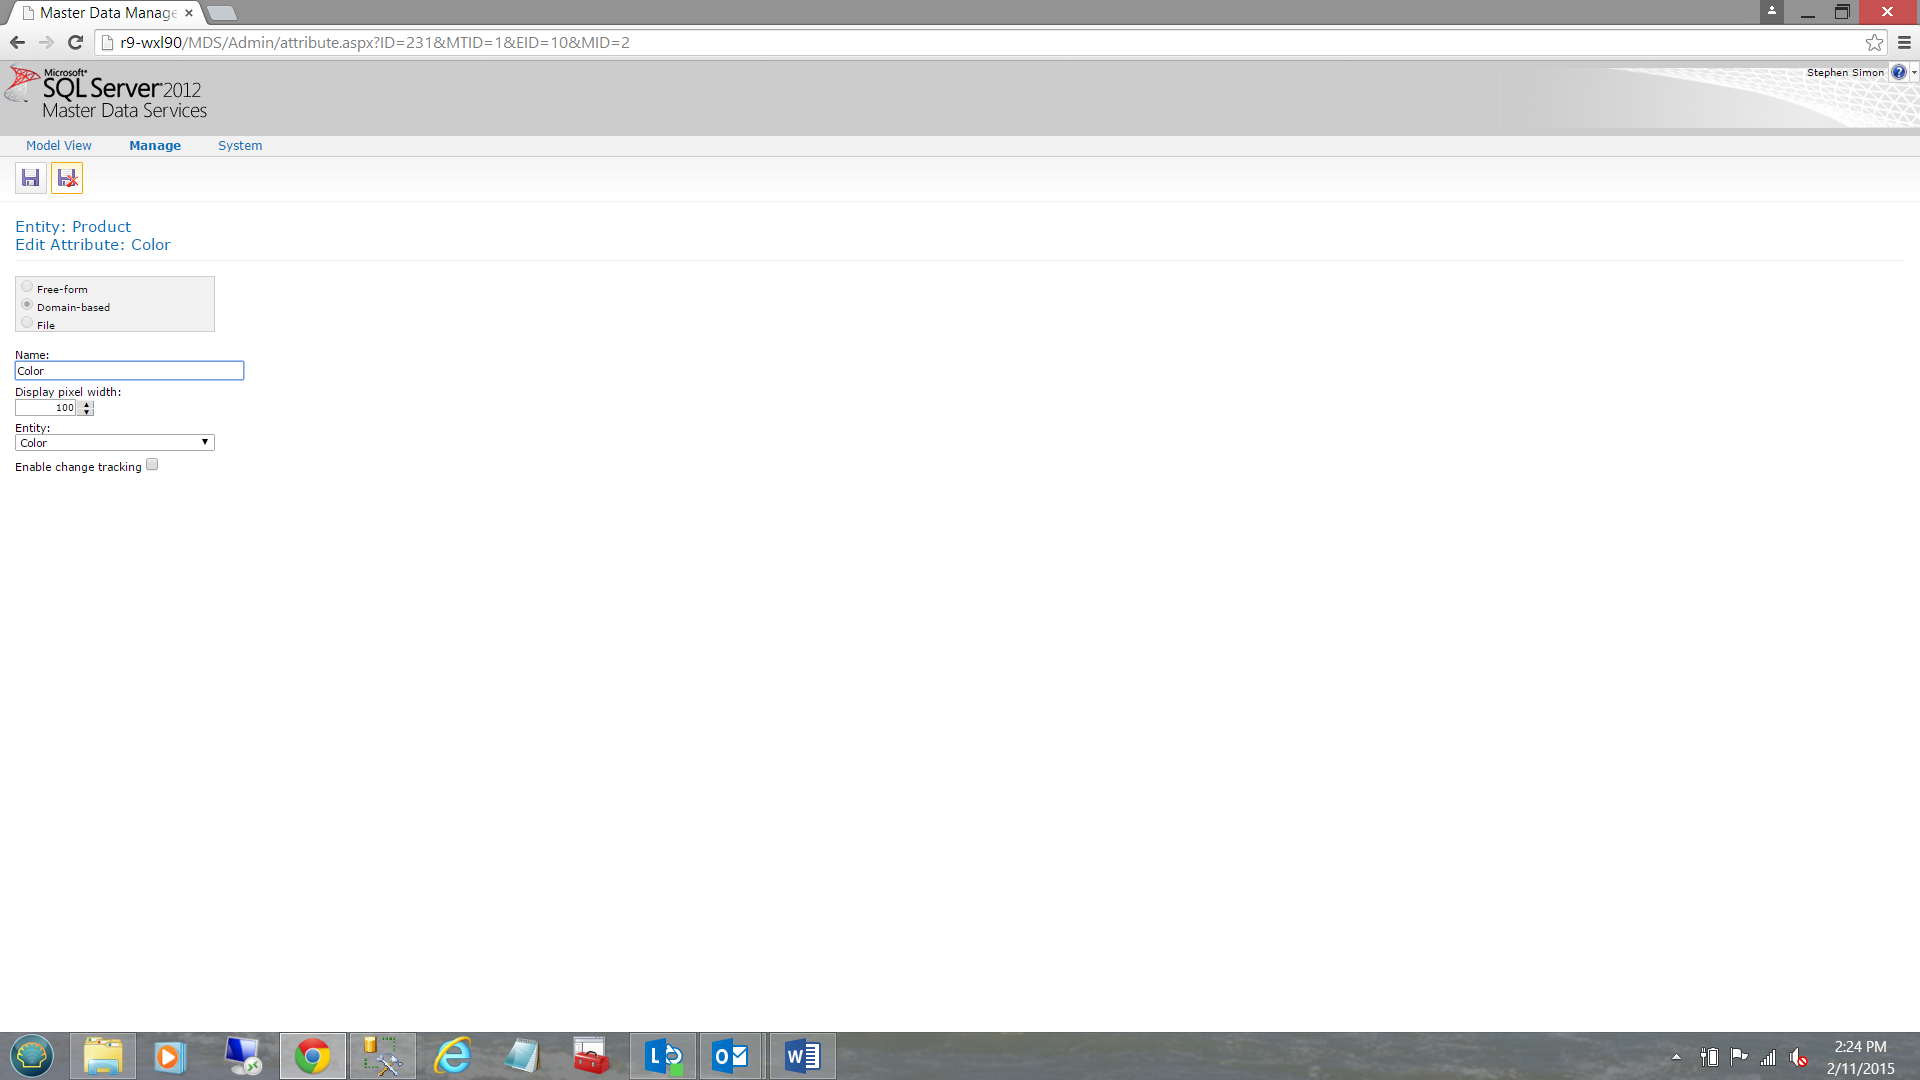
Now that we understand how our “Satellite” entities are linked to the “Mommy” (Product), we are ready to leave the guts of the “Product” entity. We click the “diskette” with the red “x” located at the top left portion of the screen shot above to “exit without saving”(see above).
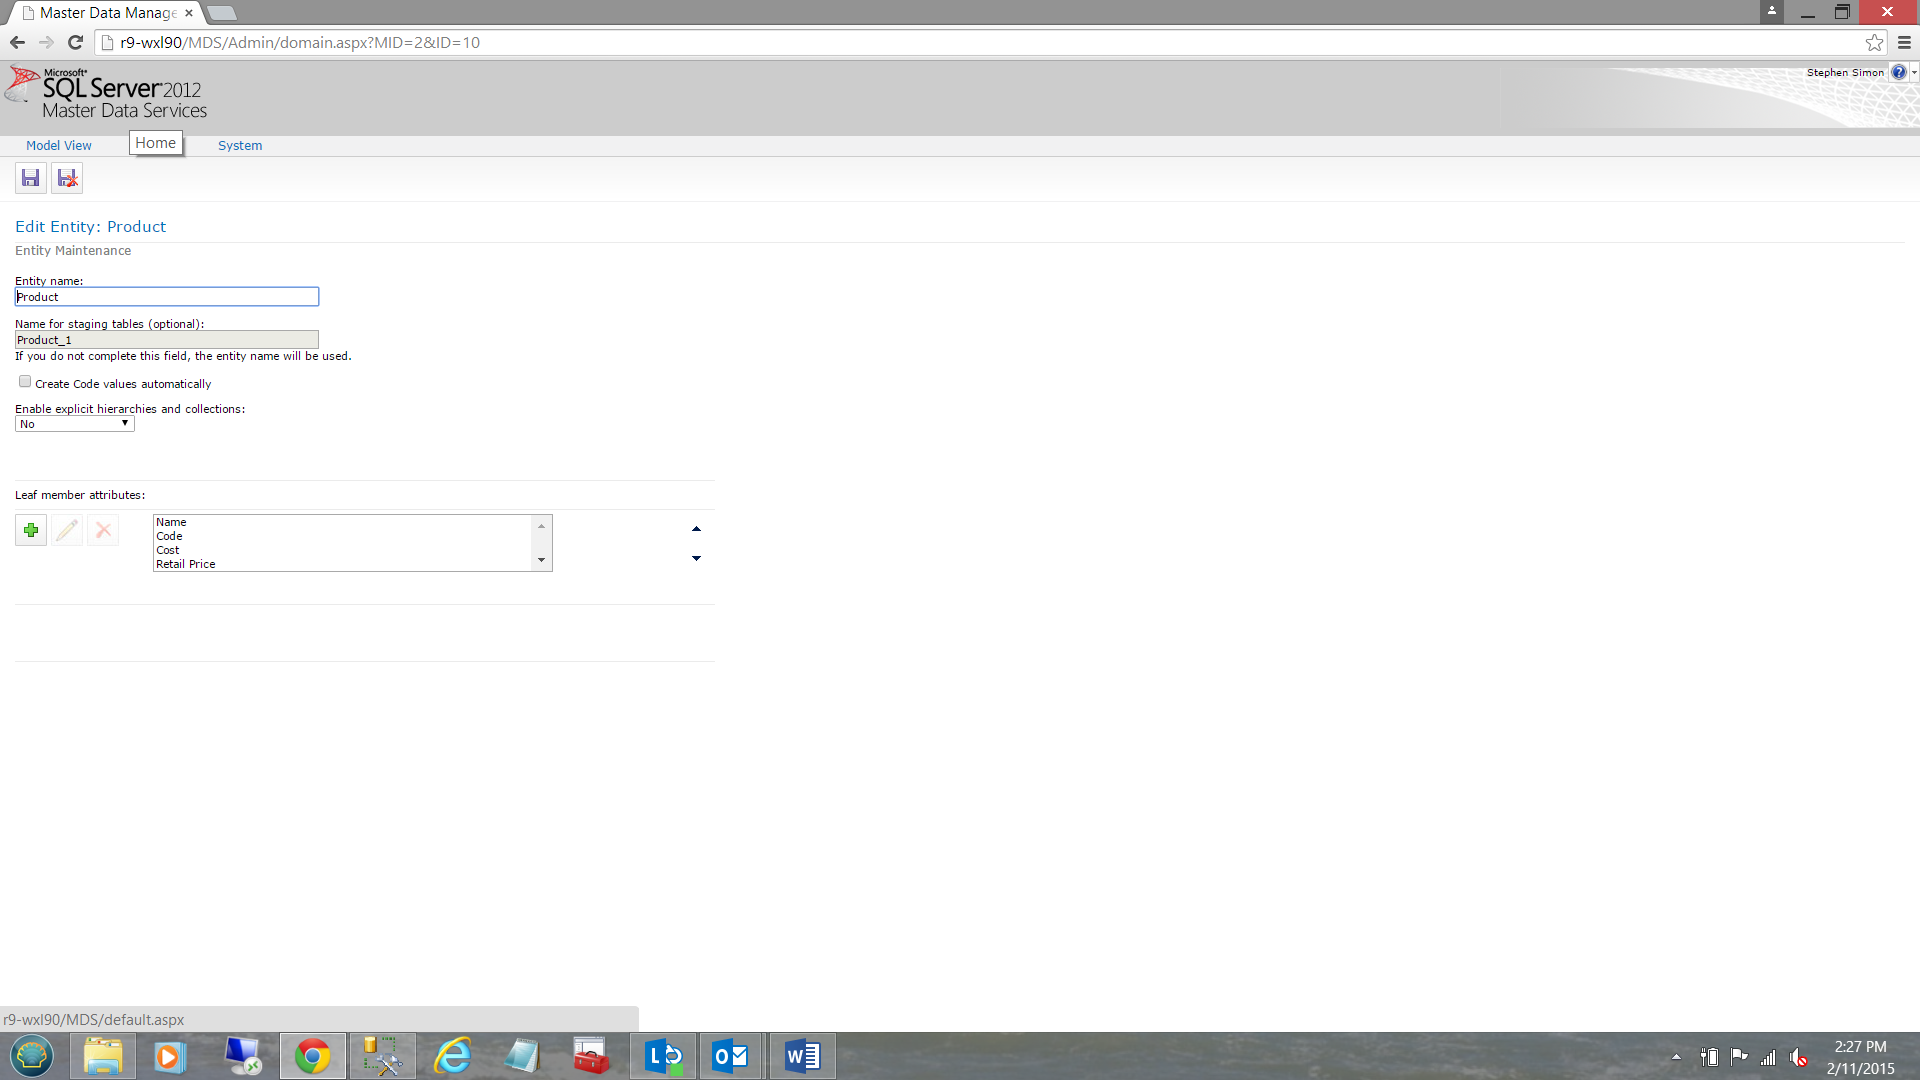
We click the SQL Server logo to go “Home”
Exploring the Product entity
Once again we go into “Explorer” but this time we really want to have look at our main entity “Product” (see below).
Once again we shall “Add” a new member HOWEVER this time it will be to the “Product” entity.
We click the “Add member” button (see the screen shot above).
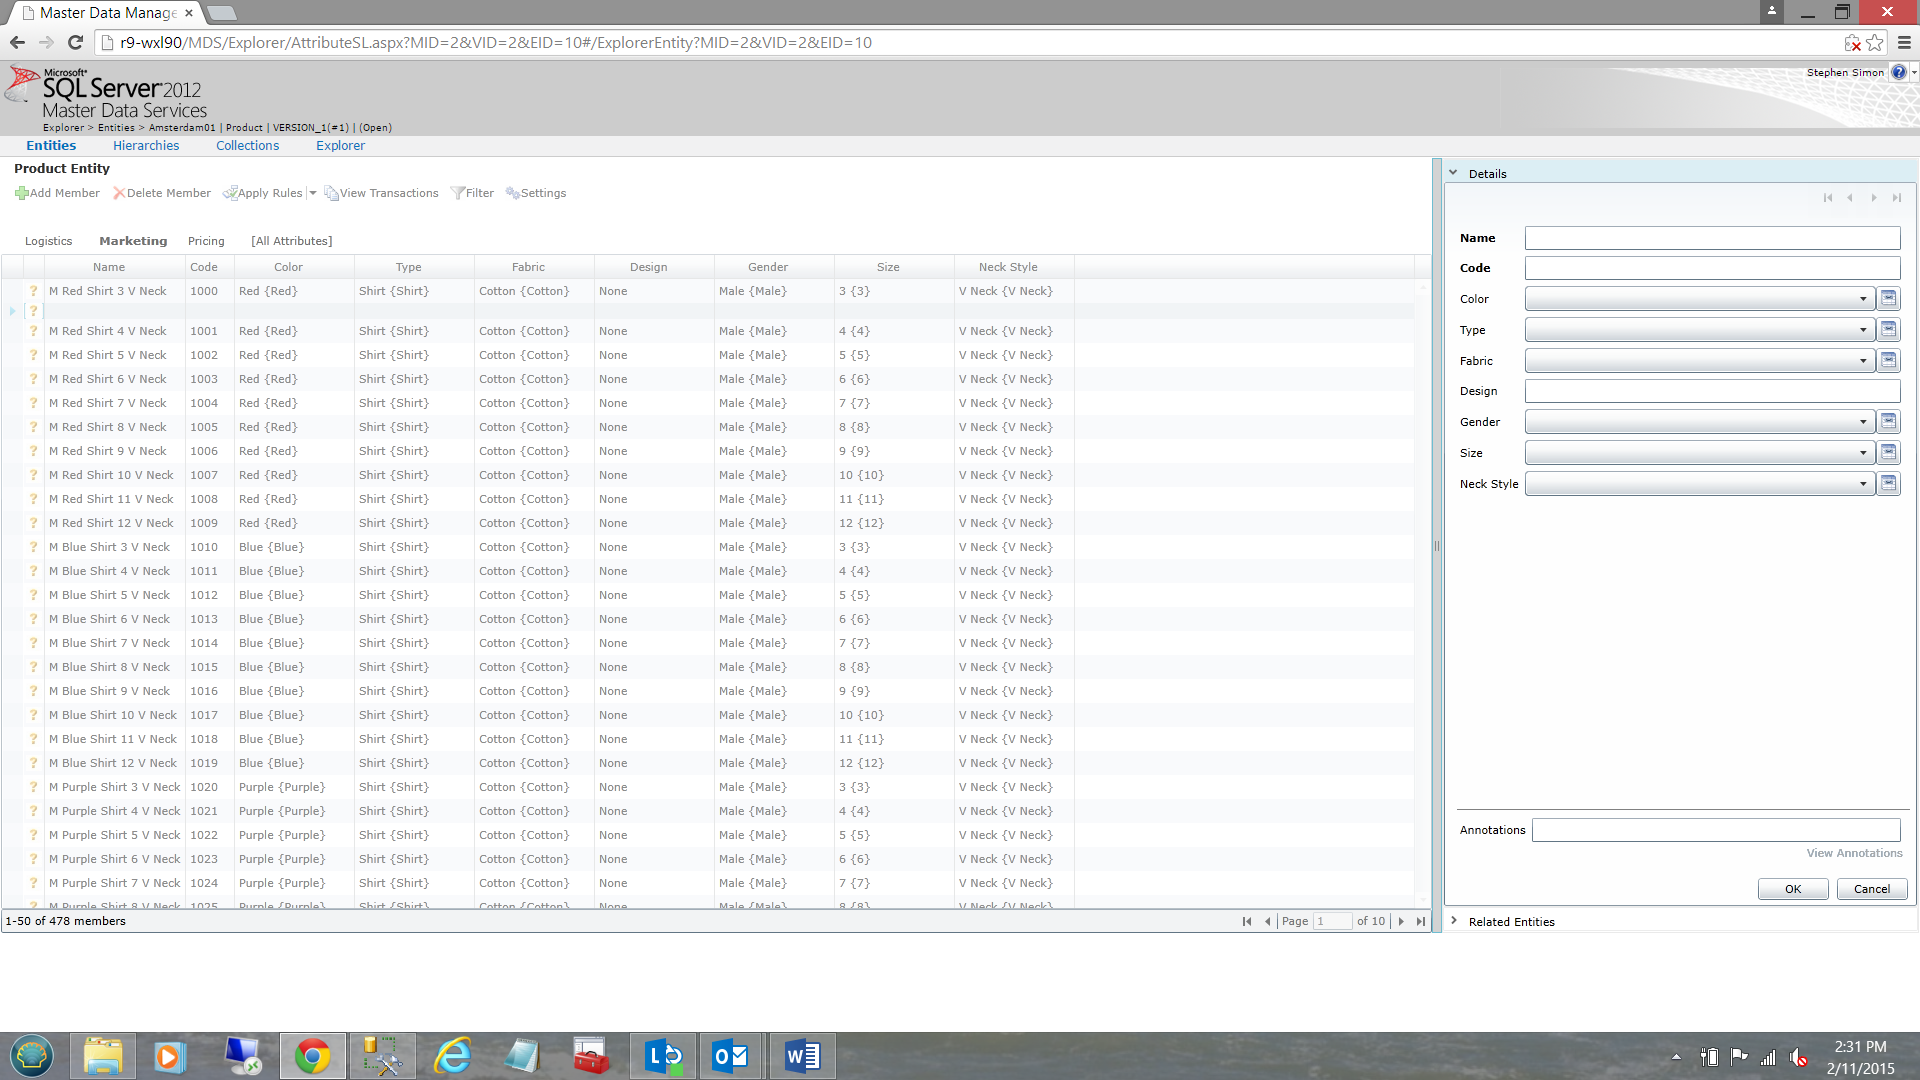
A “New Member” dialogue screen is shown in the right portion of the screen dump shown above.
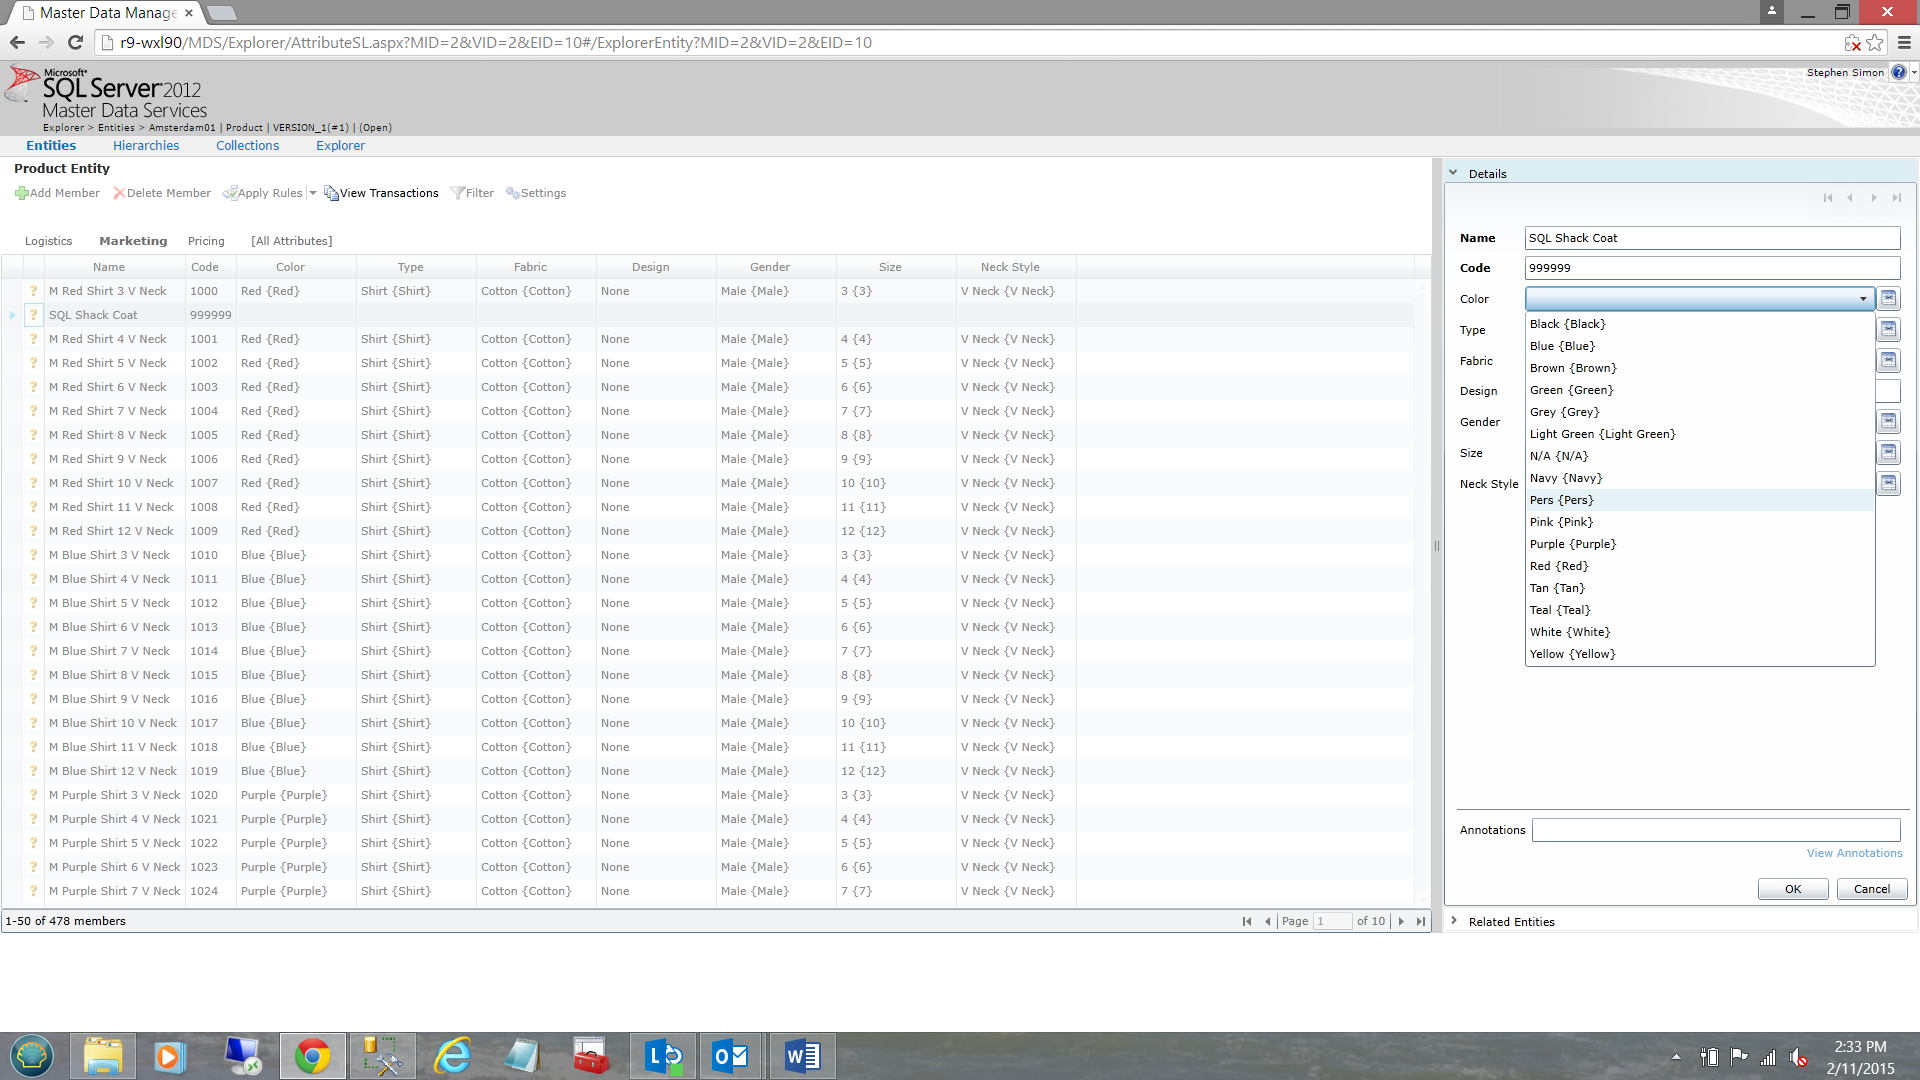
We are going to enter a “SQL Shack Coat” as the “Name” and ‘999999’ as the code. Under normal circumstances, entities are set up to utilize an “identity” for the code. This avoids having to track the “last number used”. We also set the “Color” to “Pers” (as seen above).
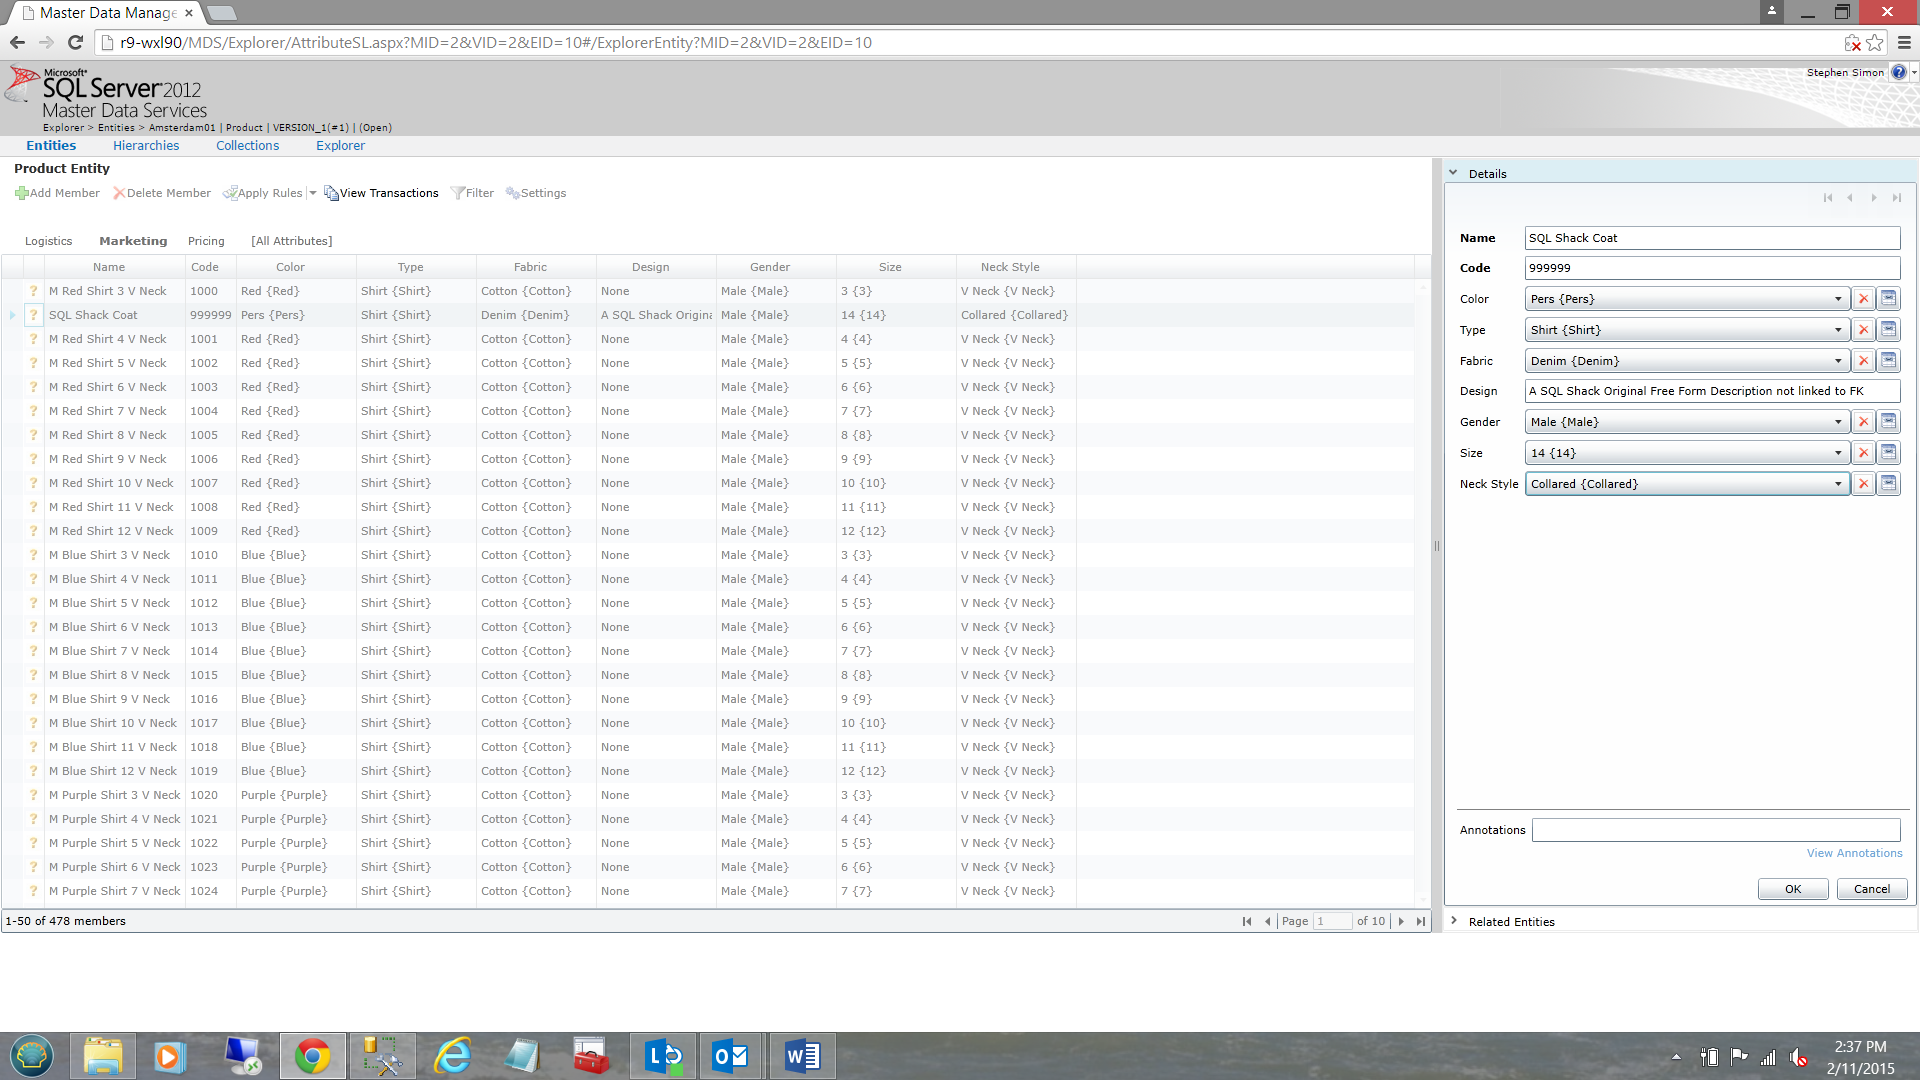
I have taken the liberty of completing the new product member utilizing the remaining “Pick” list. We also note that “Design” field is a free form field which I have also completed. We click OK to complete the data entry.
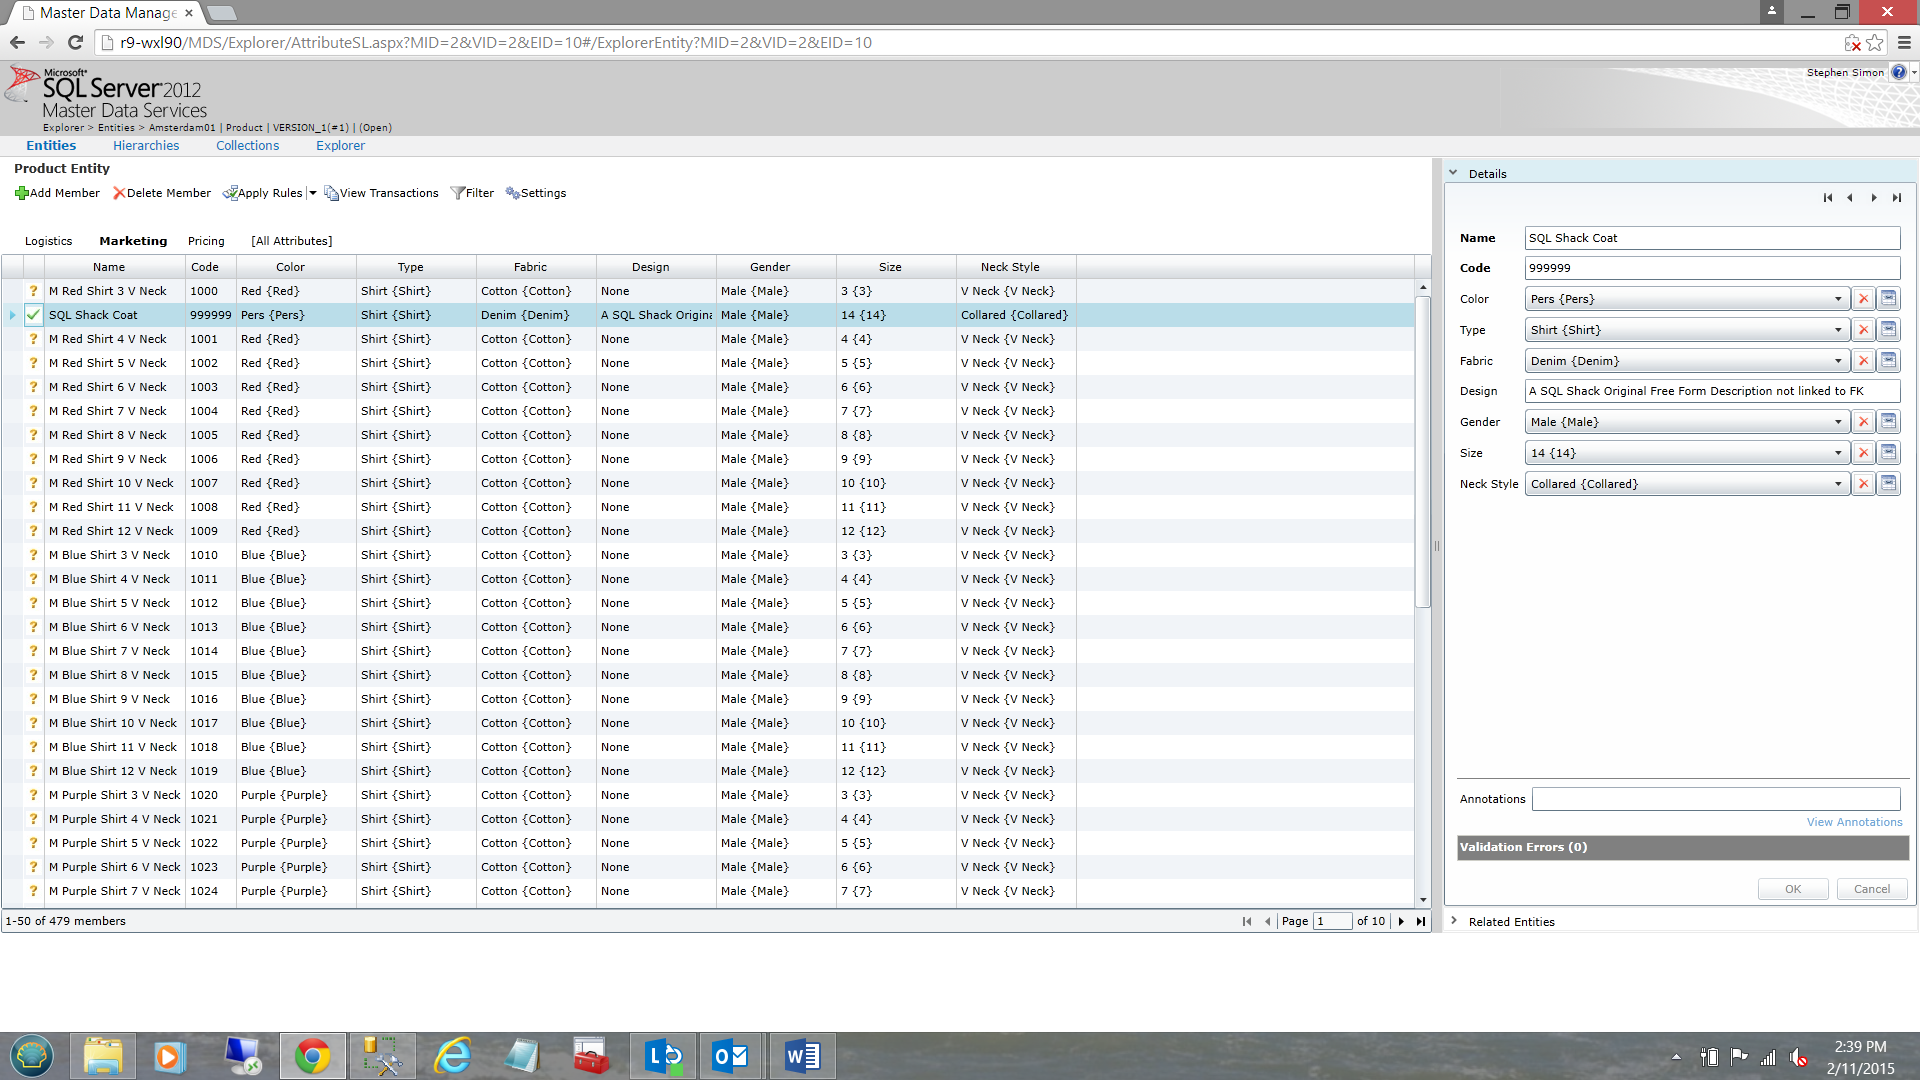
Back at our main “Product” entity screen, we see that our new record have been added. Wait a minute, we may have created a bad data entry. SQL Shack Coats come solely in “Purple”. We must fix this record!
Modifying an existing member
Clicking upon our “SQL Shack Coat” product, we note that the attribute values are visible on the right hand side.
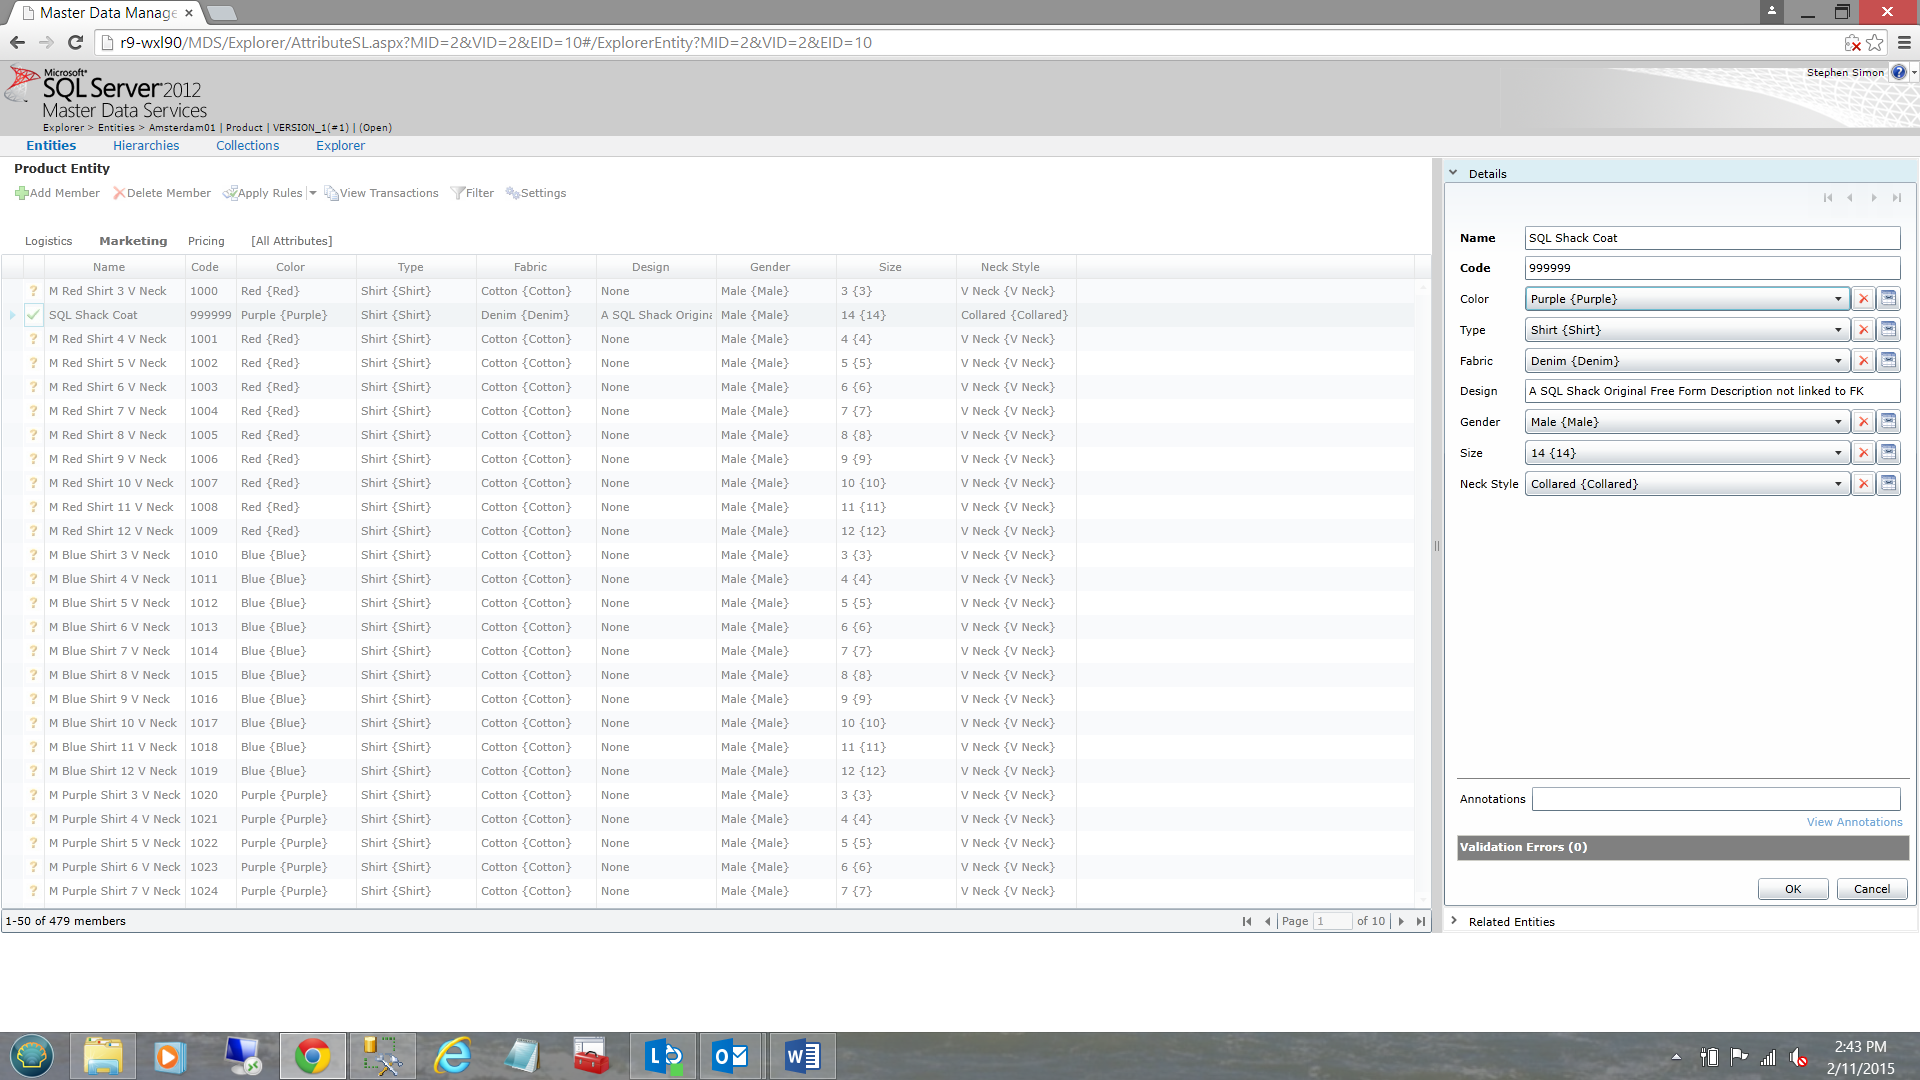
We change the “Color” from “Pers” to “Purple” and click “OK”.
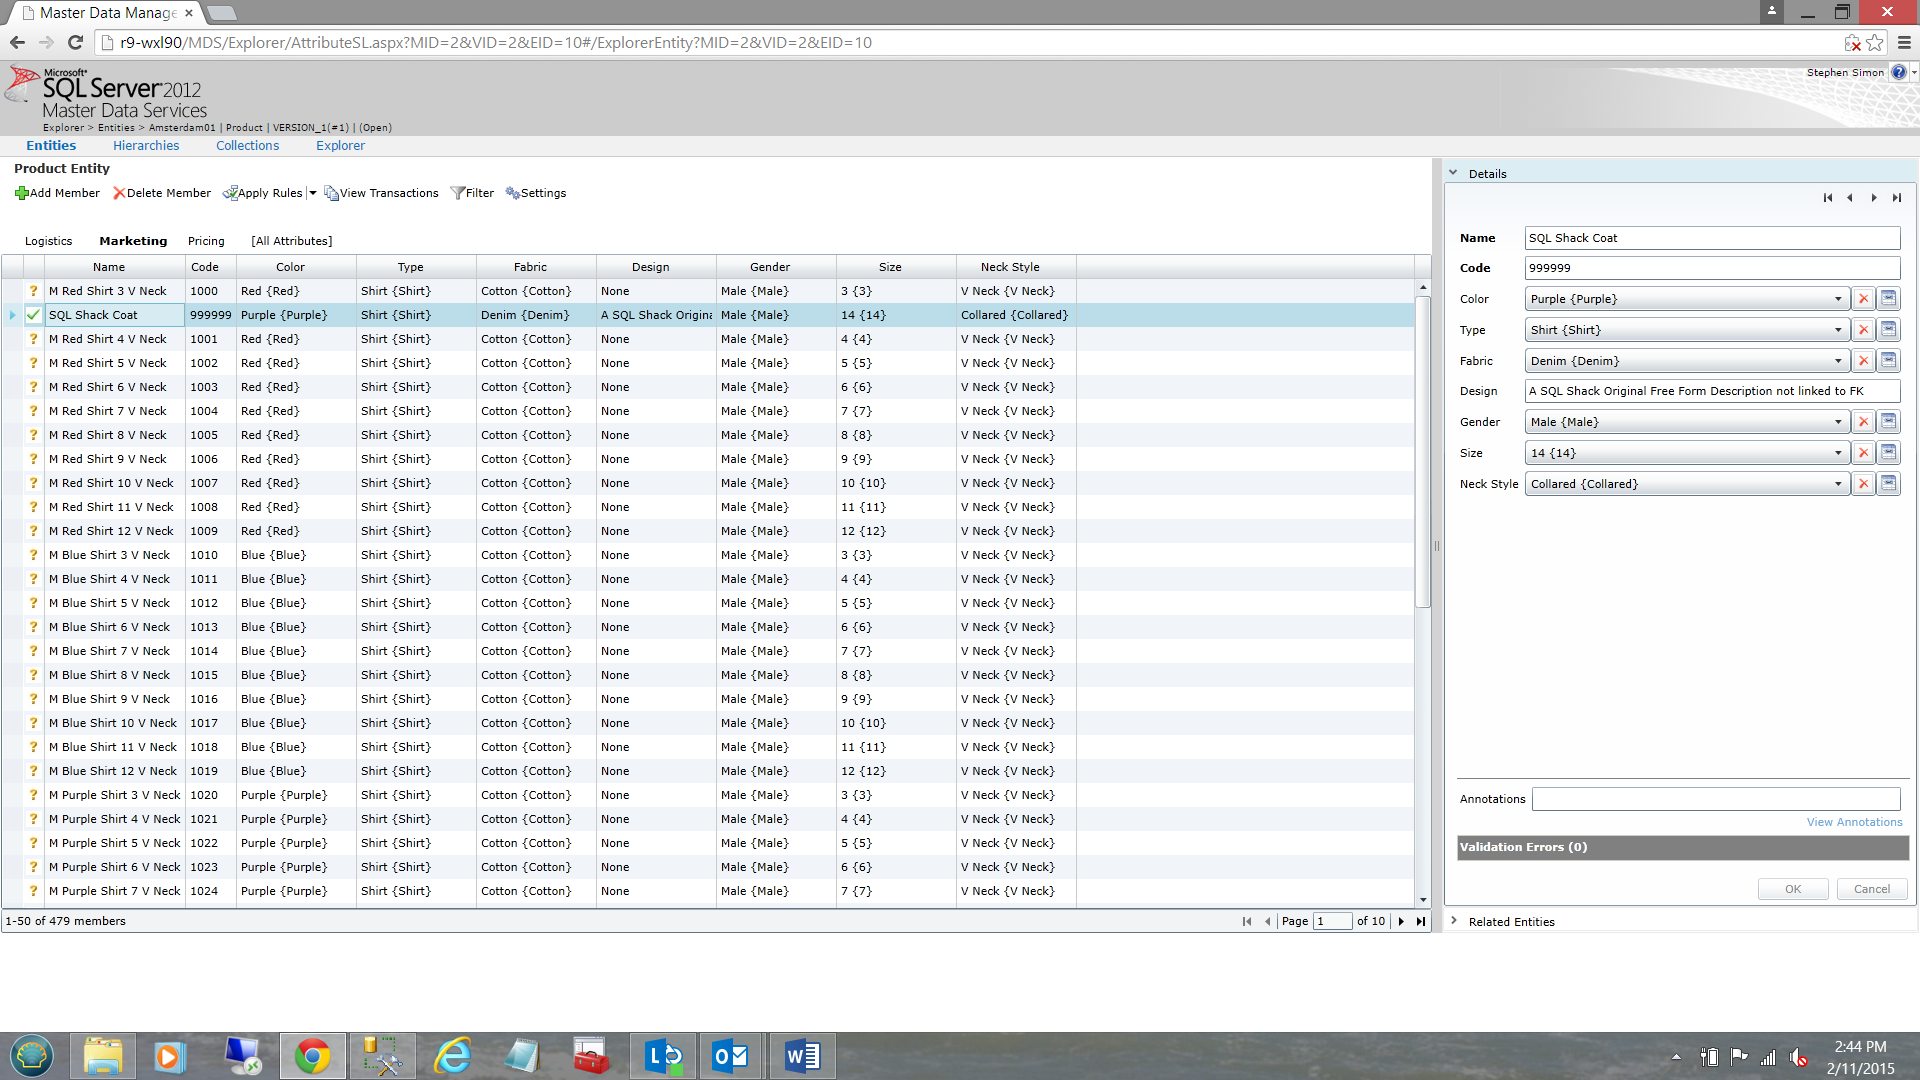
We now see that our member has been successfully altered.
As a quick recap, thus far we have been introduced to Master Data Services at the fifty million meter high level. We have discussed the concept of a “Main” entity (in our case “Product”) and the usage of satellite “pick list” entities (Color etc.). Entering the actual colors into the “Color” entity (as it is a foreign entity), we entered the actual color “Codes” and “Names” as free form text. Once the satellite entities have been created we may create the “Product” entity and utilize the values within the satellite entities as attribute values for our “Product” members. We also remember that the color choices for the color attribute of the “Product” entity come from the “Color” pick list entity. Finally “Product” related modifications may be effected to keep our data fresh and up to date.
Where is the all of this data stored?
One of the hardest concepts for folks to understand when it comes to utilizing Master Data Services is that the data that we have just been looking at is an integral part of the MDS database and not in your “run of the mill “database. Further, the structure of the entity itself is not at all conducive to creating queries for reporting purposes. Within Master Data Services, data extraction is achieved rather via “views”. This said, we must create a view to view the data from Management Studio.
A major Master Data Services GOTCHA!!! Creating a “Current” flag
Master Data Services has a really kludgy feature in that data changes occur in ‘layers’. Thus when data is inserted into the initial version of our project, this data becomes the baseline data for reporting. Changes to the data are “piled upon” the initial version. Often when changes to the data occur, we wish to view these changes with our reporting tools. What is rendered within the report is the committed versions of the data instead. Committing the data is not an ongoing event and is normally done once in every twenty four hours or so. In most cases decision maker wish to see the most up to date data when it comes to the Master Data Services report. What is required is that we set up a “Current” flag.
To set the “Current Flag” we select “Version Management” from the main Master Data Services screen (see below).

The “Version Management” screen opens.
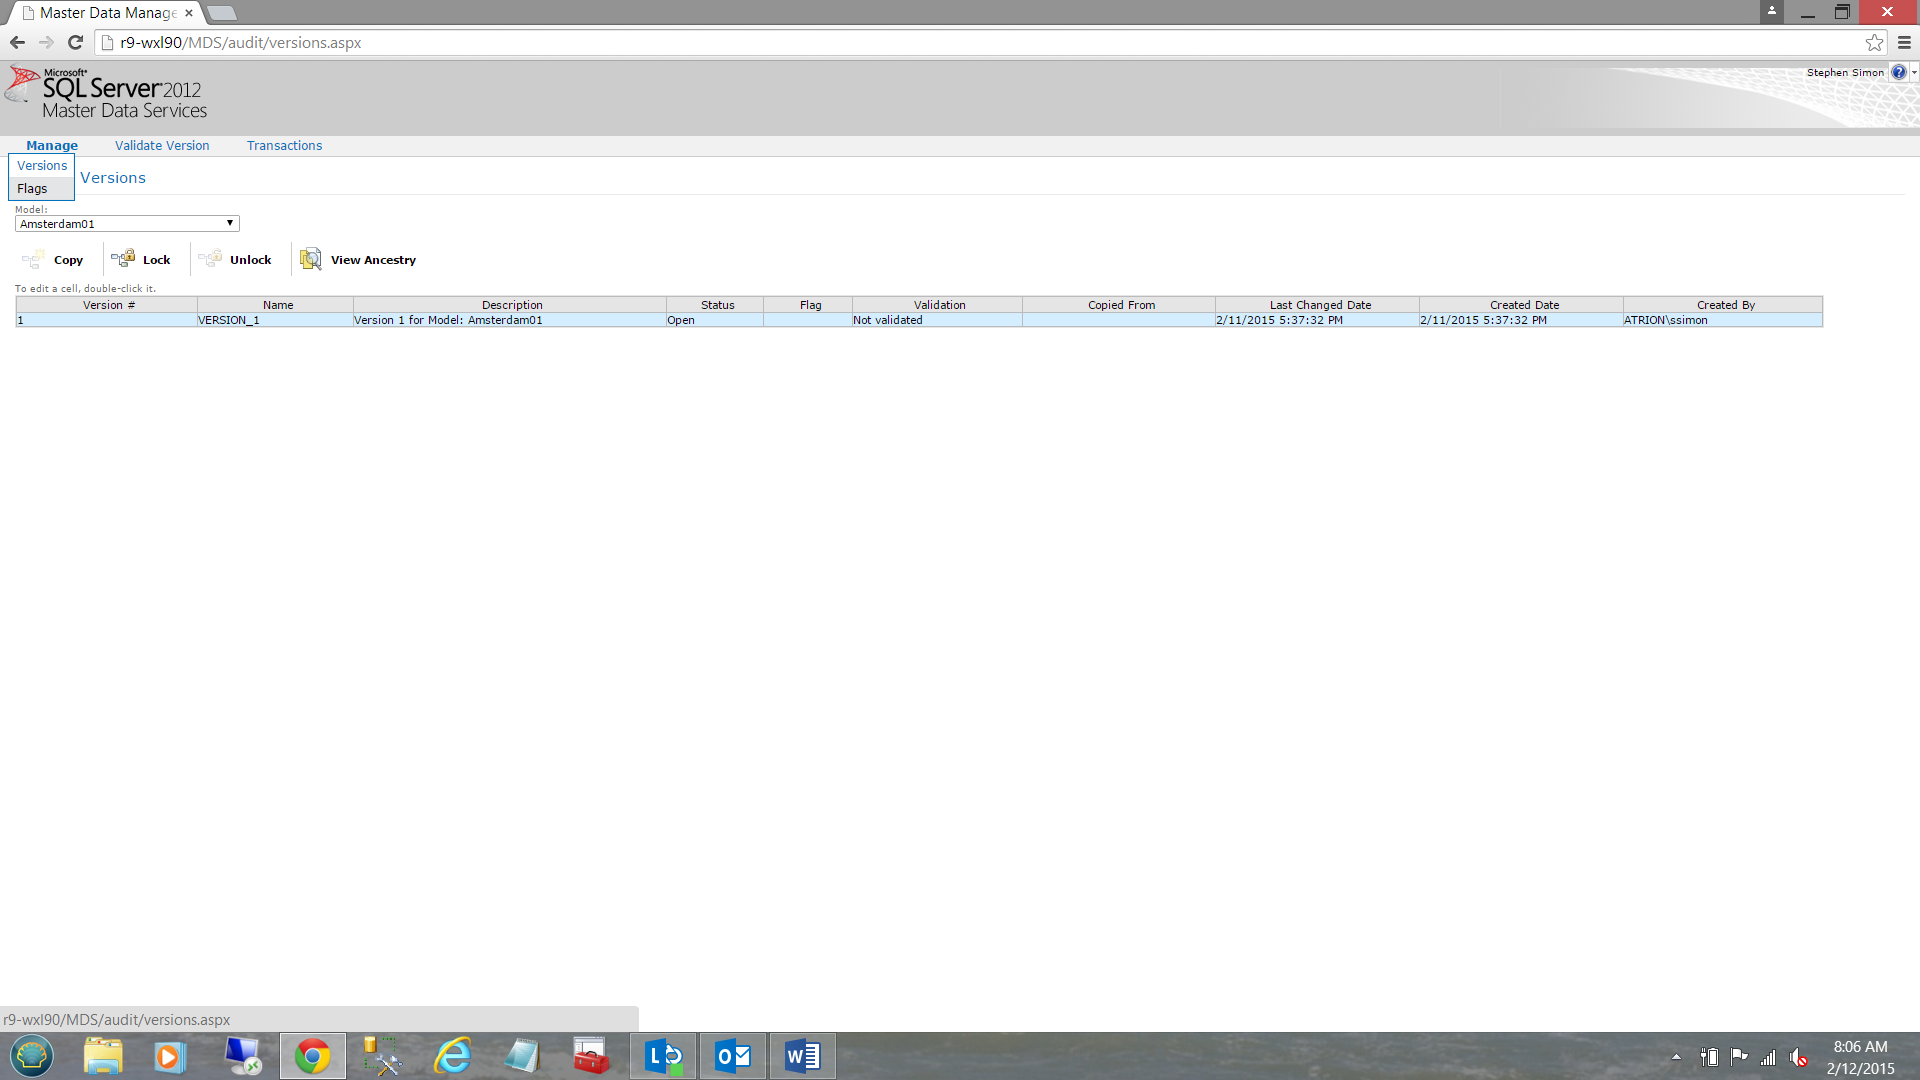
From the “Manage” ribbon we select “Flags” (see above).
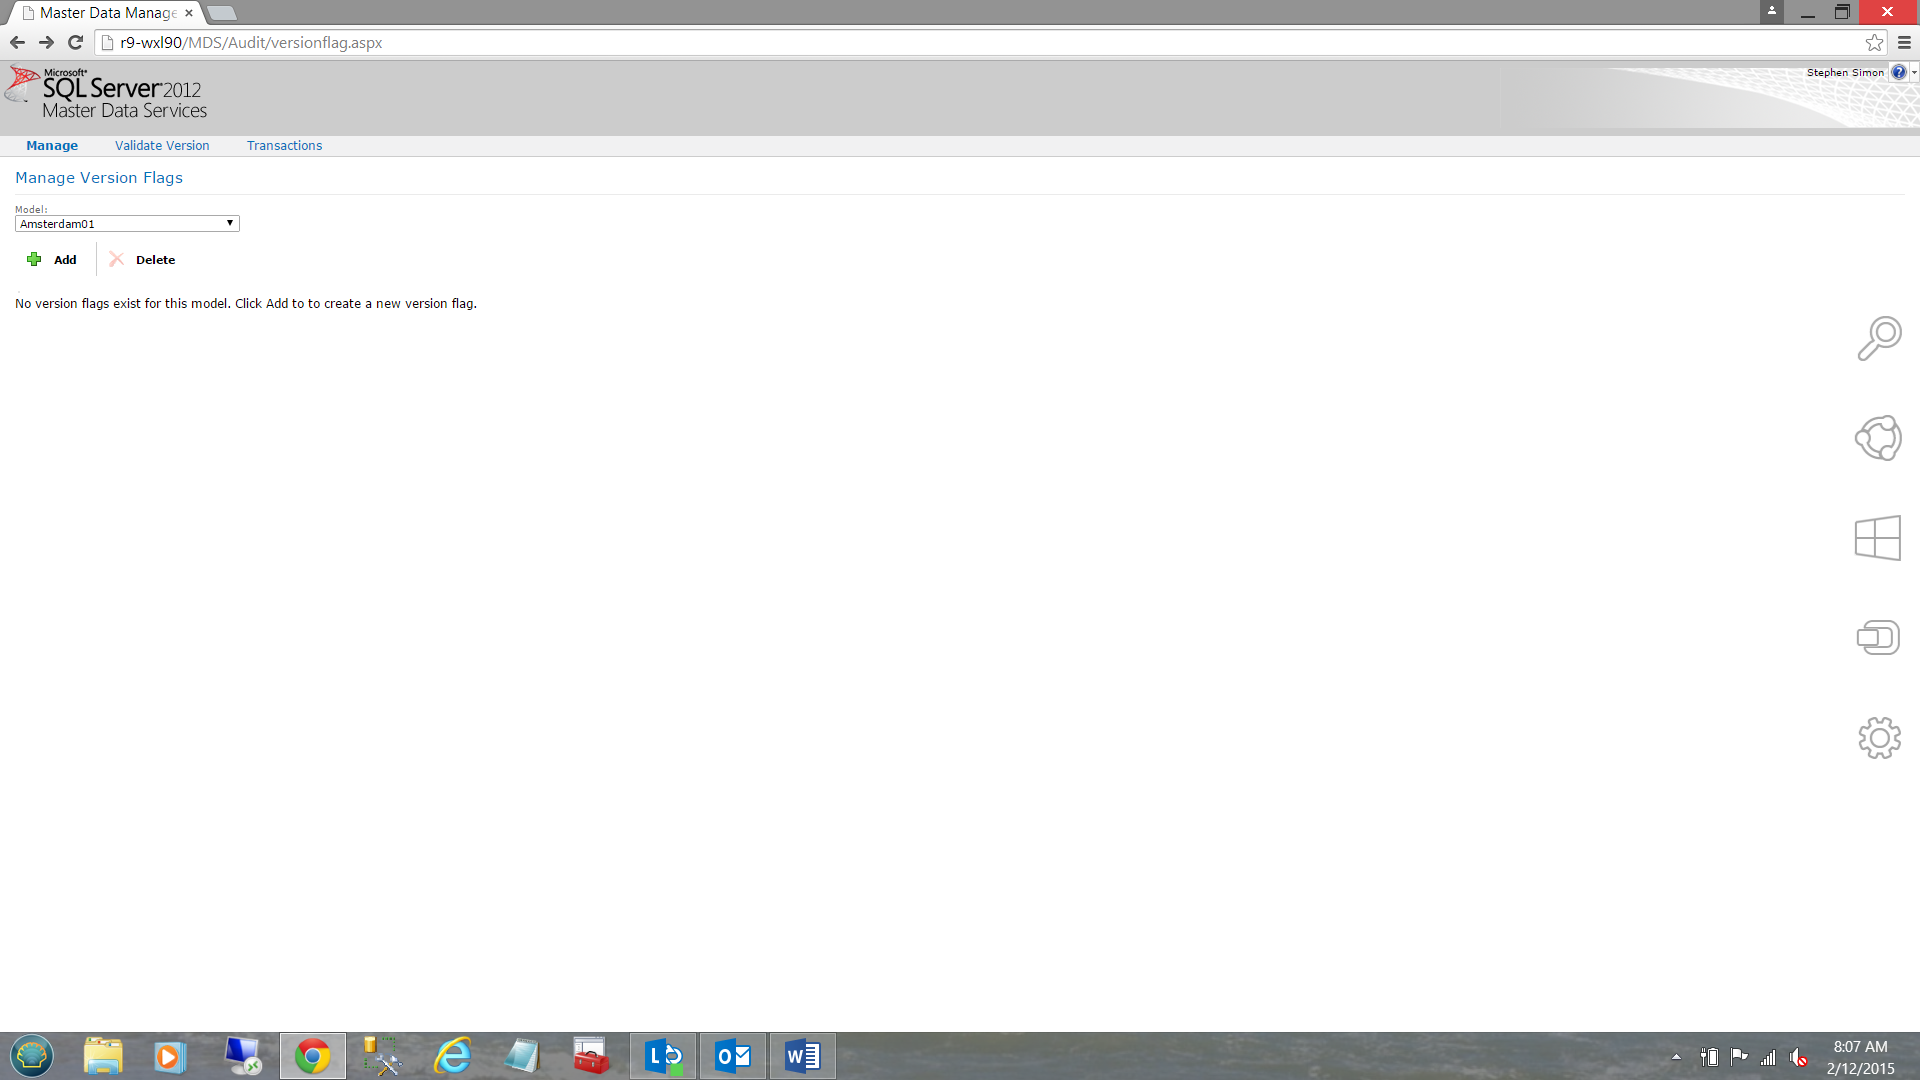
The “Manage Version Flags” dialog box opens (see above). We click the “Add” tab (see above and to the left).
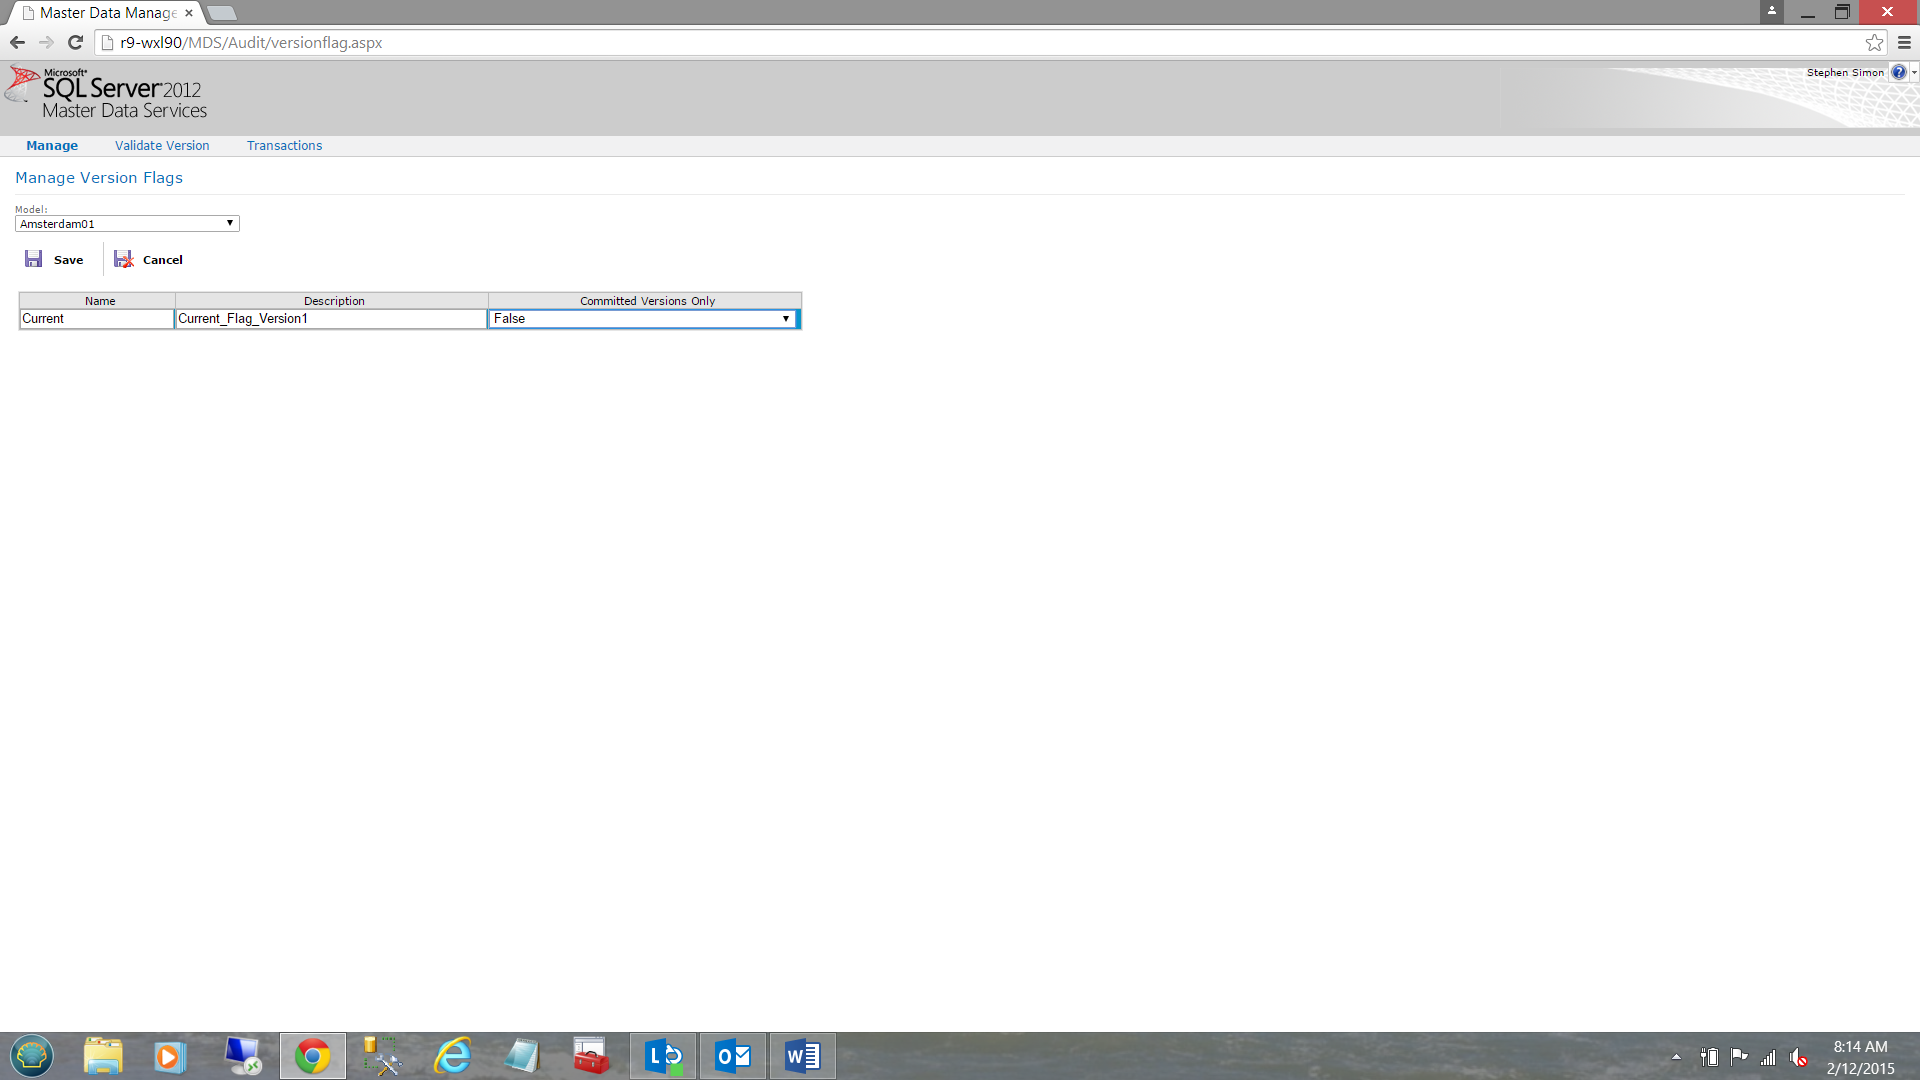
I have taken the liberty of setting up the flag for us. Note that we utilize the reserved word “Current”. Further, I have added a description and set the “Committed Versions Only” to false.
We save our flag by clicking on the “Save diskette”.
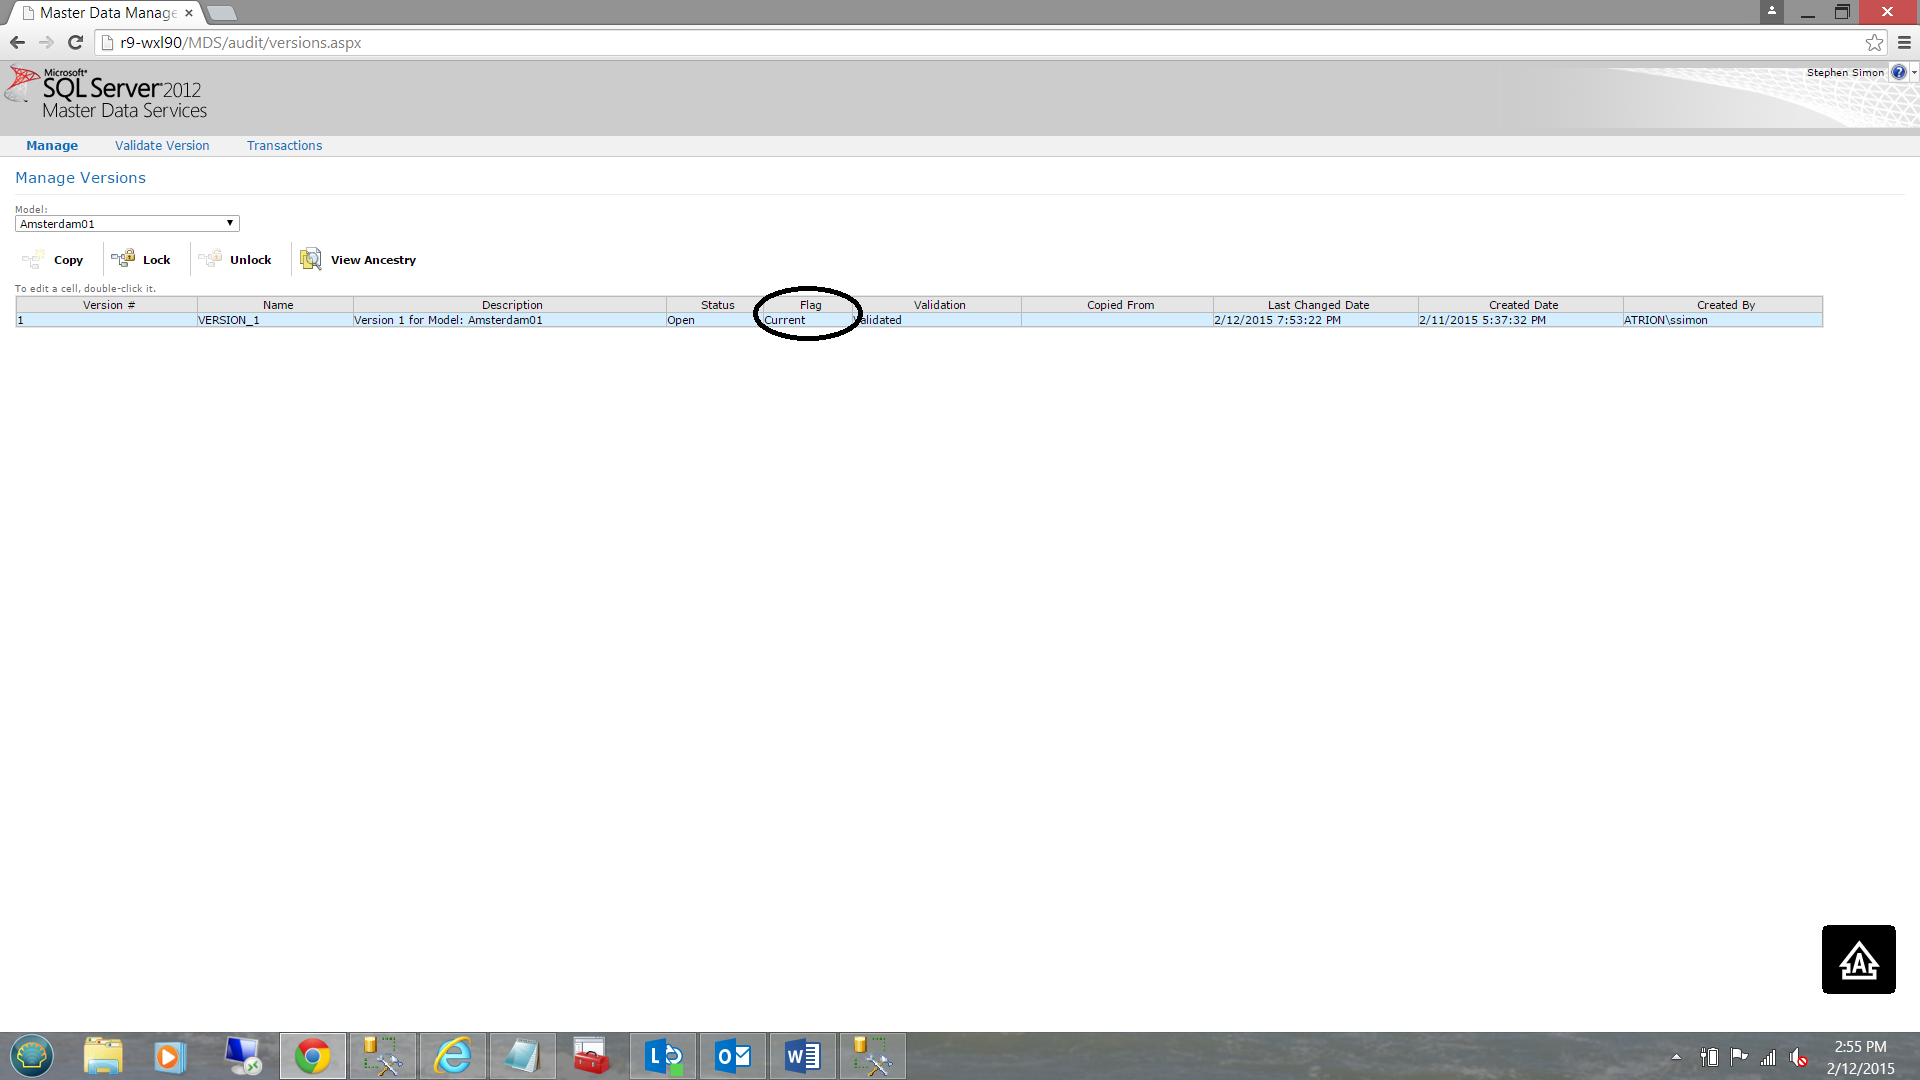
We find ourselves back on the “Manage Versions” screen. The most important GOTCHA to avoid is to remember to populate the “Flag” dialog box (see above). To do so, we double click on the “Flag” cell and our “Current” flag that we just created should appear as a part of a “pick list”. We choose this value (see above).
Meanwhile, back at the ranch!
With the “Current” flag in place, we are now ready to create our first “View” (discussed above) which will enable us to report upon the data within our SQLShack Enterprises store.
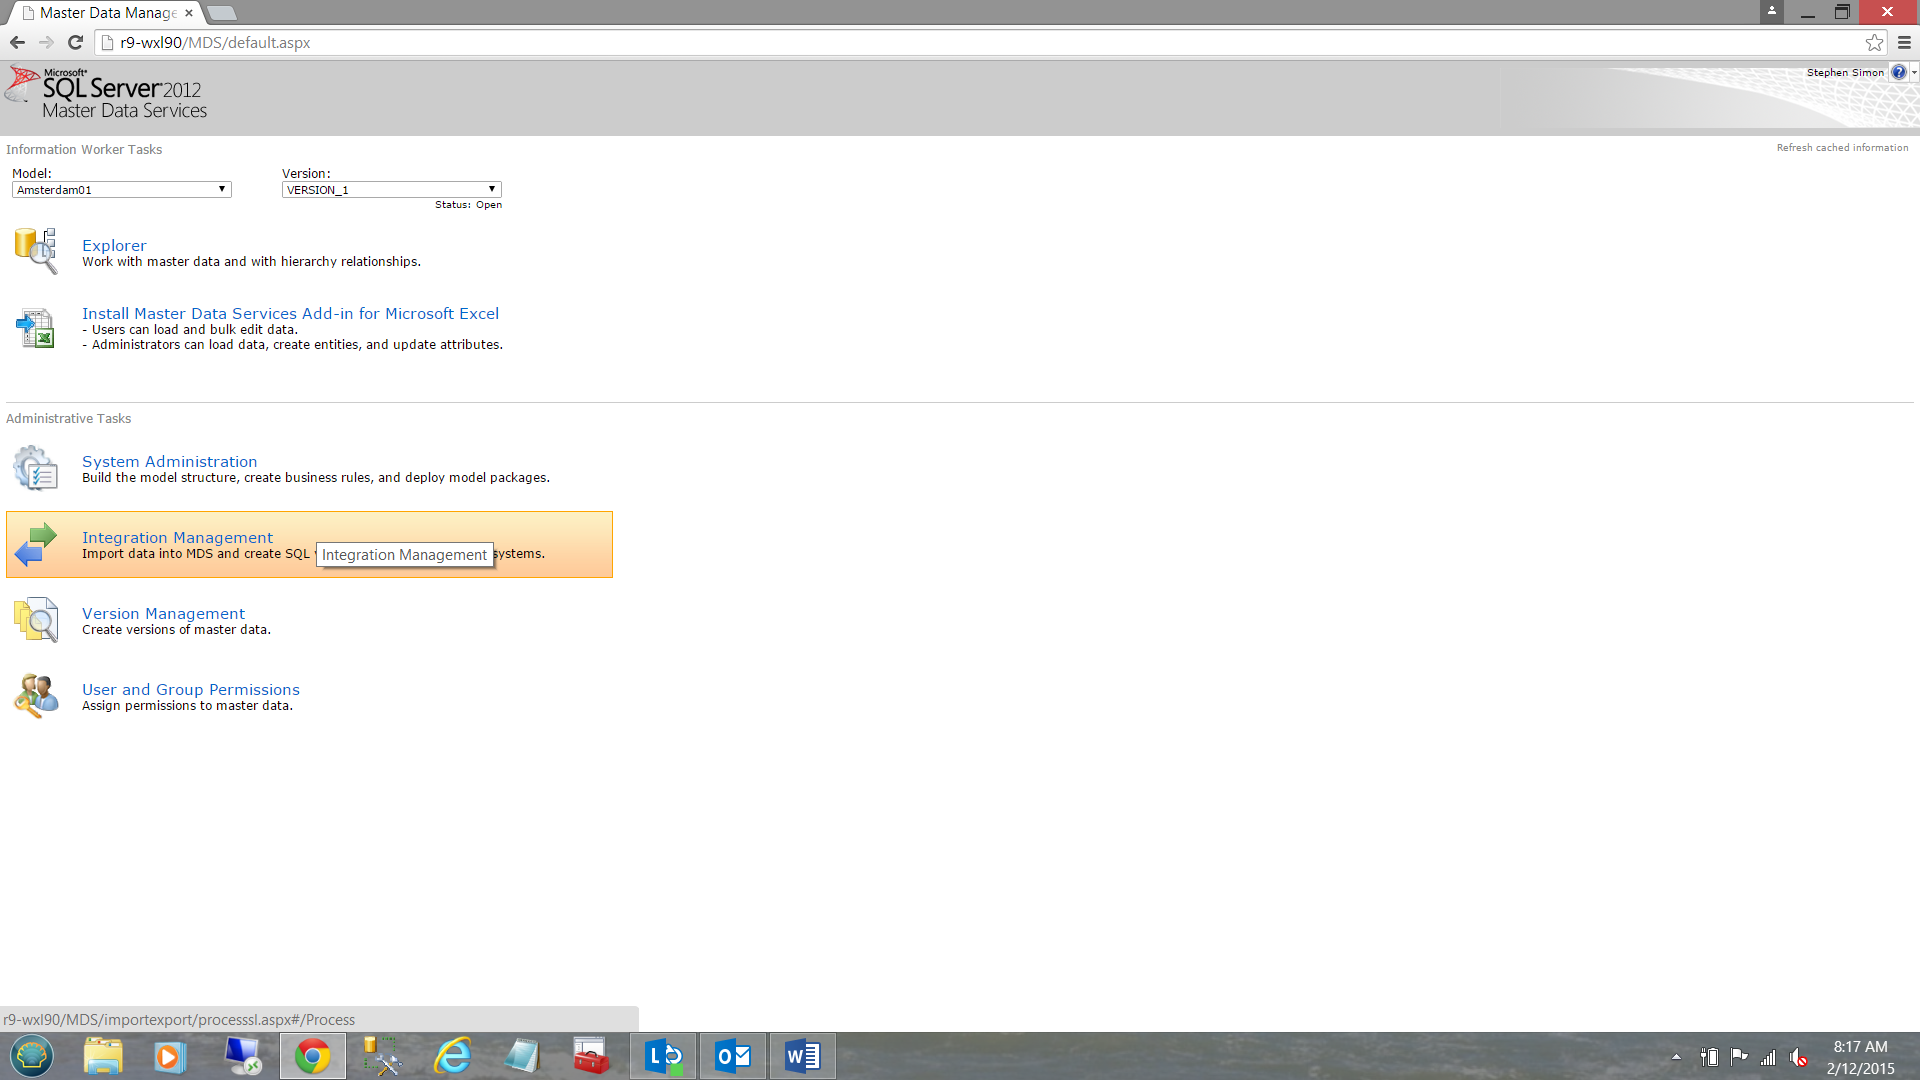
We now click upon the “Integration Management” tab (see above).
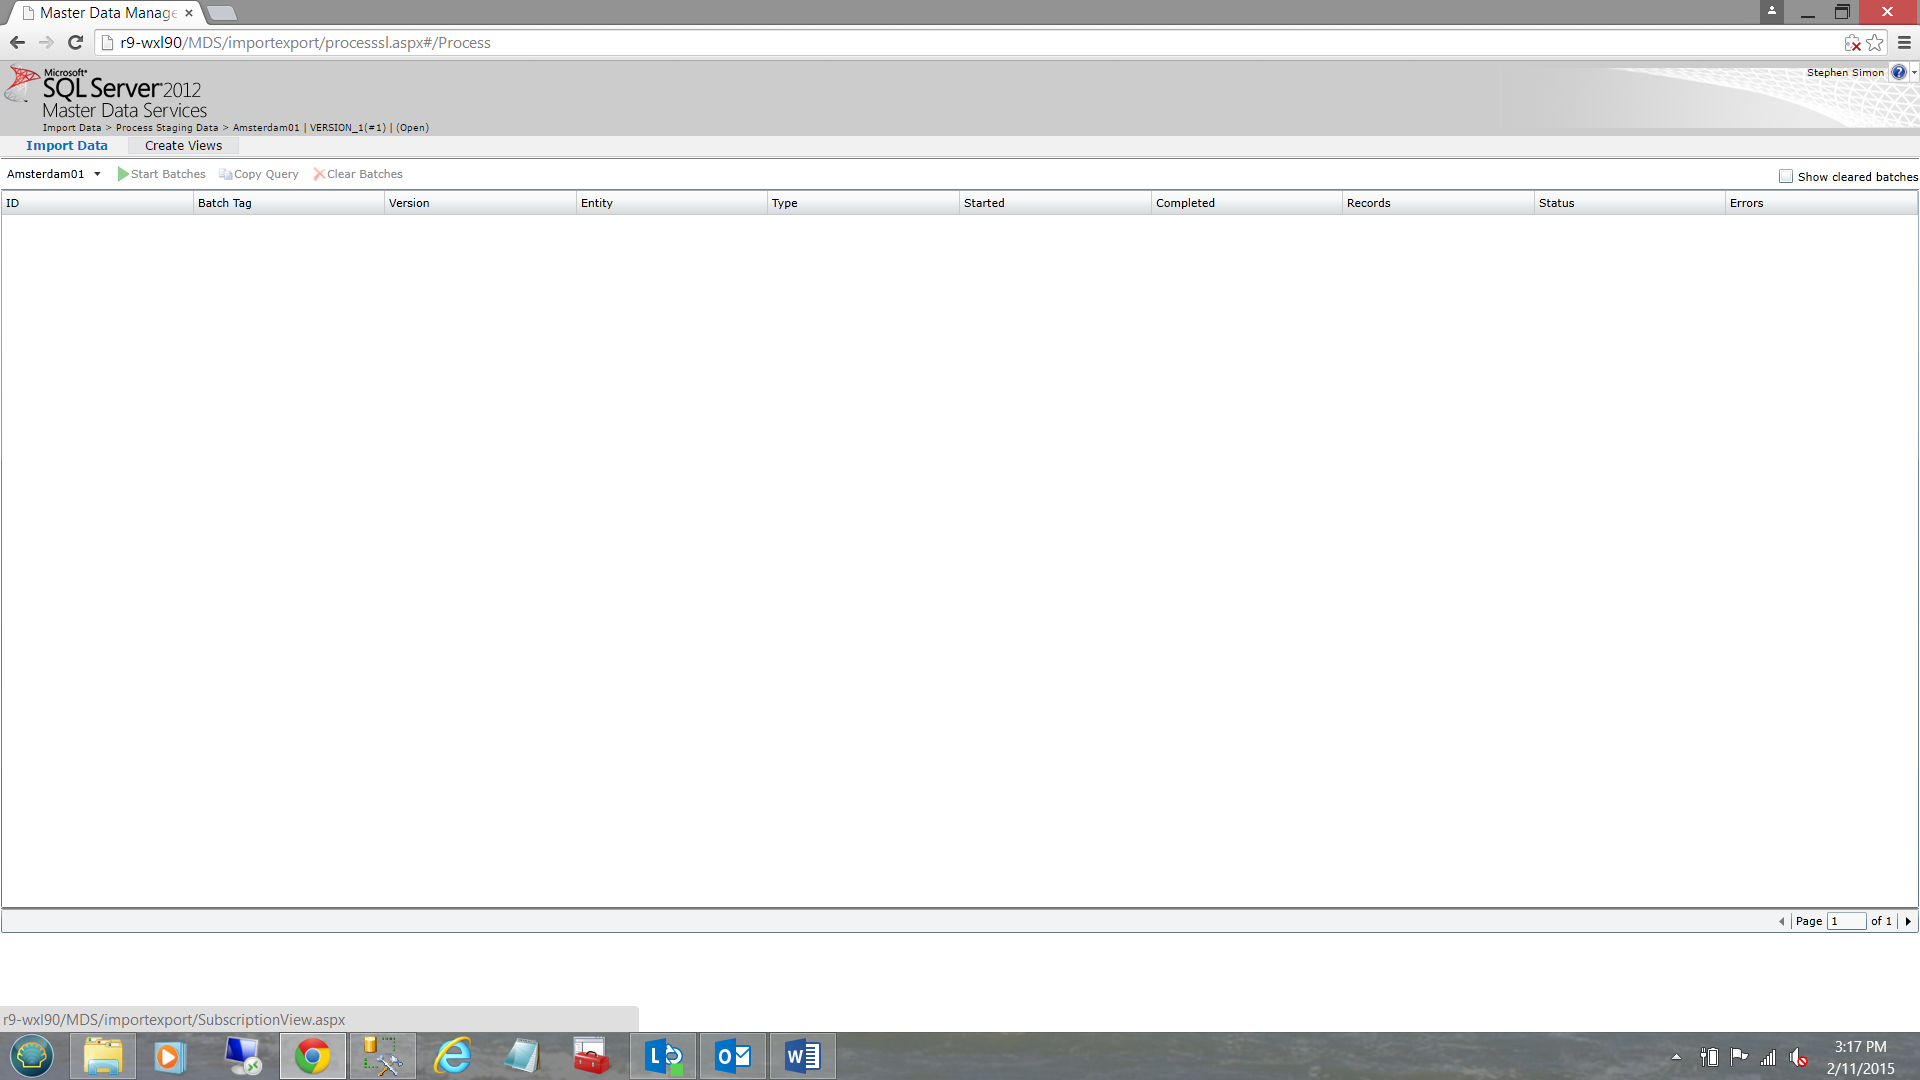
The “Integration Management” dialog box opens. We select “Create Views” (see above).
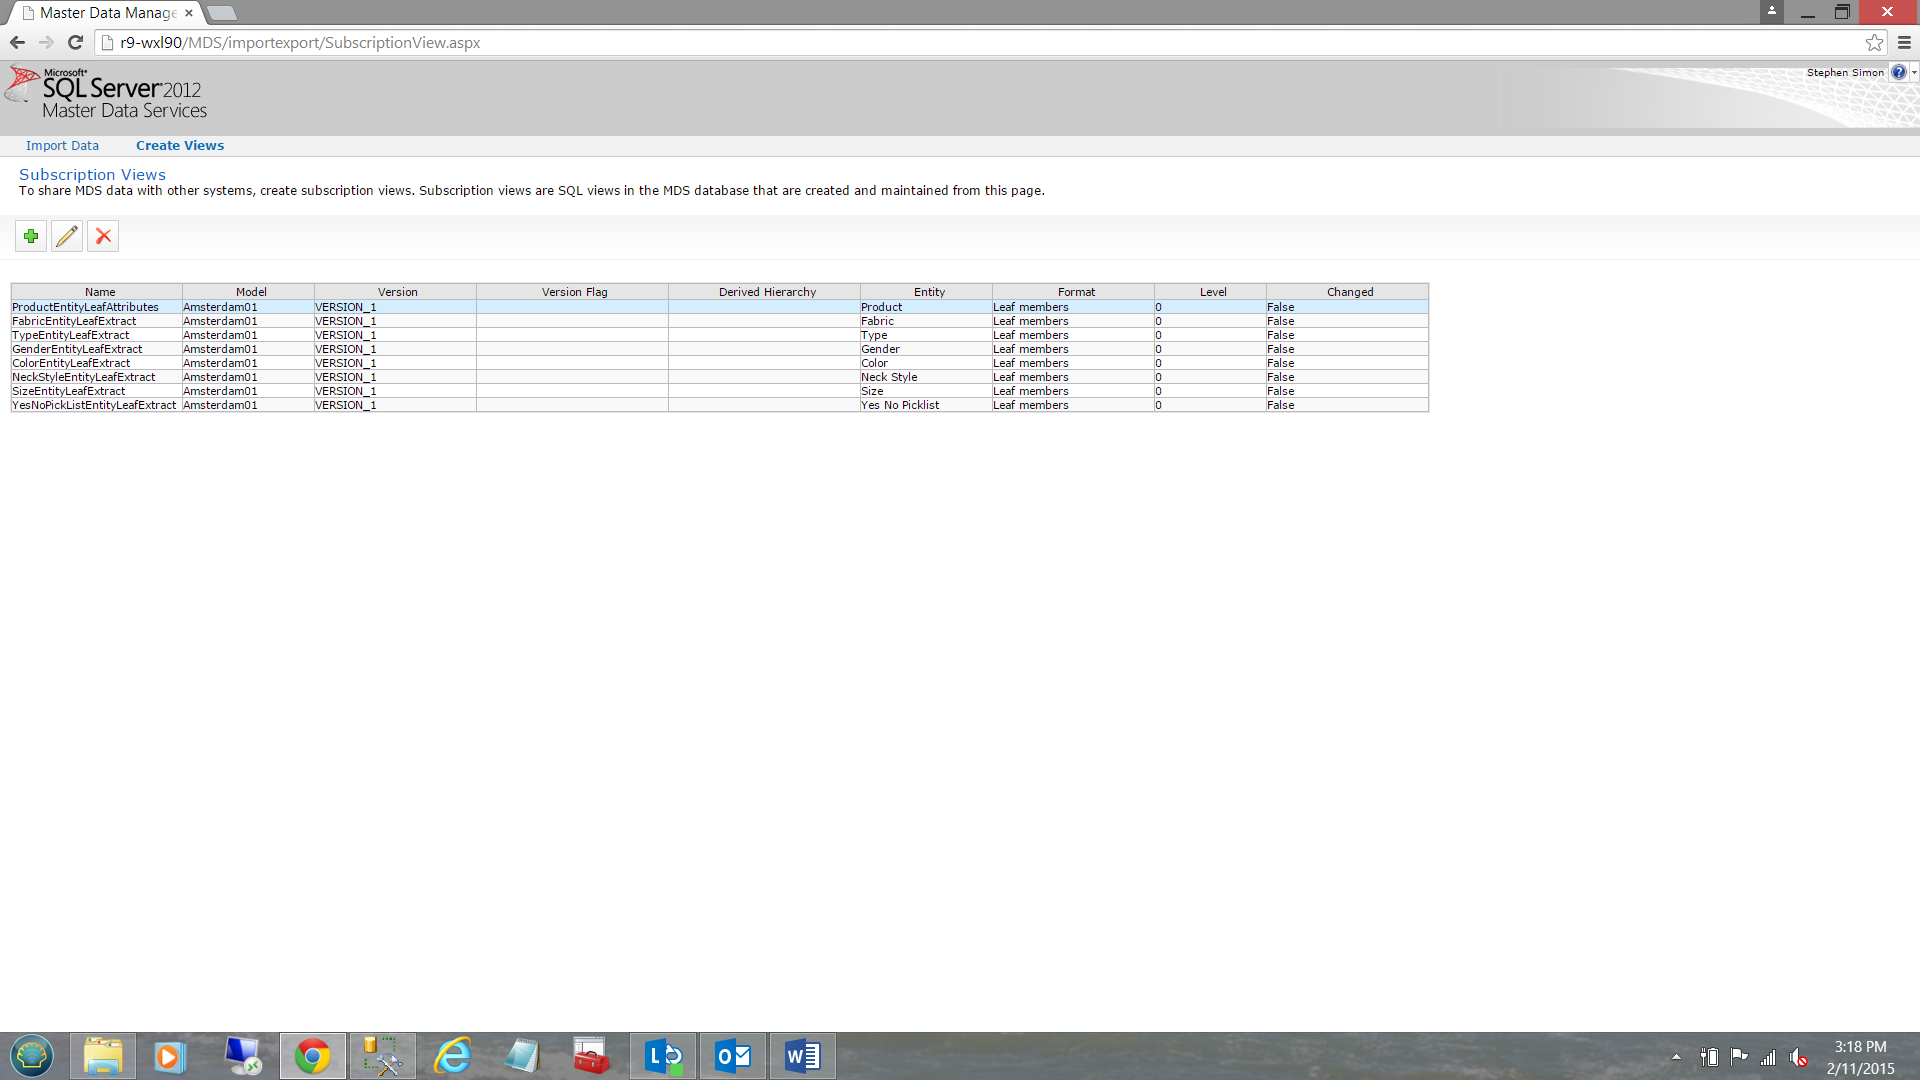
The reader will note that all the entities that we have created are present on the screen (see above). We click the “ProductEntityLeafAttribute” row (see above).
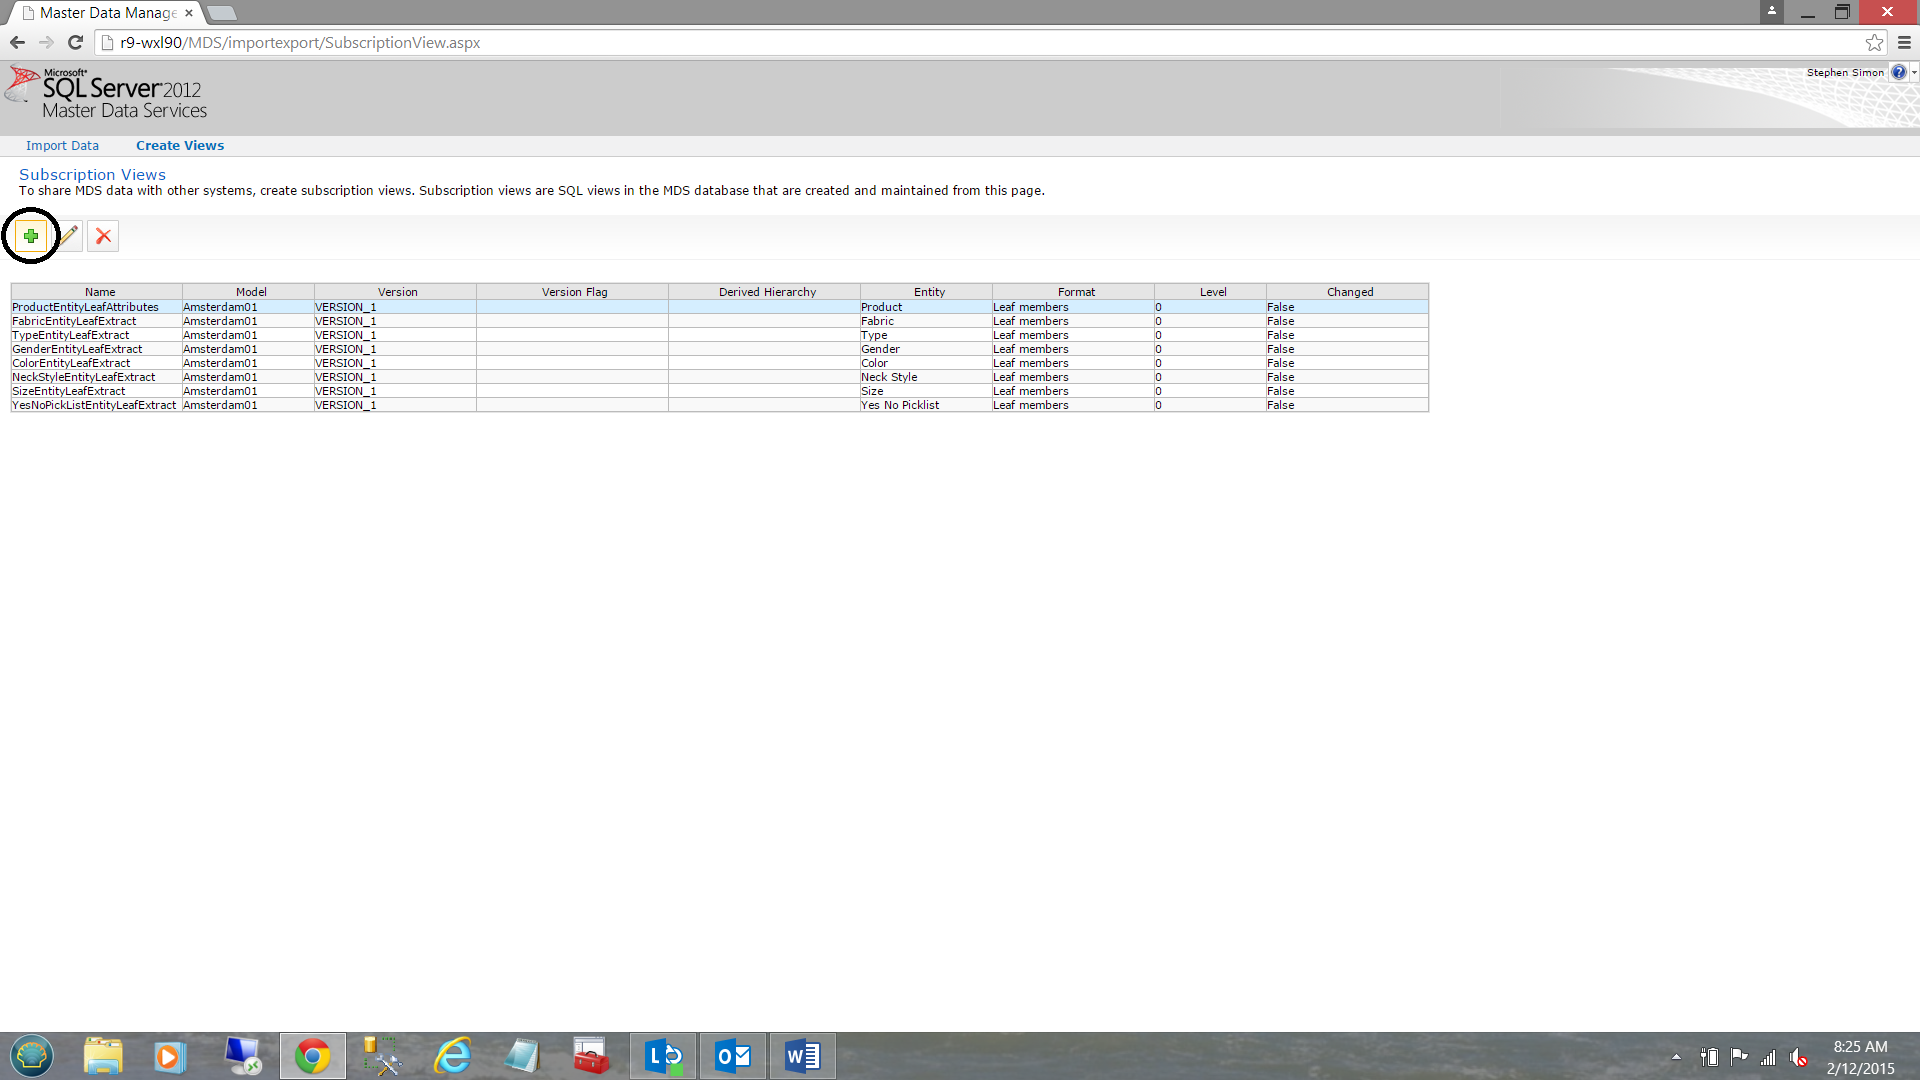
We click the + icon to open the “Create Subscription View” dialog box.

Once again, I have taken the liberty of setting up the view for the reader. We give the view the name “SQLShack_Products” and set the Model to “Amsterdam01’. At the bottom of the screen dump above, the reader will note that we have selected our “Current” flag from the “Version flag pick list”. This is the flag that we created above.
We set our “Entity” to product (once again from a “pick list”) and set the “Format” to”Leaf Members” as we want to see all the products. The option is not really relevant to our current discussion as it is more relevant to a structure where a hierarchy exists. We shall be discussing hierarchies in a future get together.
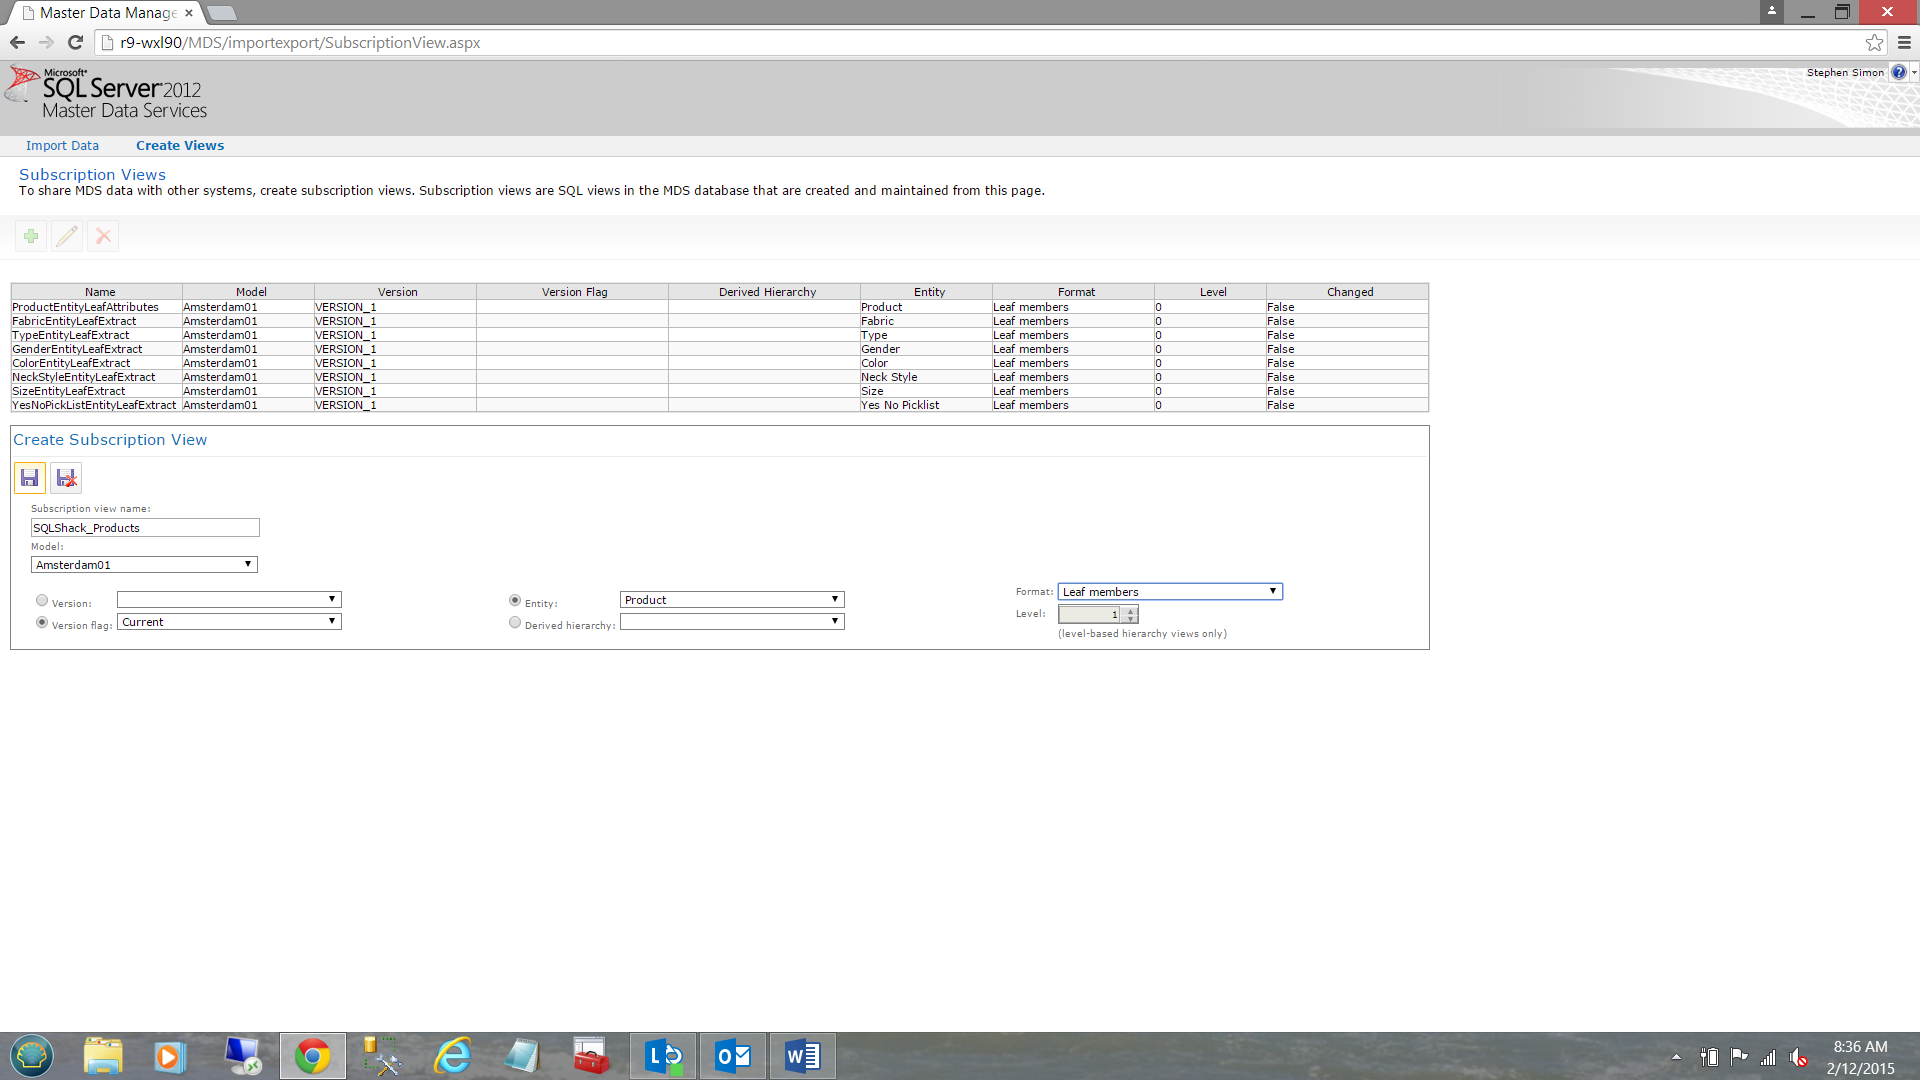
We click the save diskette (see above) to save our view.
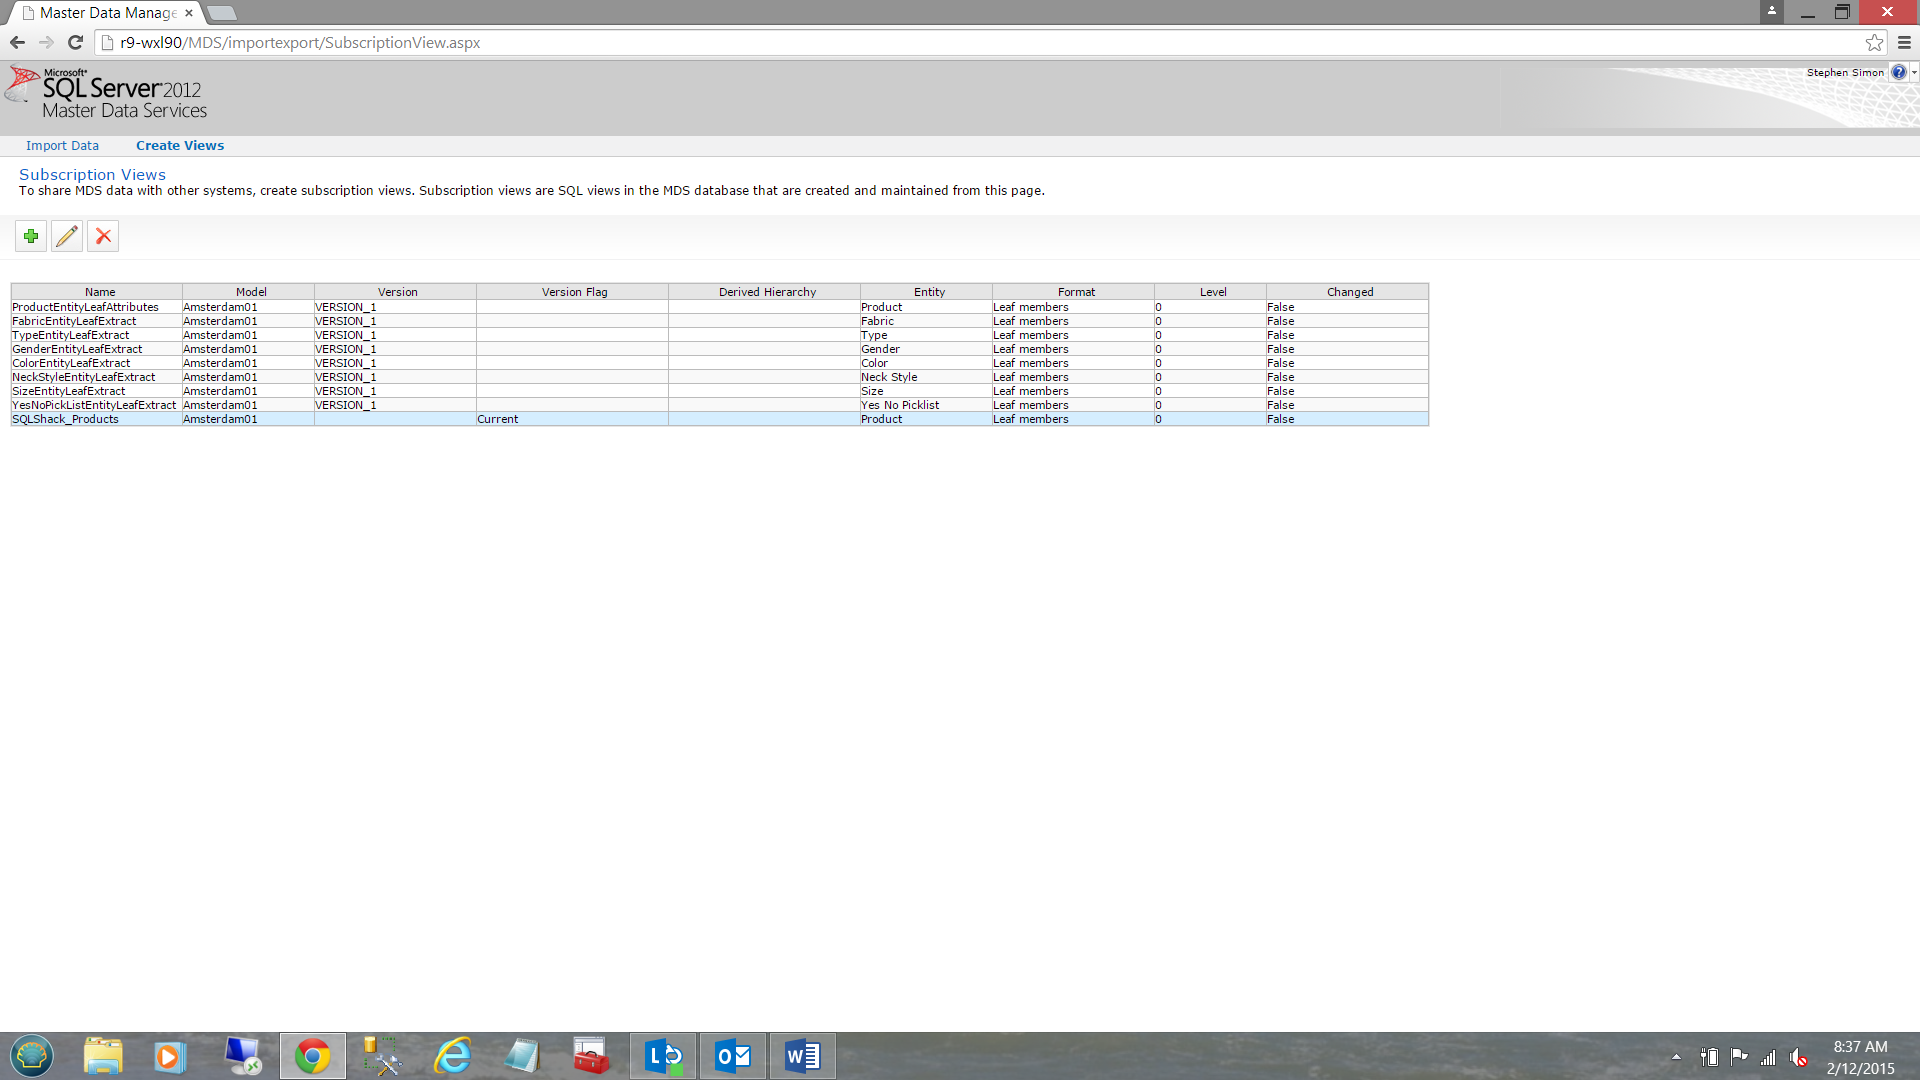
We find ourselves back at the “Subscription Views” screen. Let us now execute a quick query to see just what data presently exists within Master Data Services.
SQL Server Management Studio
Opening SQL Server Management Studio, we look for the Master Data Services database (MDS).
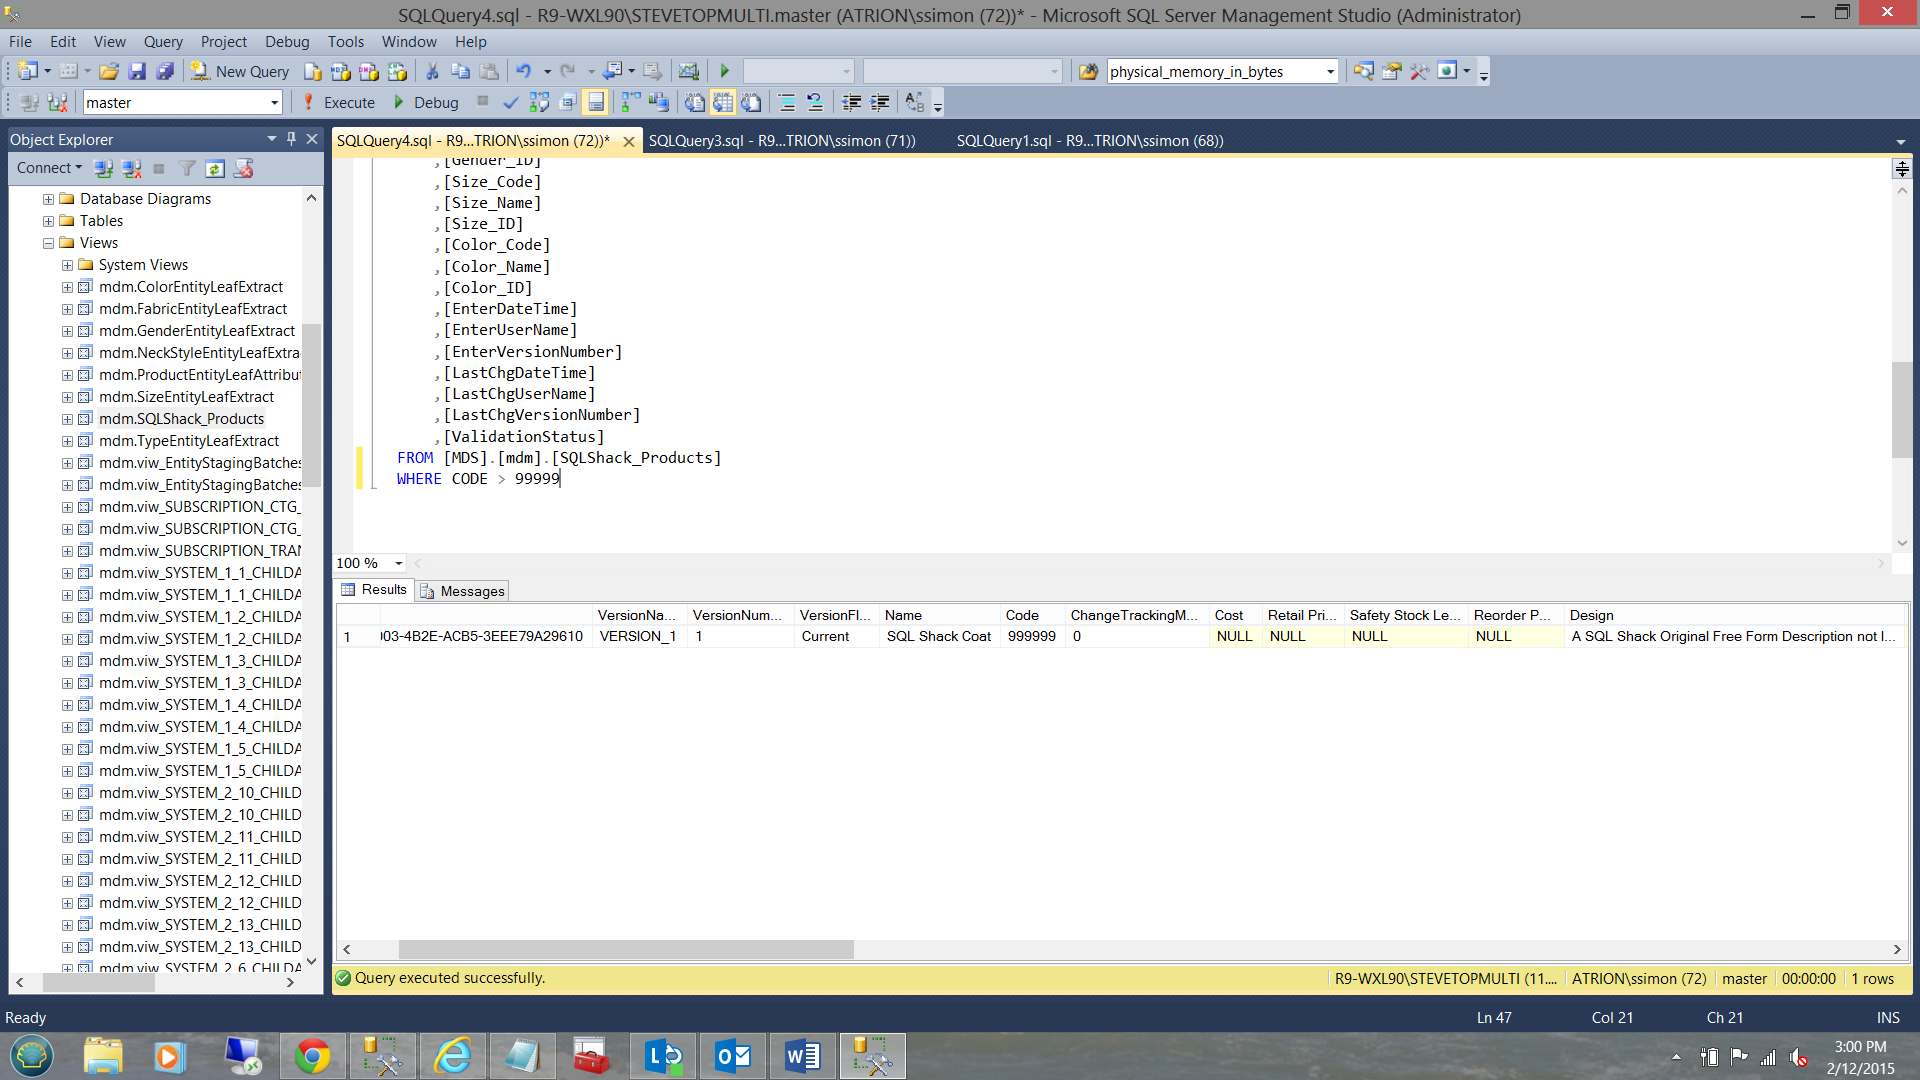
Under “Views”, we find our “SQLShack_Product” view that we just created. Selecting the first 1000 rows, we find the “SQL Shack coats” that we just added to the “Product” entity (see above). The astute reader will note that there are also numerous system defined fields within the entity. We shall be utilizing this view to pull data from Master Data Services when we create a pilot report, which we shall construct in the next section.
Creating our first report from Master Data Services

Opening SQL Server Data Tools, we begin by creating a new Reporting Services project entitled “Reporting from Master Data Services”.
Should you be new to the world of creating a Reporting Services project and should you wish to learn more about how to work with Reporting Services, do have a look my SQL Shack article entitled “Now you see it, Now you don’t)
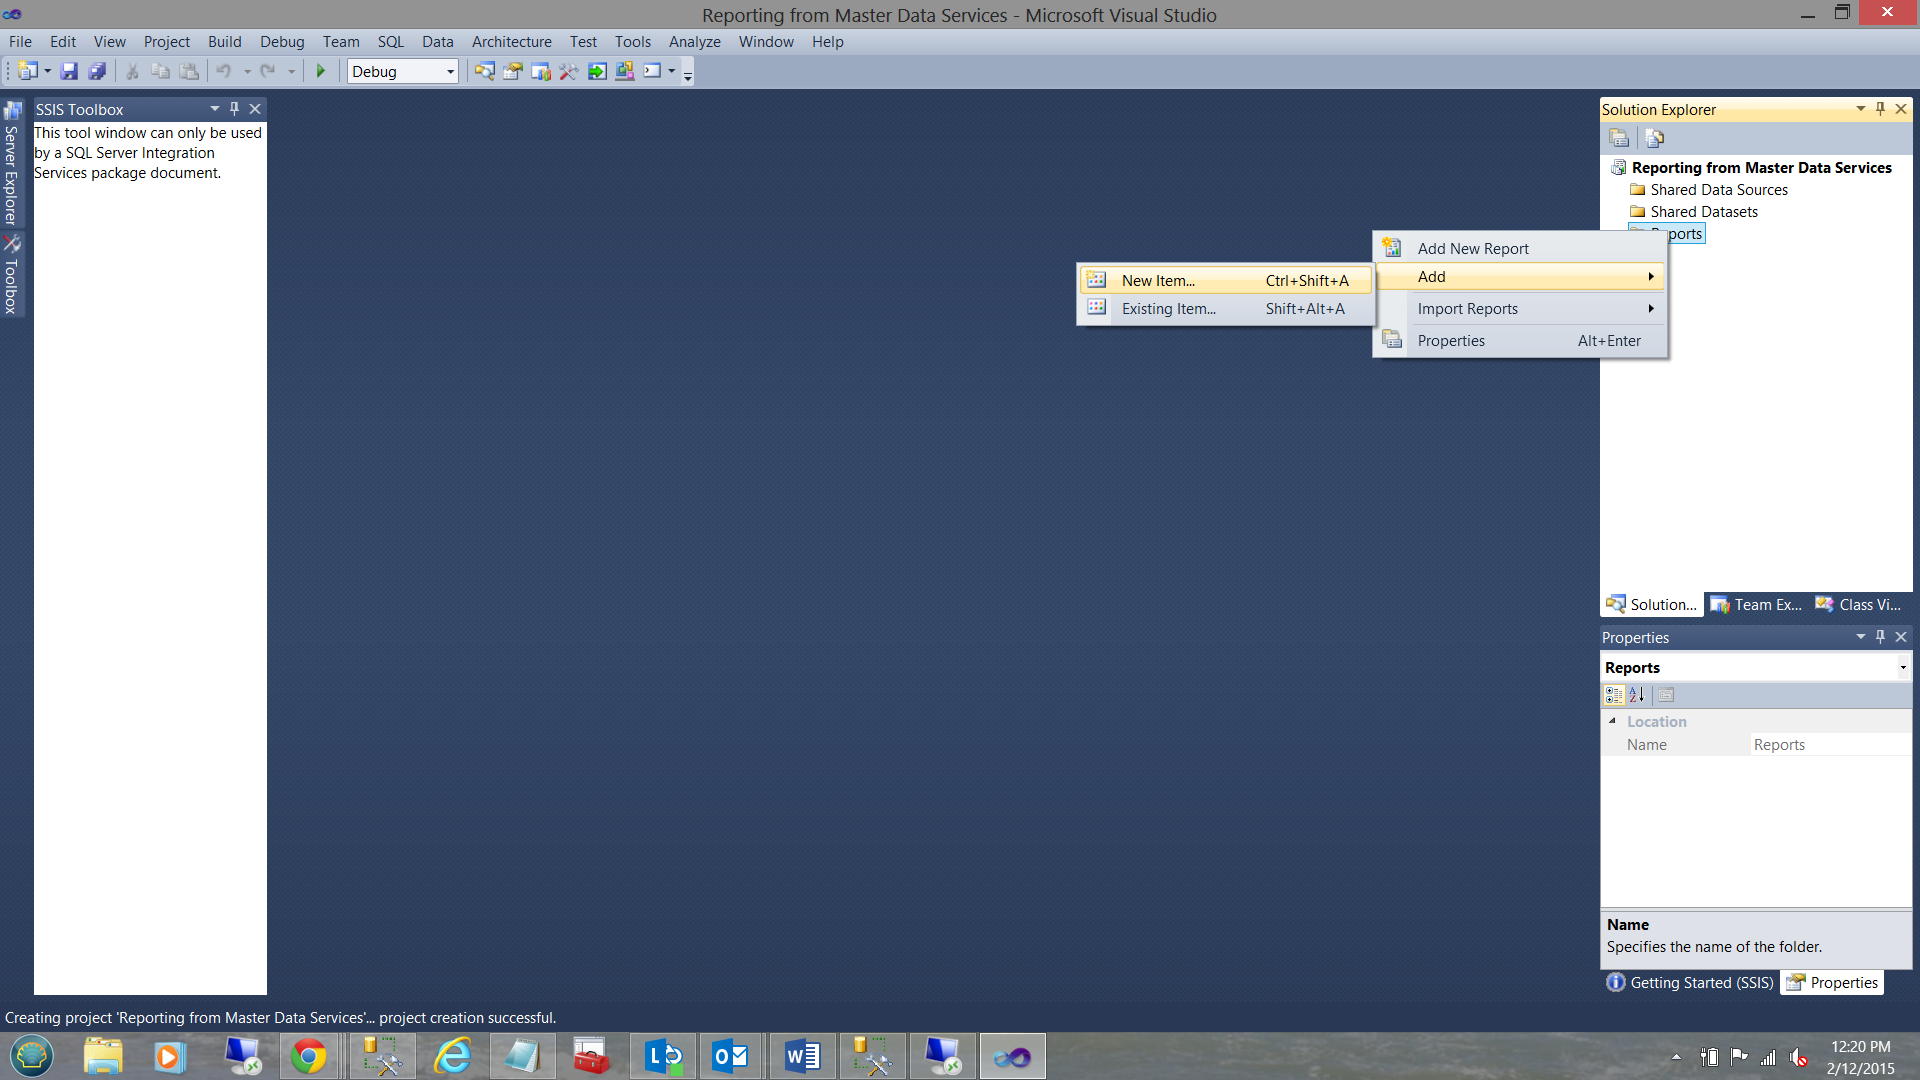
Right clicking on the “Reports” folder, we click “Add” and then “New Item”.
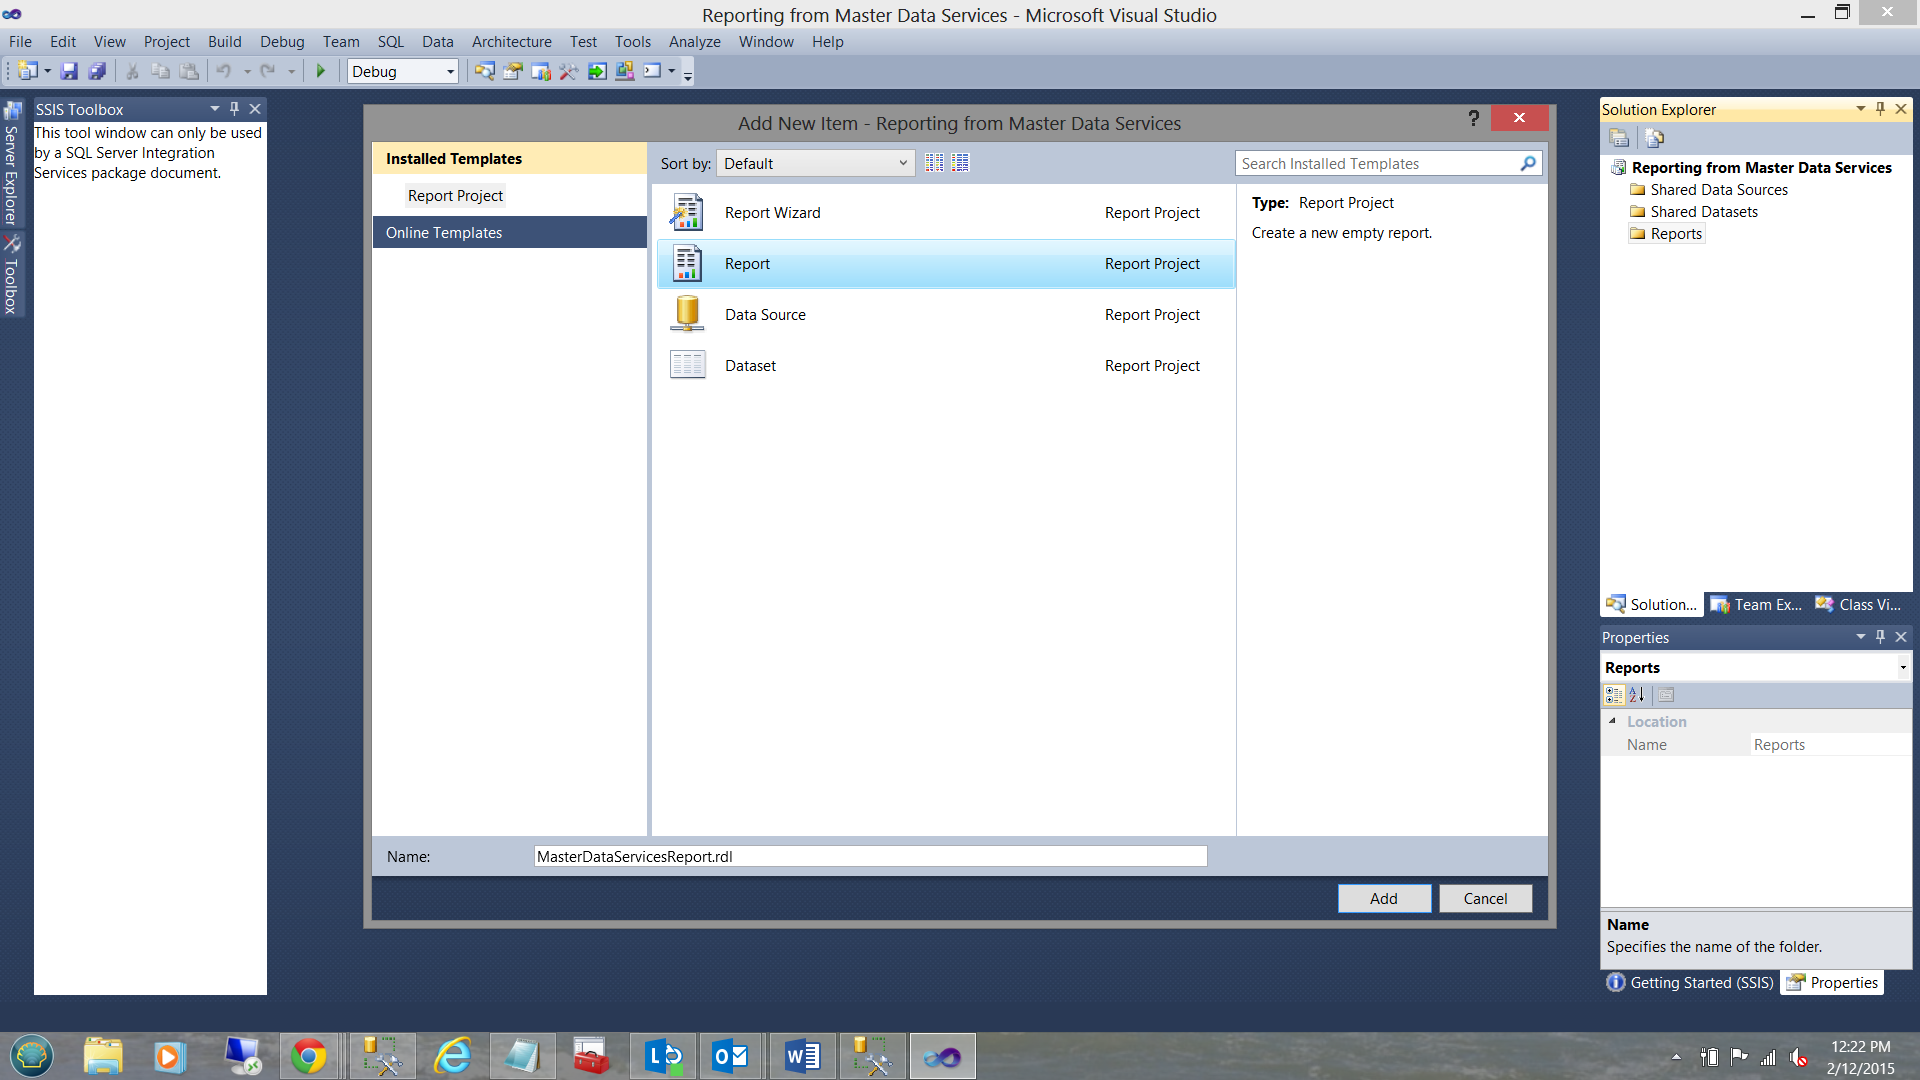
We add a “Report” and give our report a name “MasterDataServicesReport”. We then click “Add”.
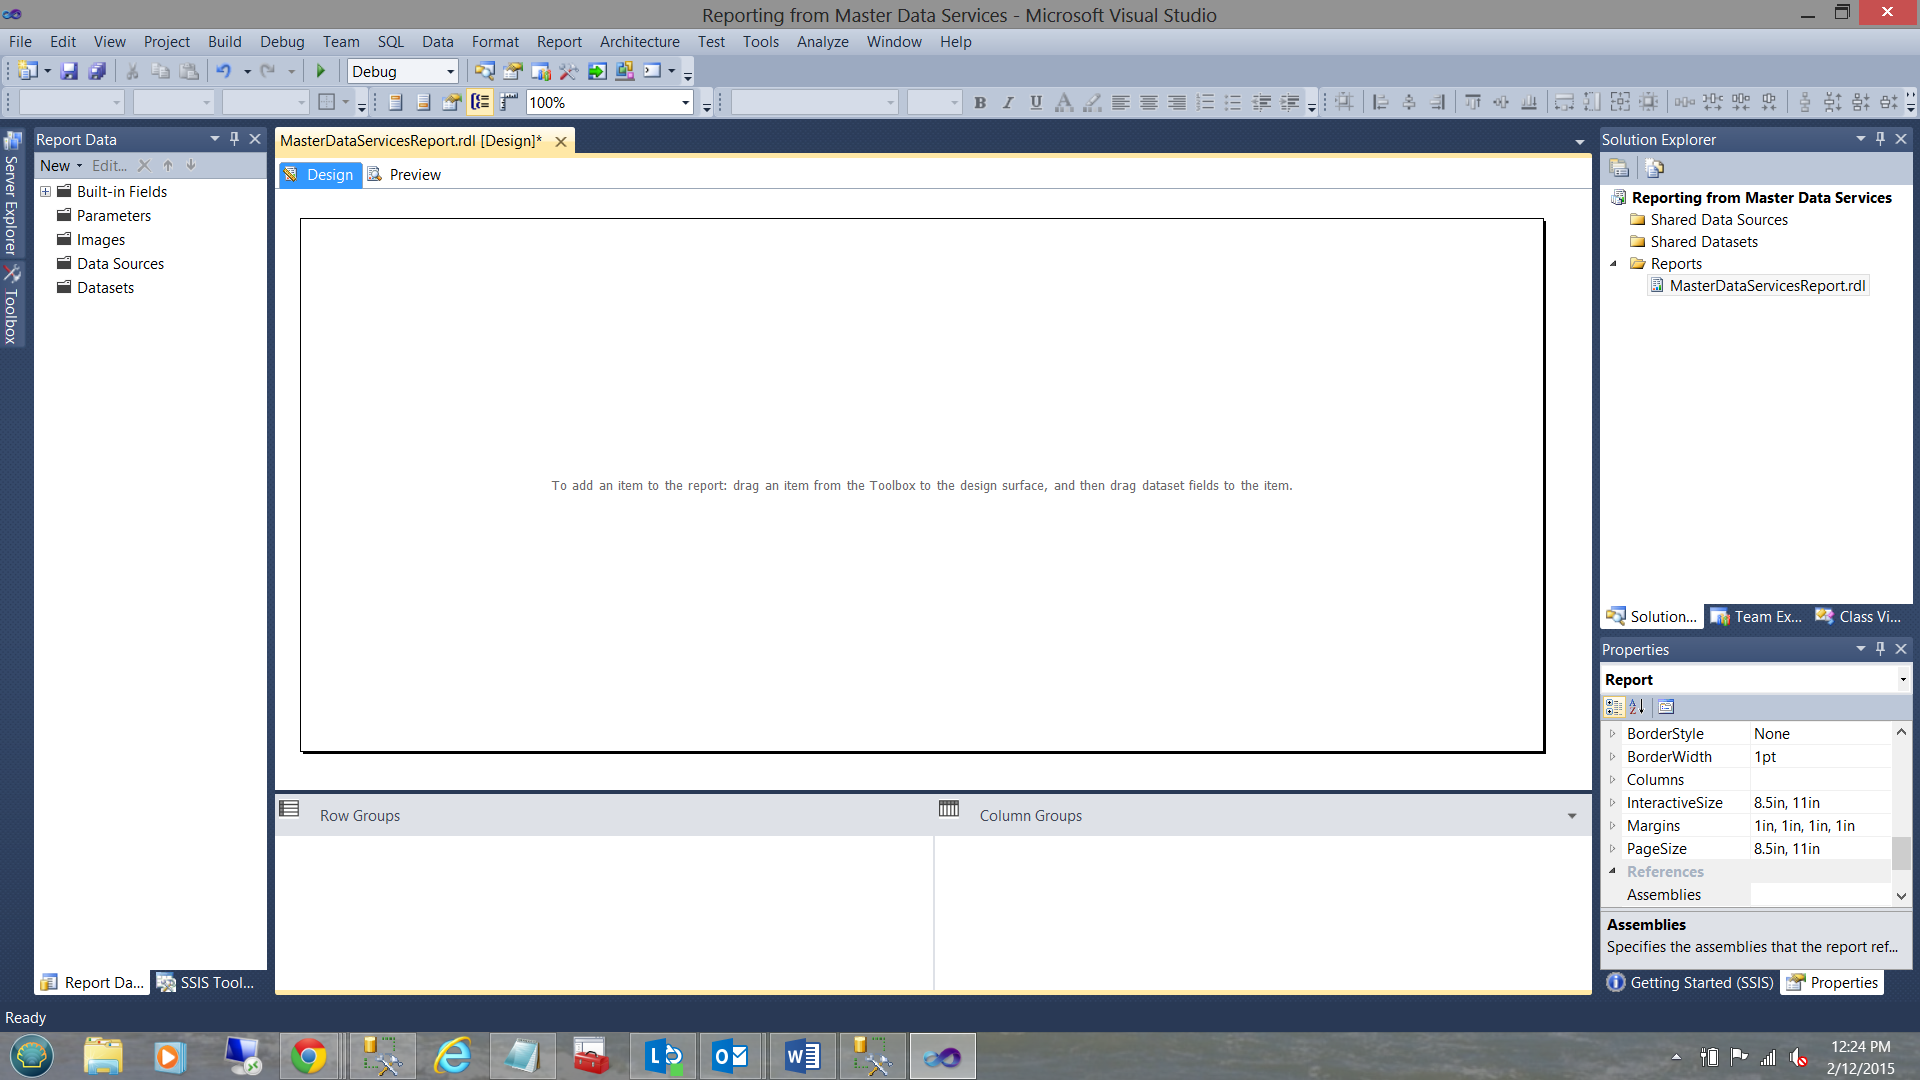
We are returned to our drawing surface.
Our first task is to create a new “Shared Data Source”. As we have discussed in many past articles, a “Data Source” may be likened to a water hose connecting the house water tap (the database) to the pot plants 20m from the house (the datasets behind our charts/matrices etc.).
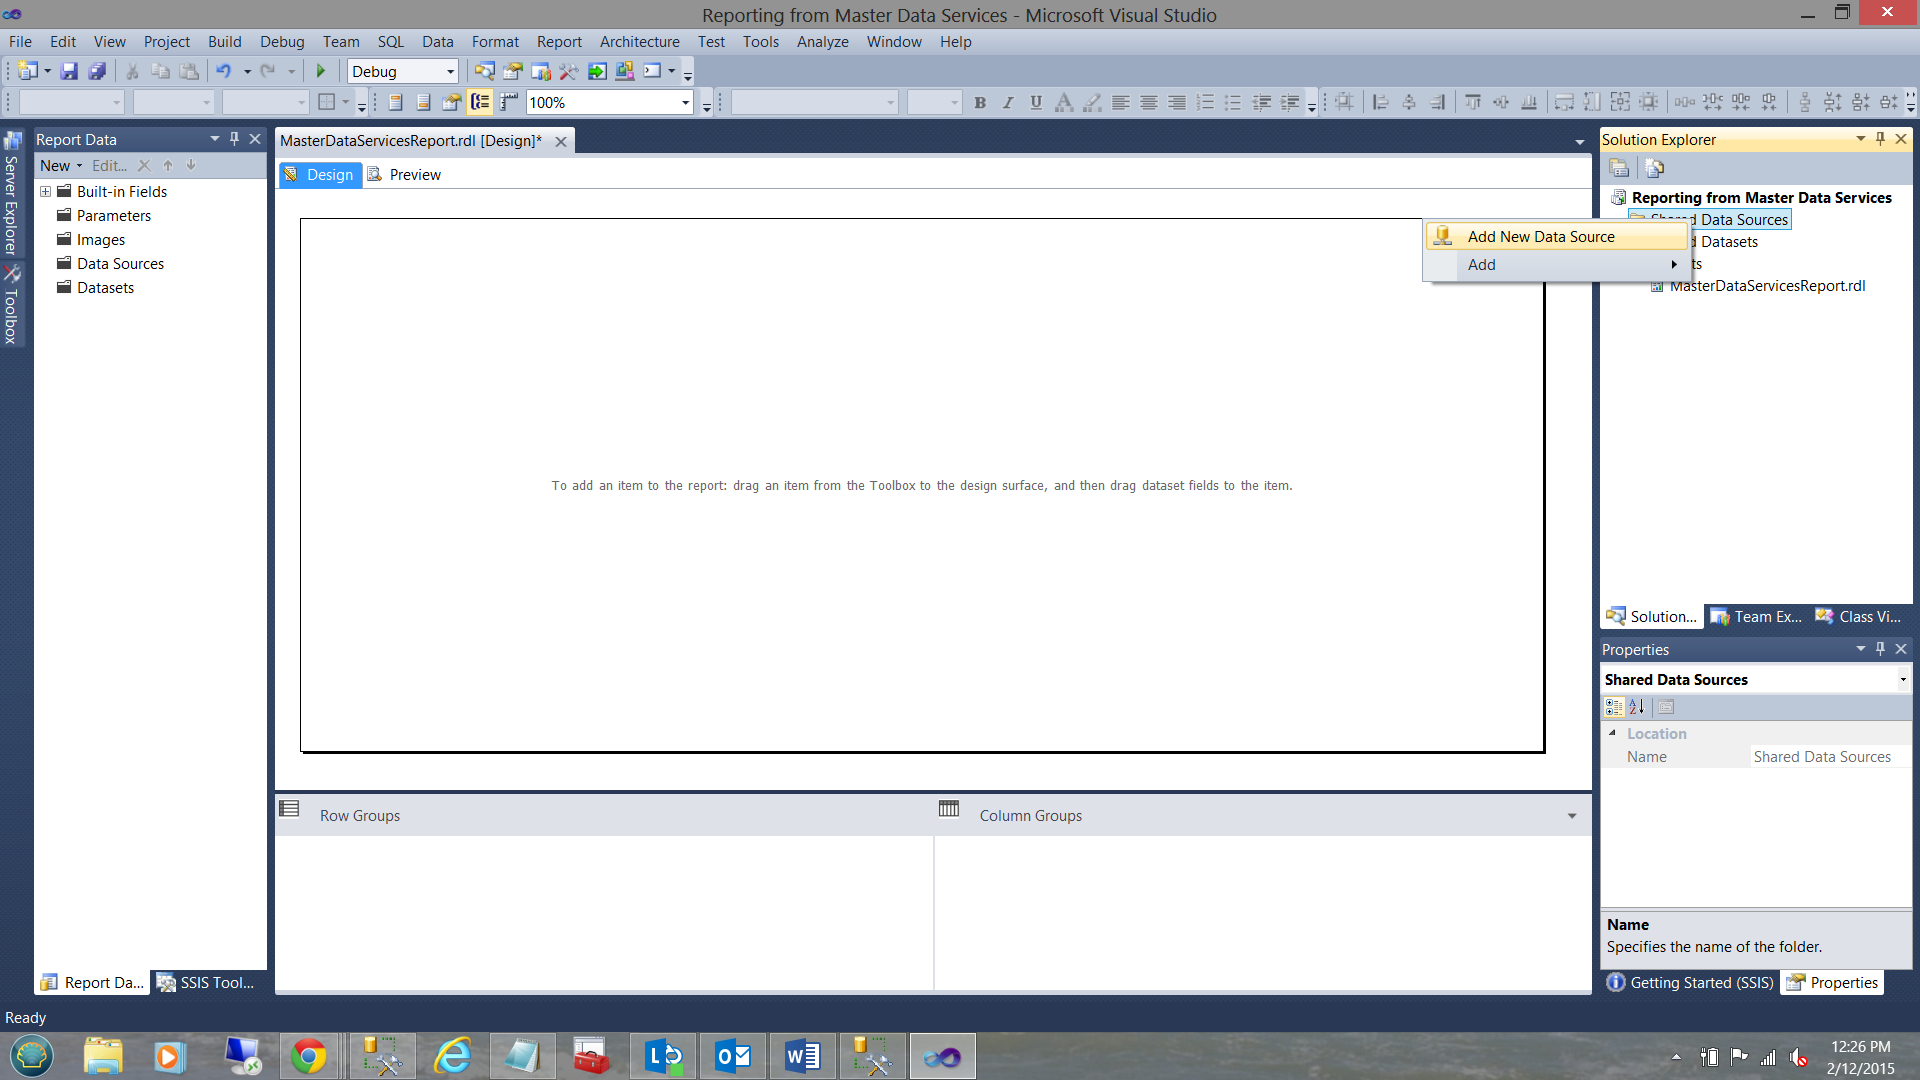
We right click upon the “Shared Data Source” folder. We select “Add New Data Source” (see above and to the right).
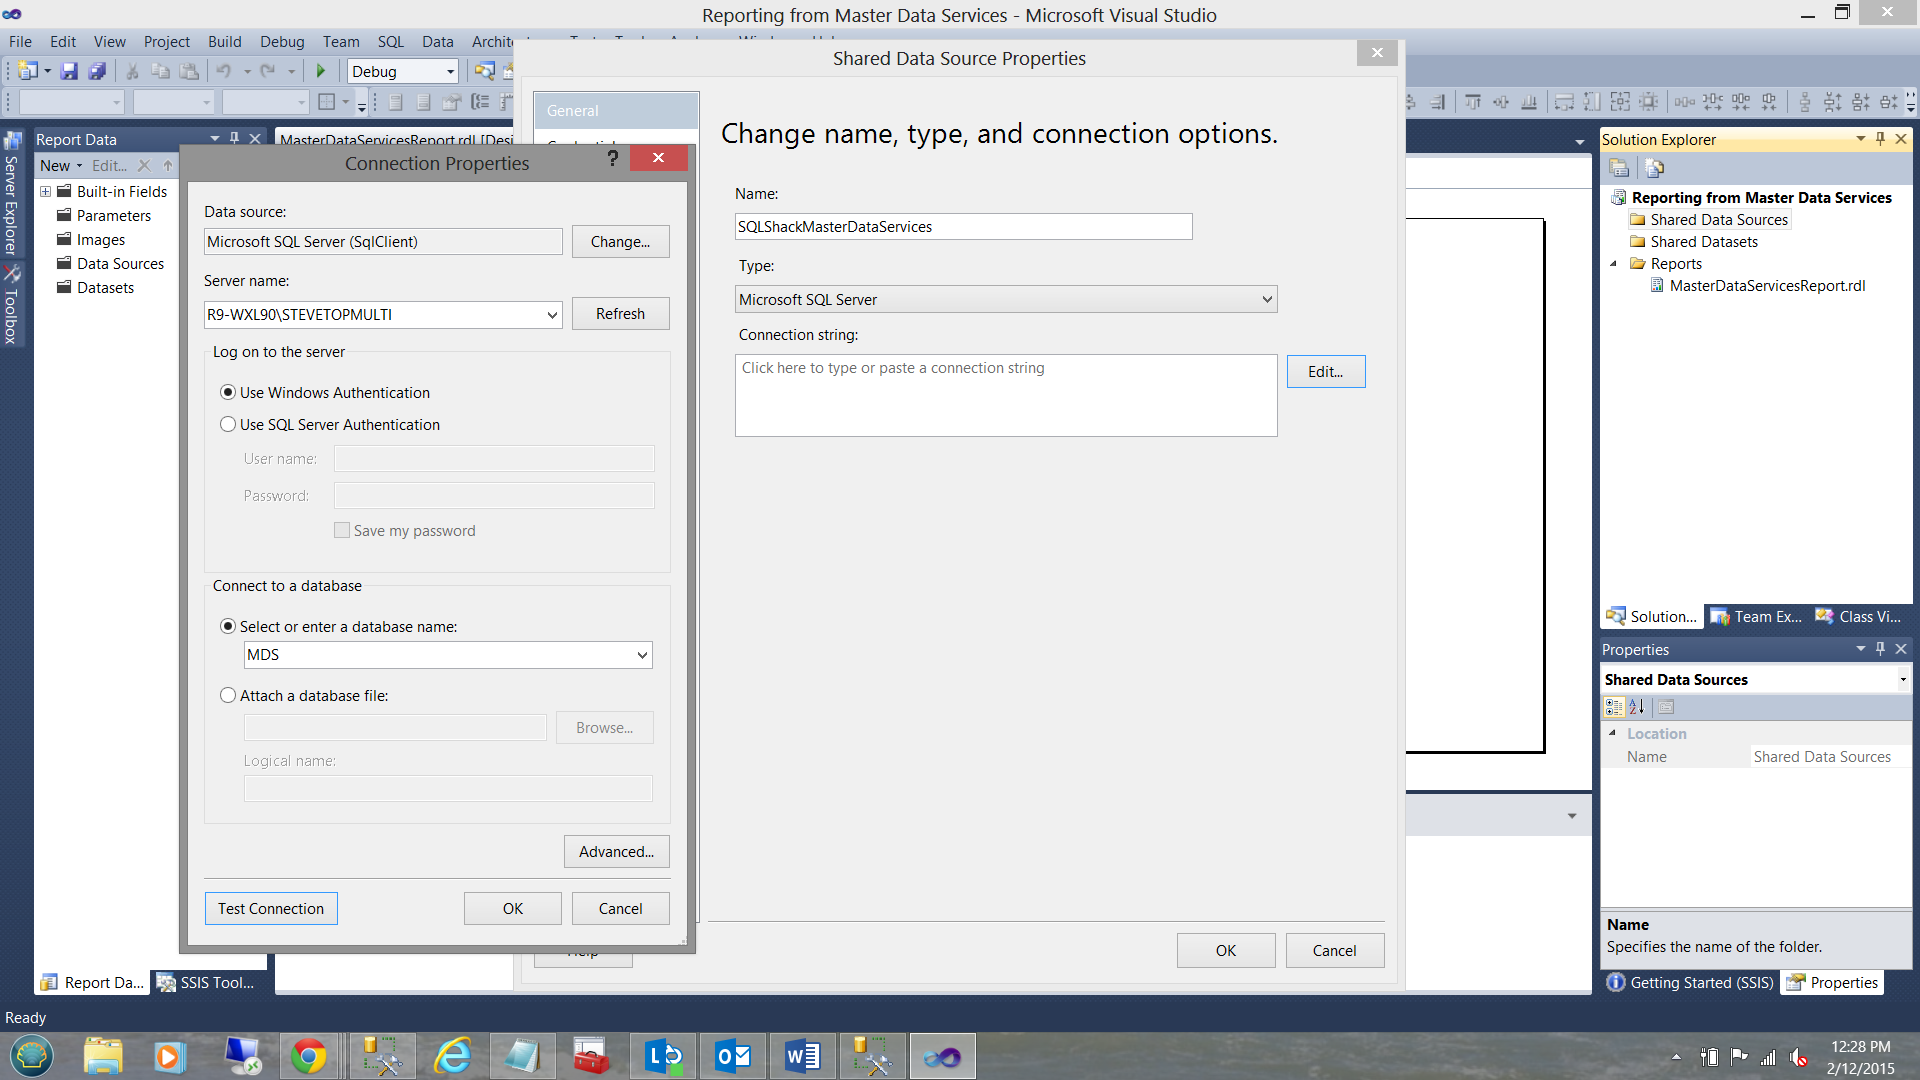
The “Shared Data Source Properties” dialogue box is brought up. We click “Edit” (see above and to the right). The “Connections Properties” dialog box is brought up (see above). We set the server name and select the MDS database for the “Select or enter a database name” option (see above).
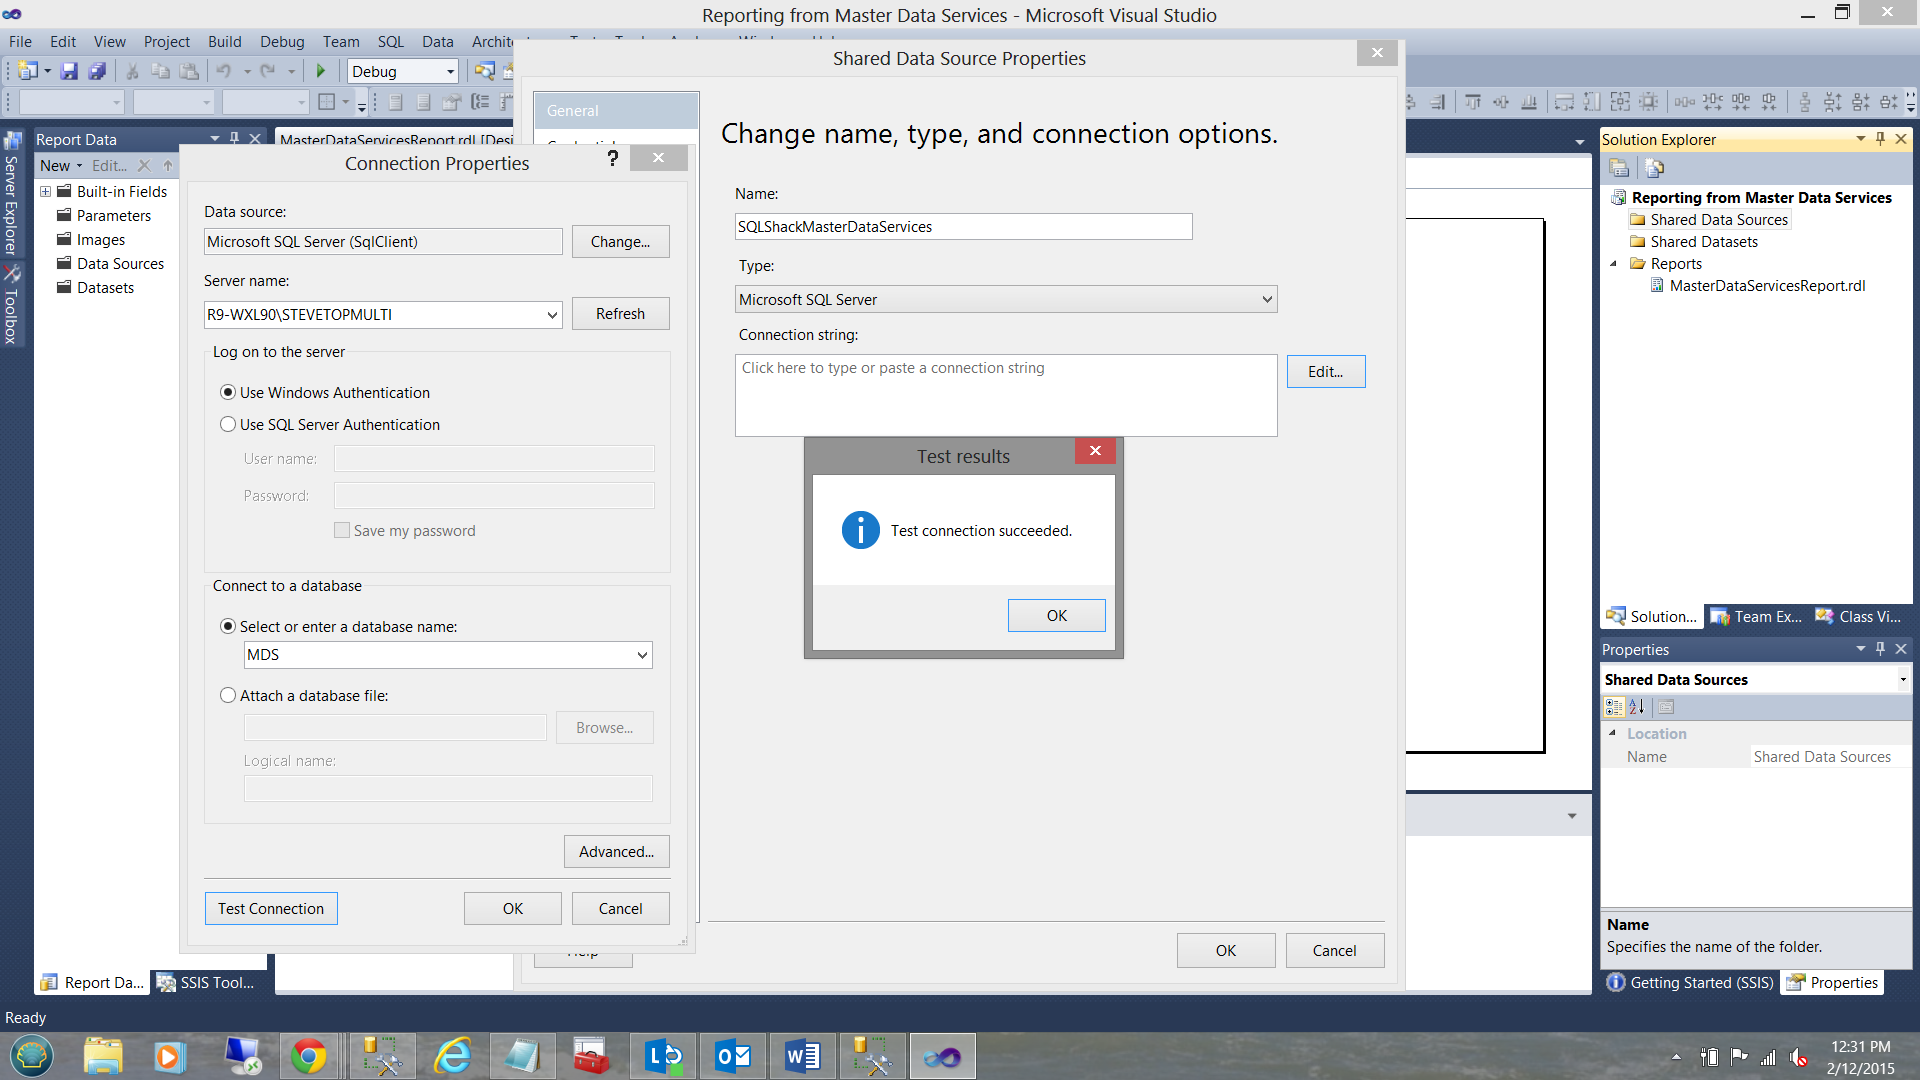
We test the connection (see above). We click OK, OK, and OK to return to our work surface.
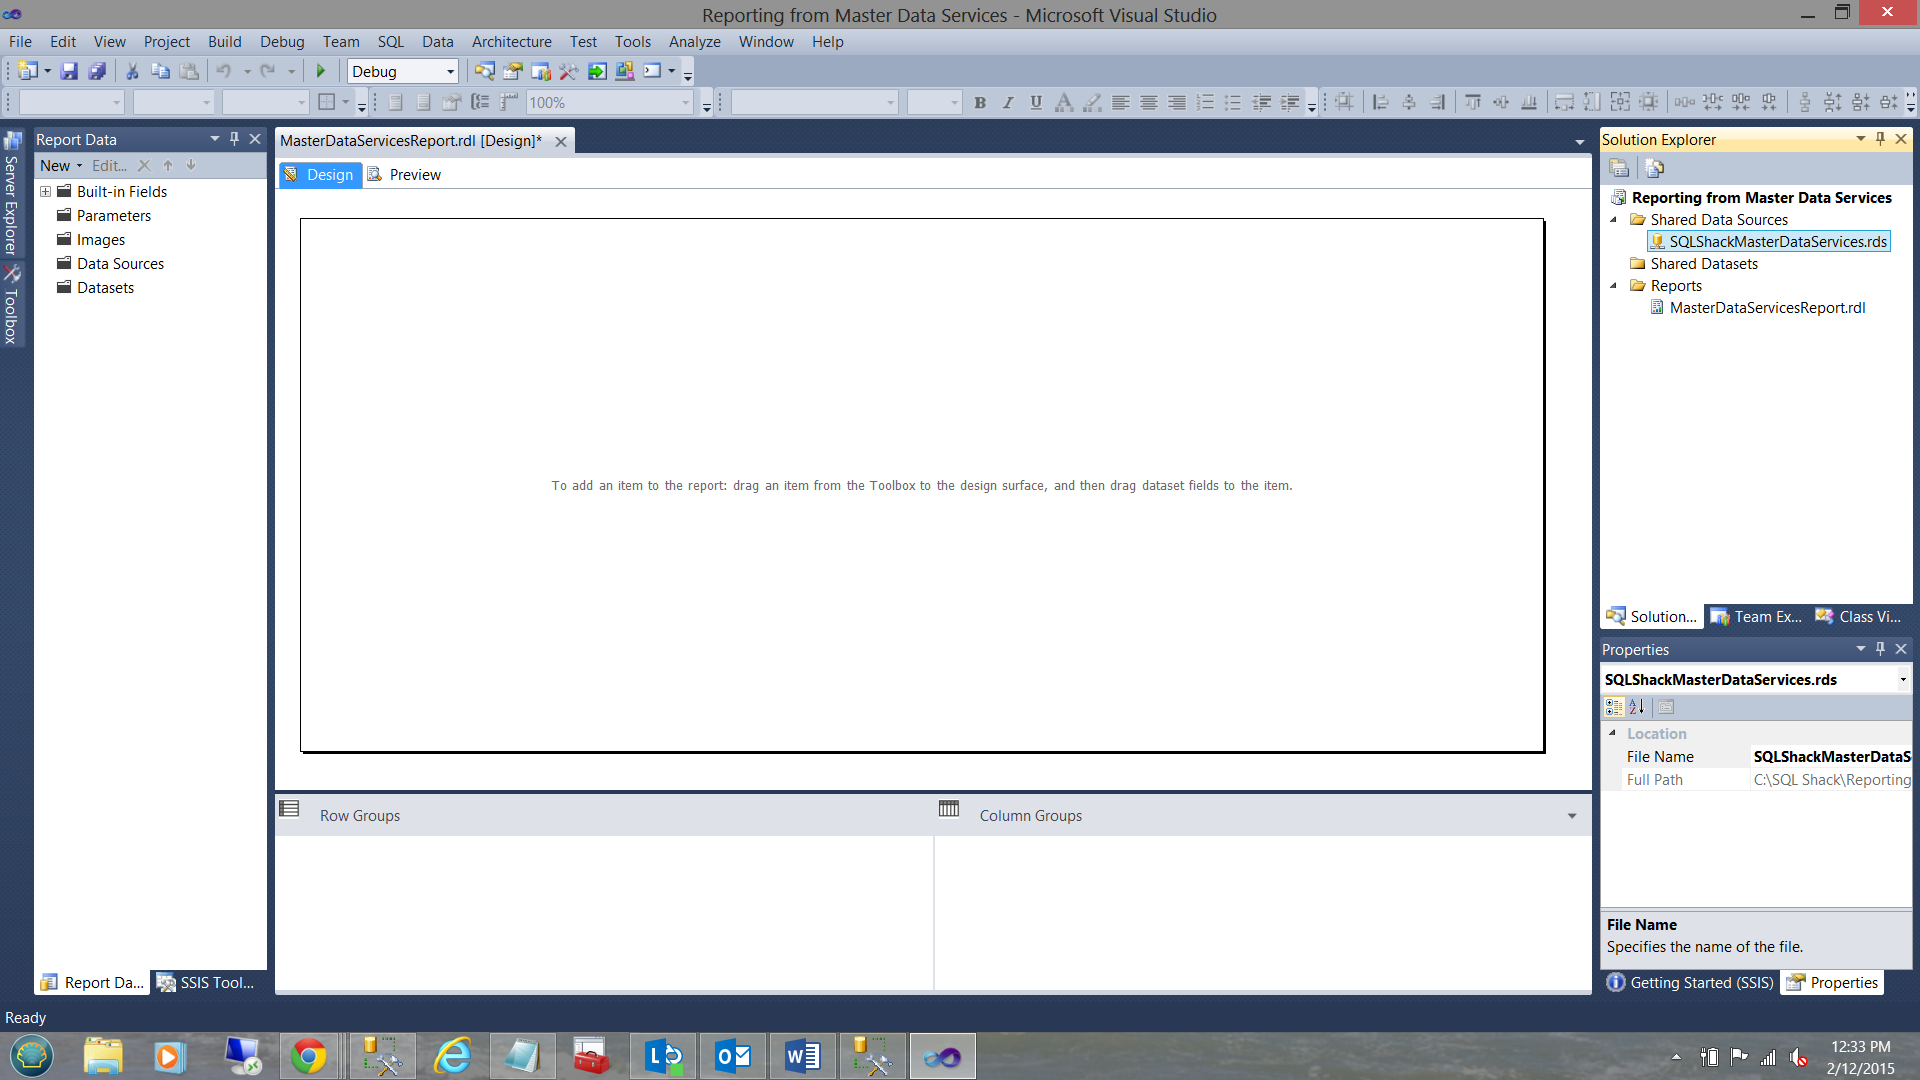
We note that the new shared data source is present in the top right of the screen dump above.
At this point, we create a few datasets, the data from which will be utilized to populate the drop down “pick lists” associated with parameters that we shall create within a few minutes.
Once again, should you be unfamiliar with creating a dataset within Reporting Services, please do have a look at the above mentioned article where I show you in detail how these datasets may be constructed.
For our example, we shall be utilizing only two of the seven attributes, “Color” and “Neck Style”.
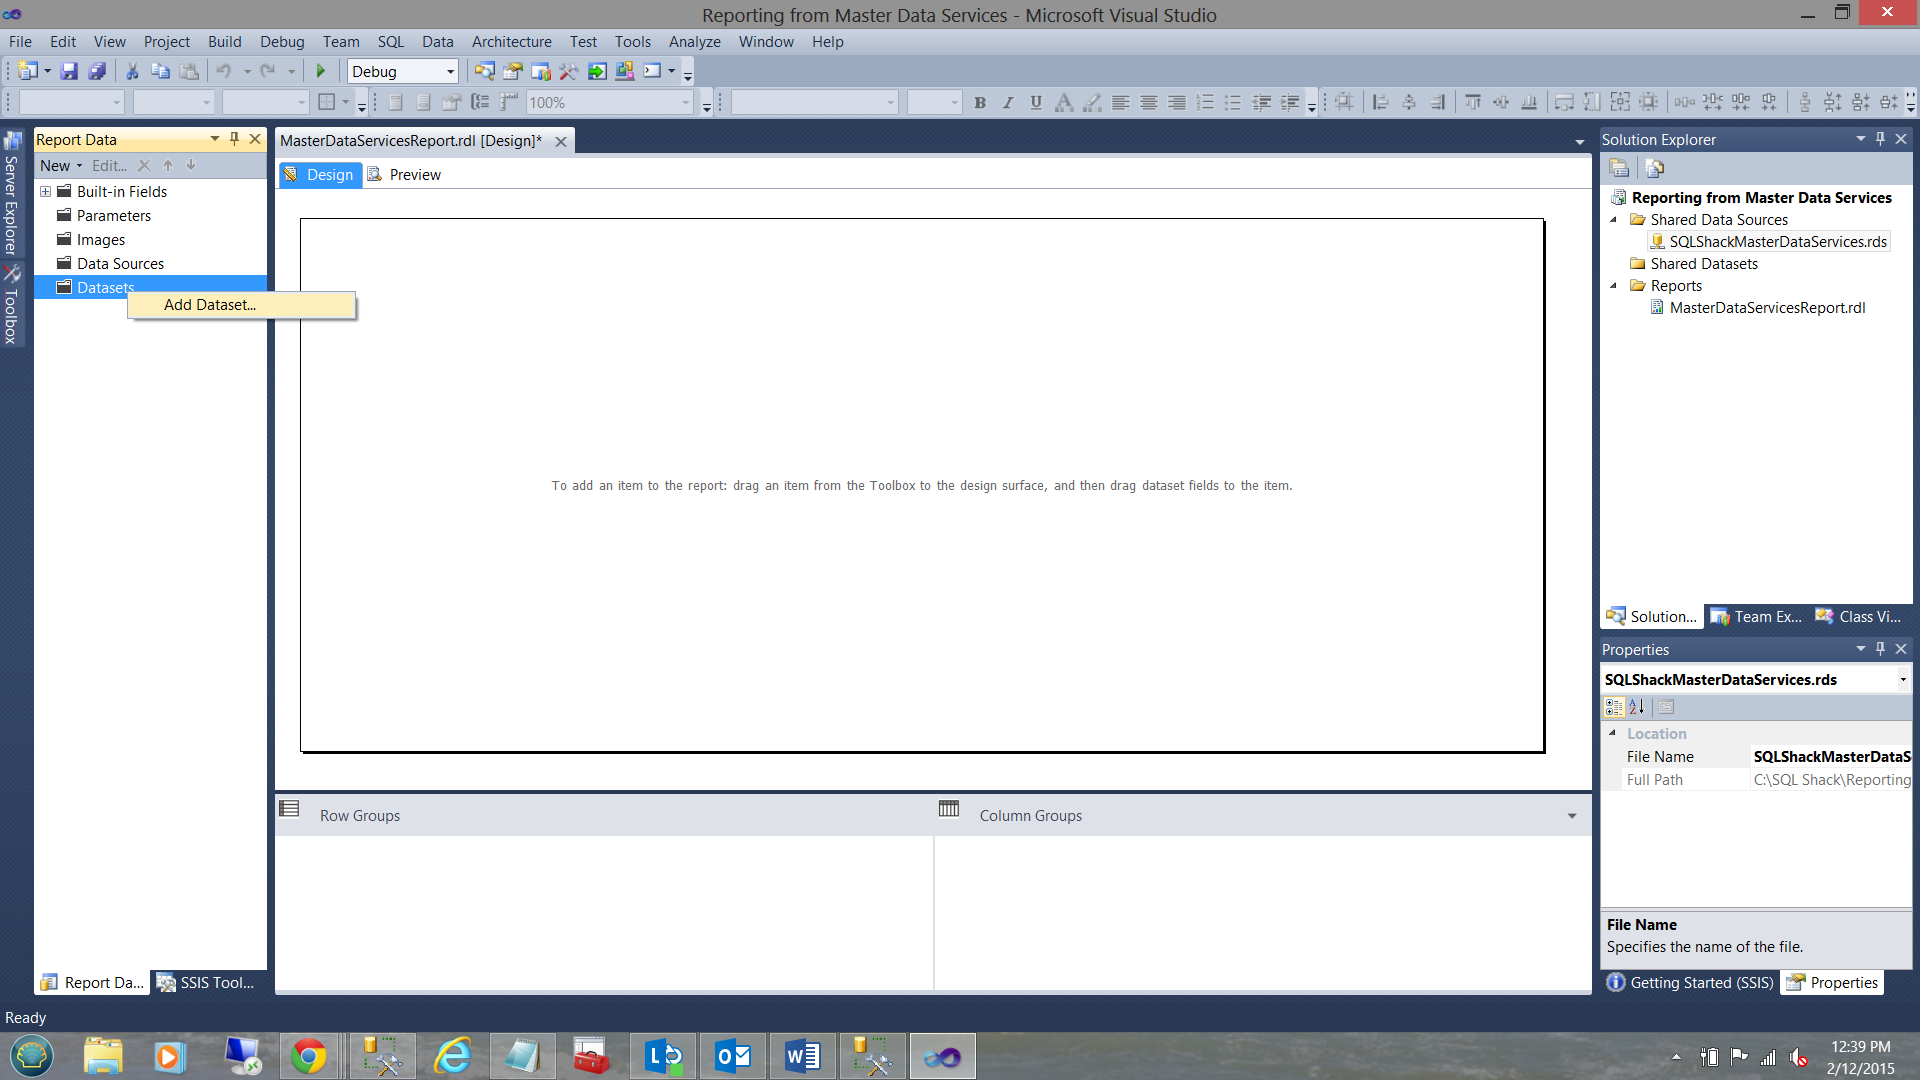
We right click on the “Dataset” folder (see above and to the left) and select “Add Dataset”.
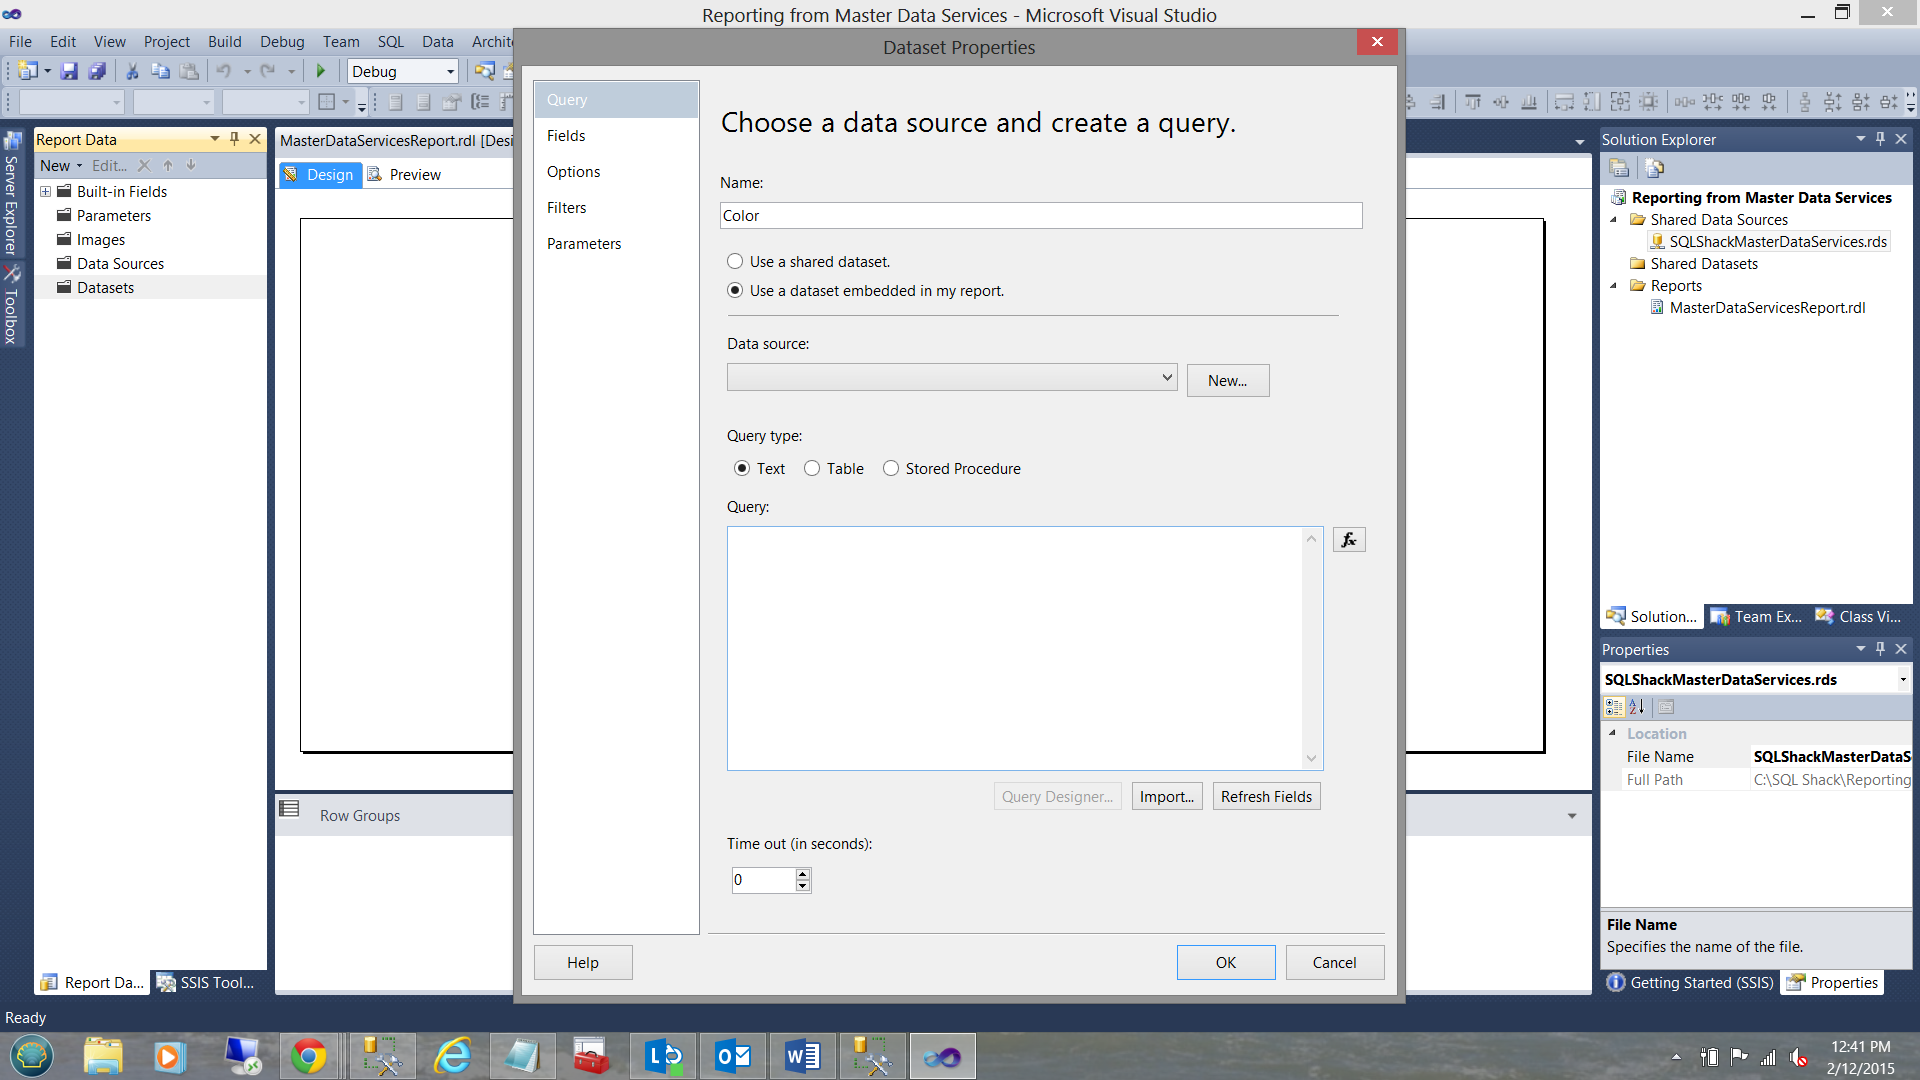
The “Dataset Properties” dialogue box opens. We shall call our dataset “Color”. We choose the “Use a dataset embedded in my report” (see above). We now click the “New” button located to the right of the “Data source” dialogue box.
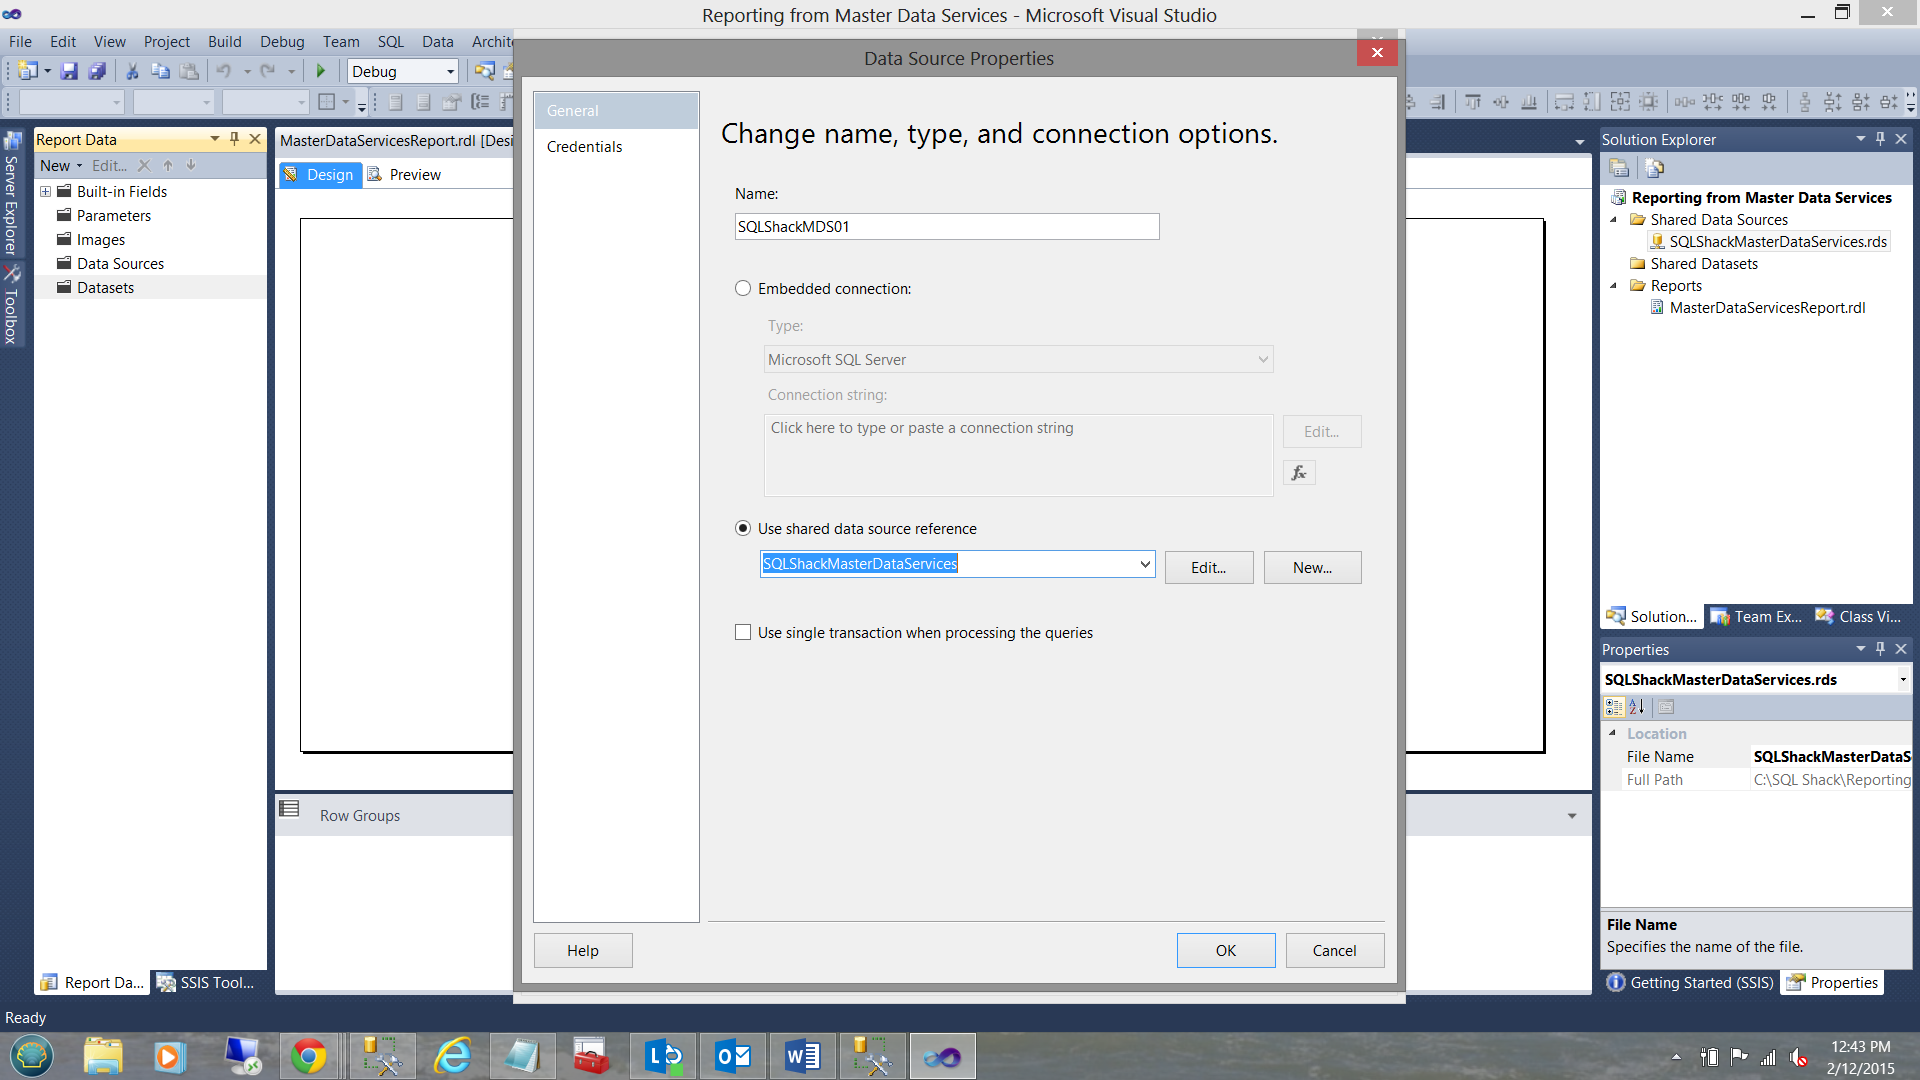
The “Data Source Properties” dialogue box is brought up. We give our local / embedded data source a name and reference this local data source to the “Shared Data Source” that we created a few minutes ago (see above). We click OK to continue.
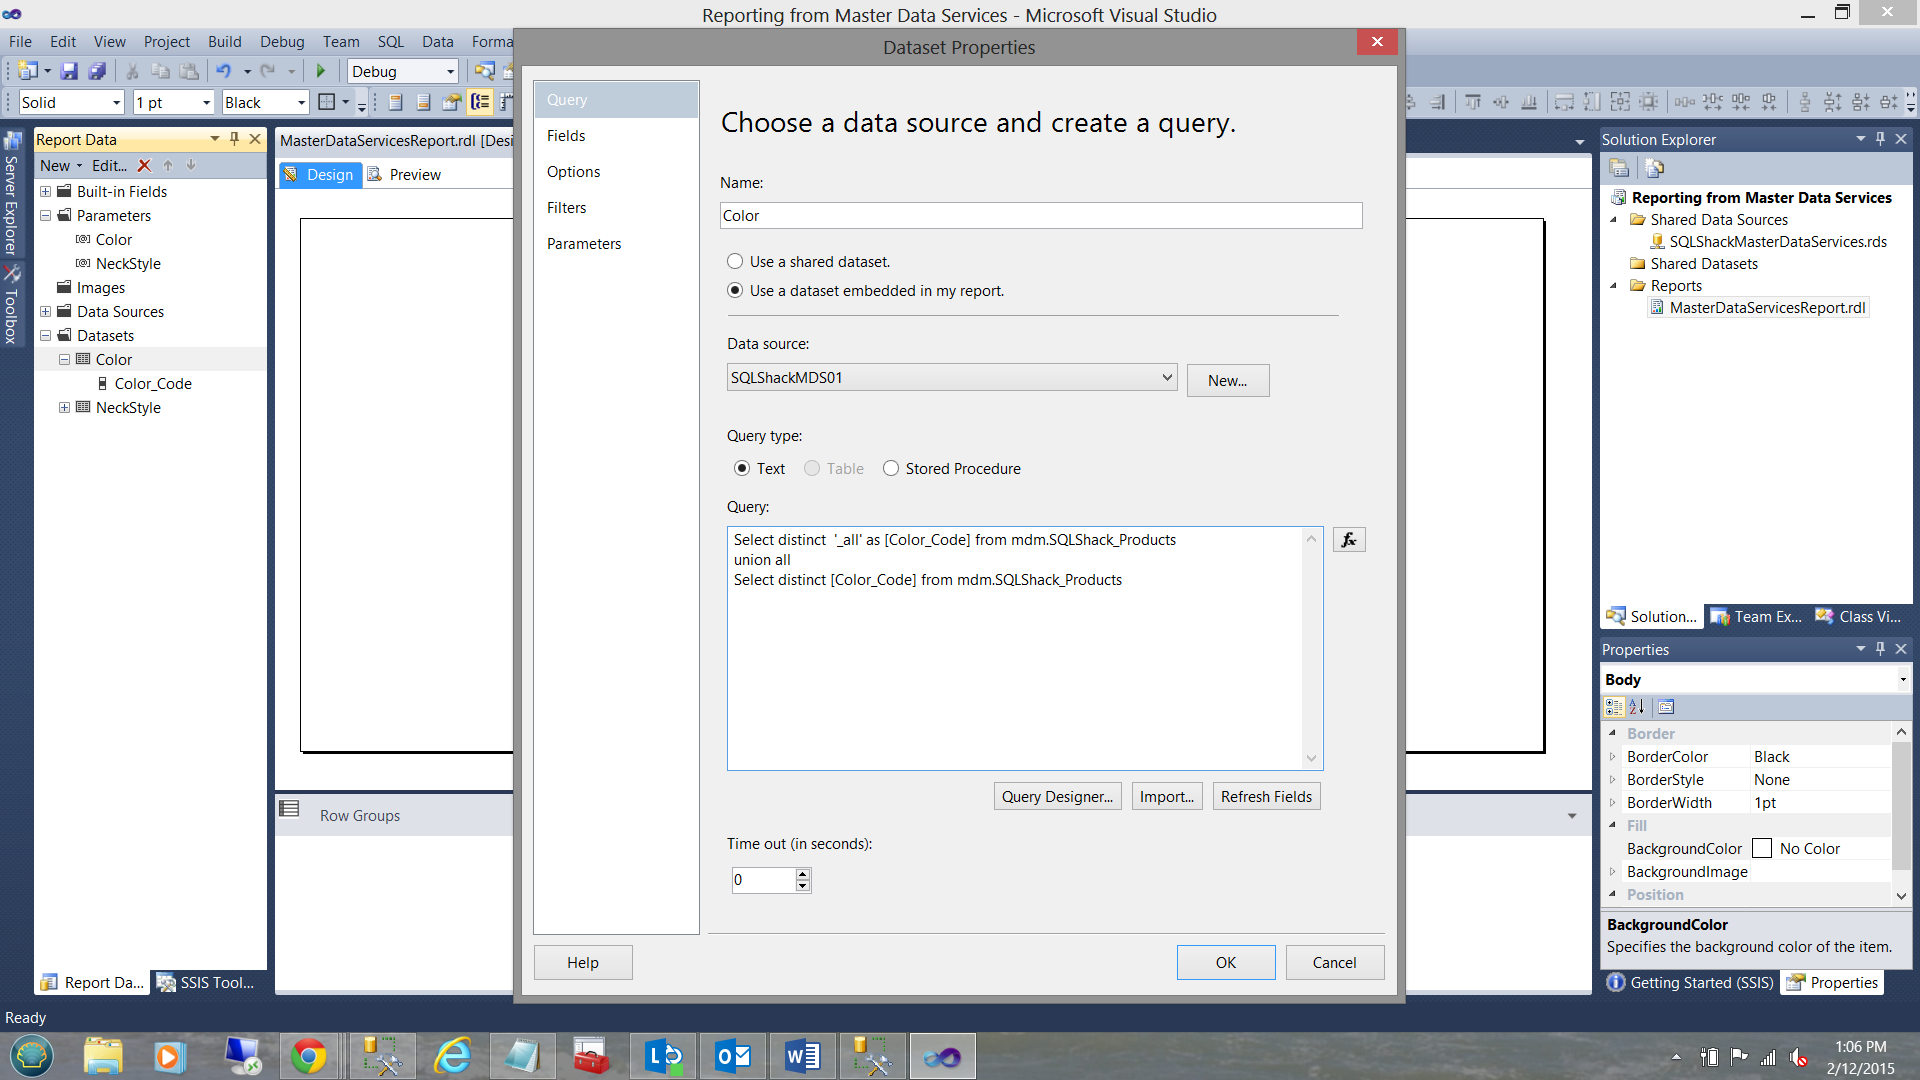
As opposed to creating a Stored Procedure to populate this dataset, we choose to utilize T-SQL as the query is fairly straight forward.
|
1 2 3 4 5 |
Select distinct ‘_all’ as [Color_Code] from mdm.SQLShack_Products Union all Select distinct [Color_Code] from mdm.SQLShack_Products |
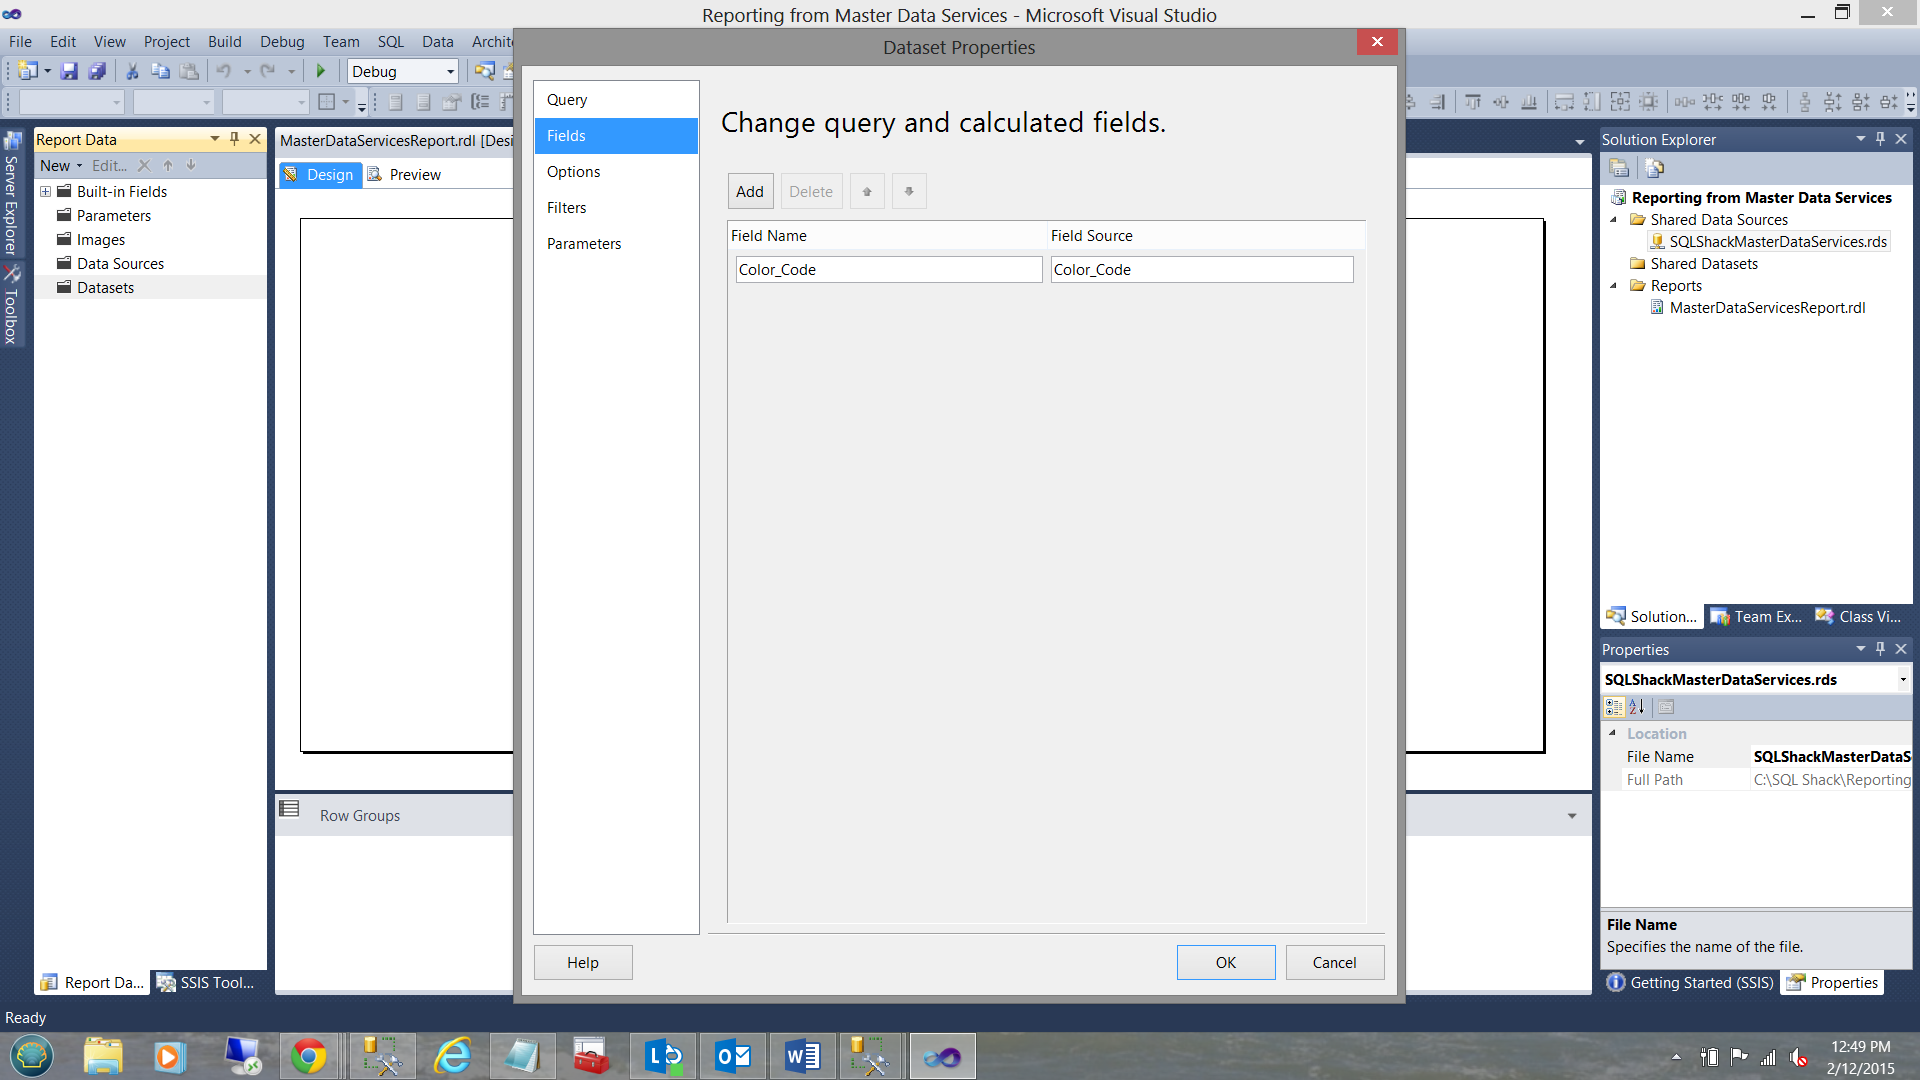
Clicking the “Fields” tab we see that this dataset will return the “Color_Code” from the view.
We click OK to create the dataset.
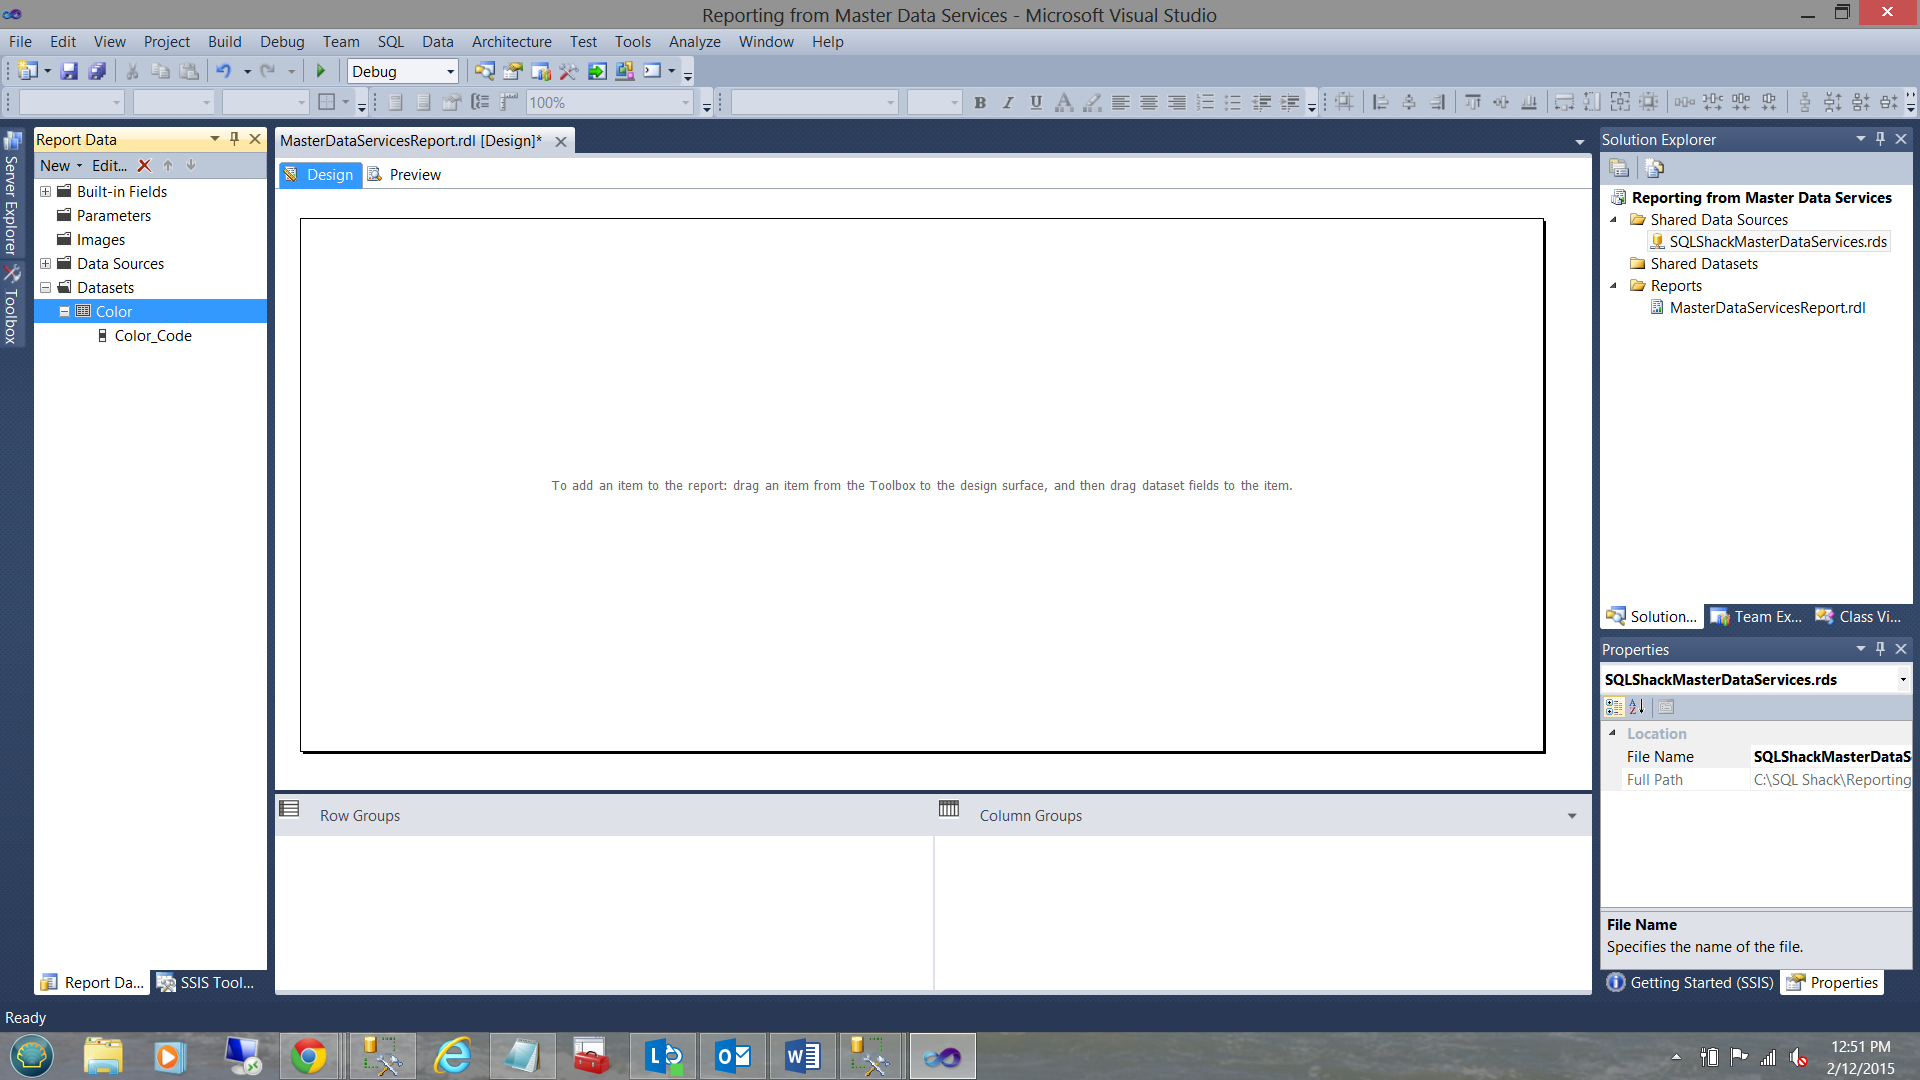
Our newly created dataset may be seen in the screen dump above.
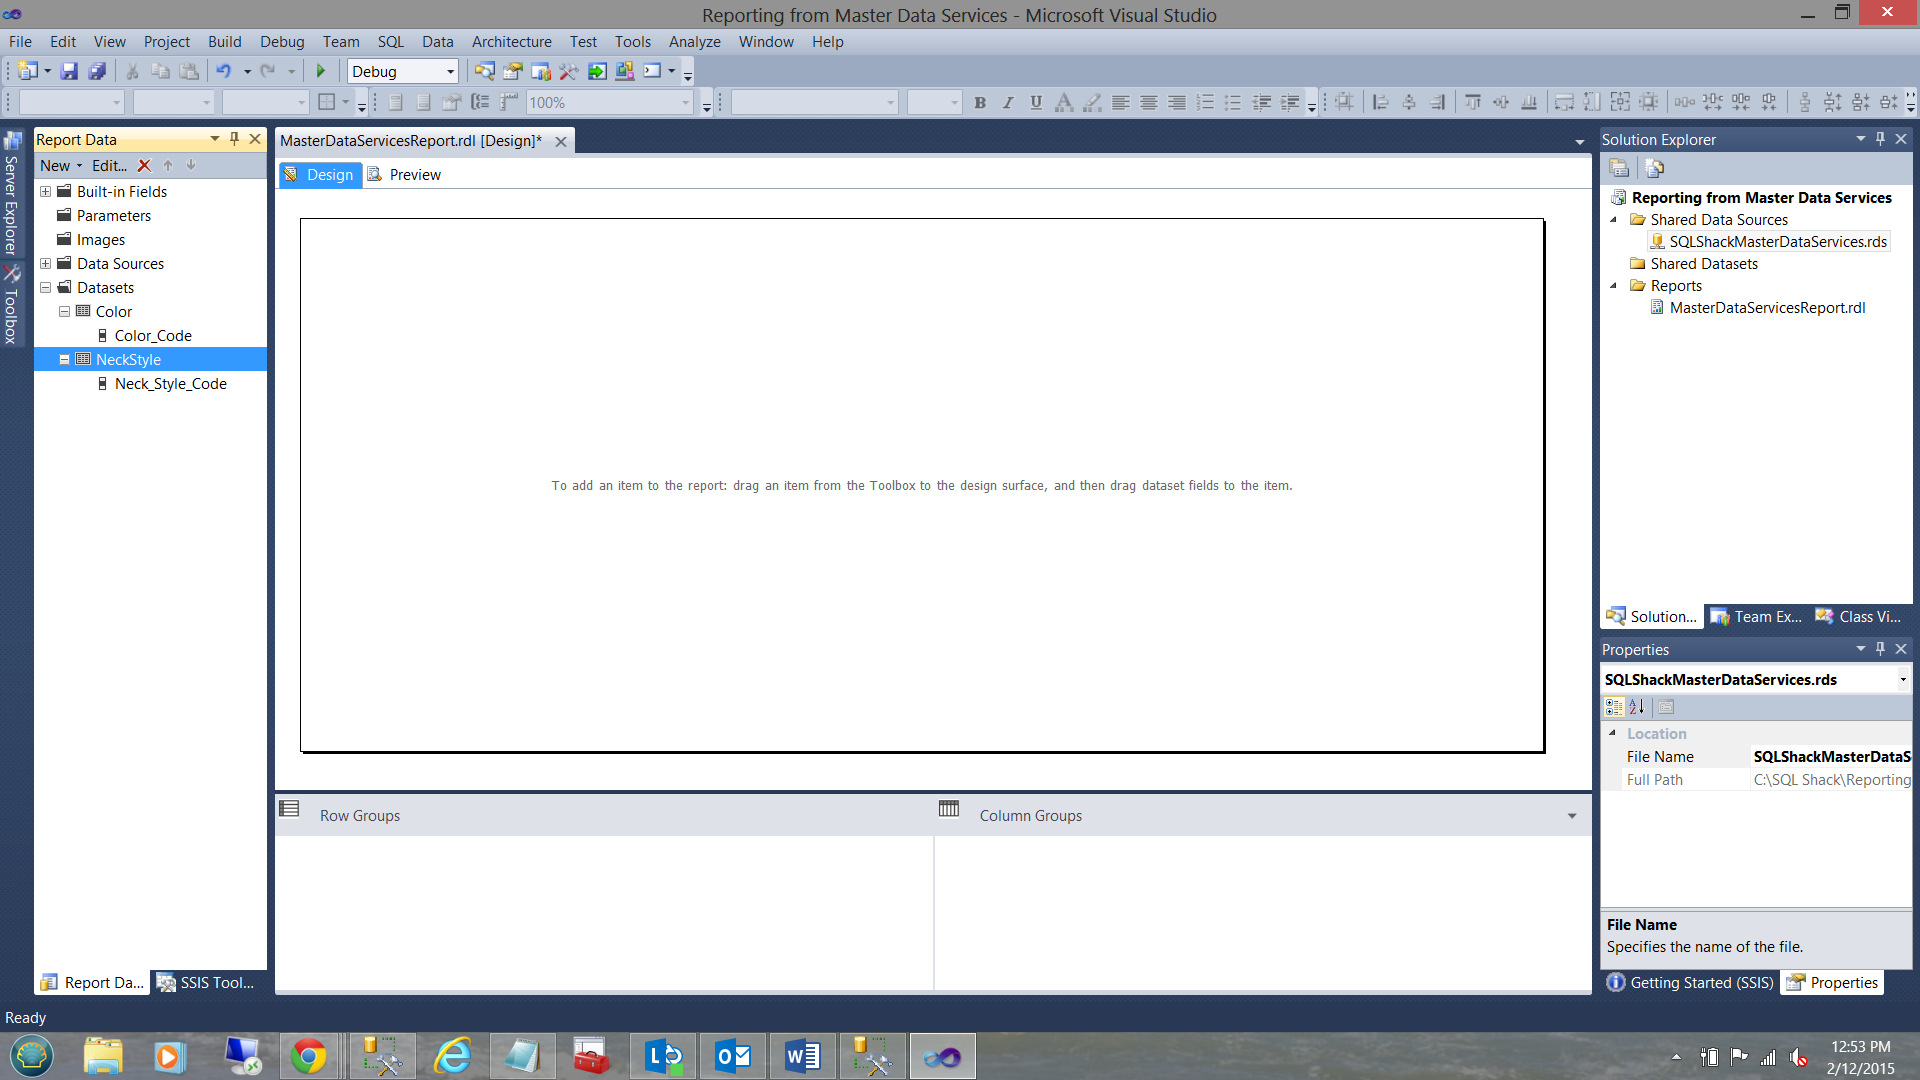
In a similar fashion we create a “Neck Style” dataset as well (see above).
Creating a few parameters for our reporting
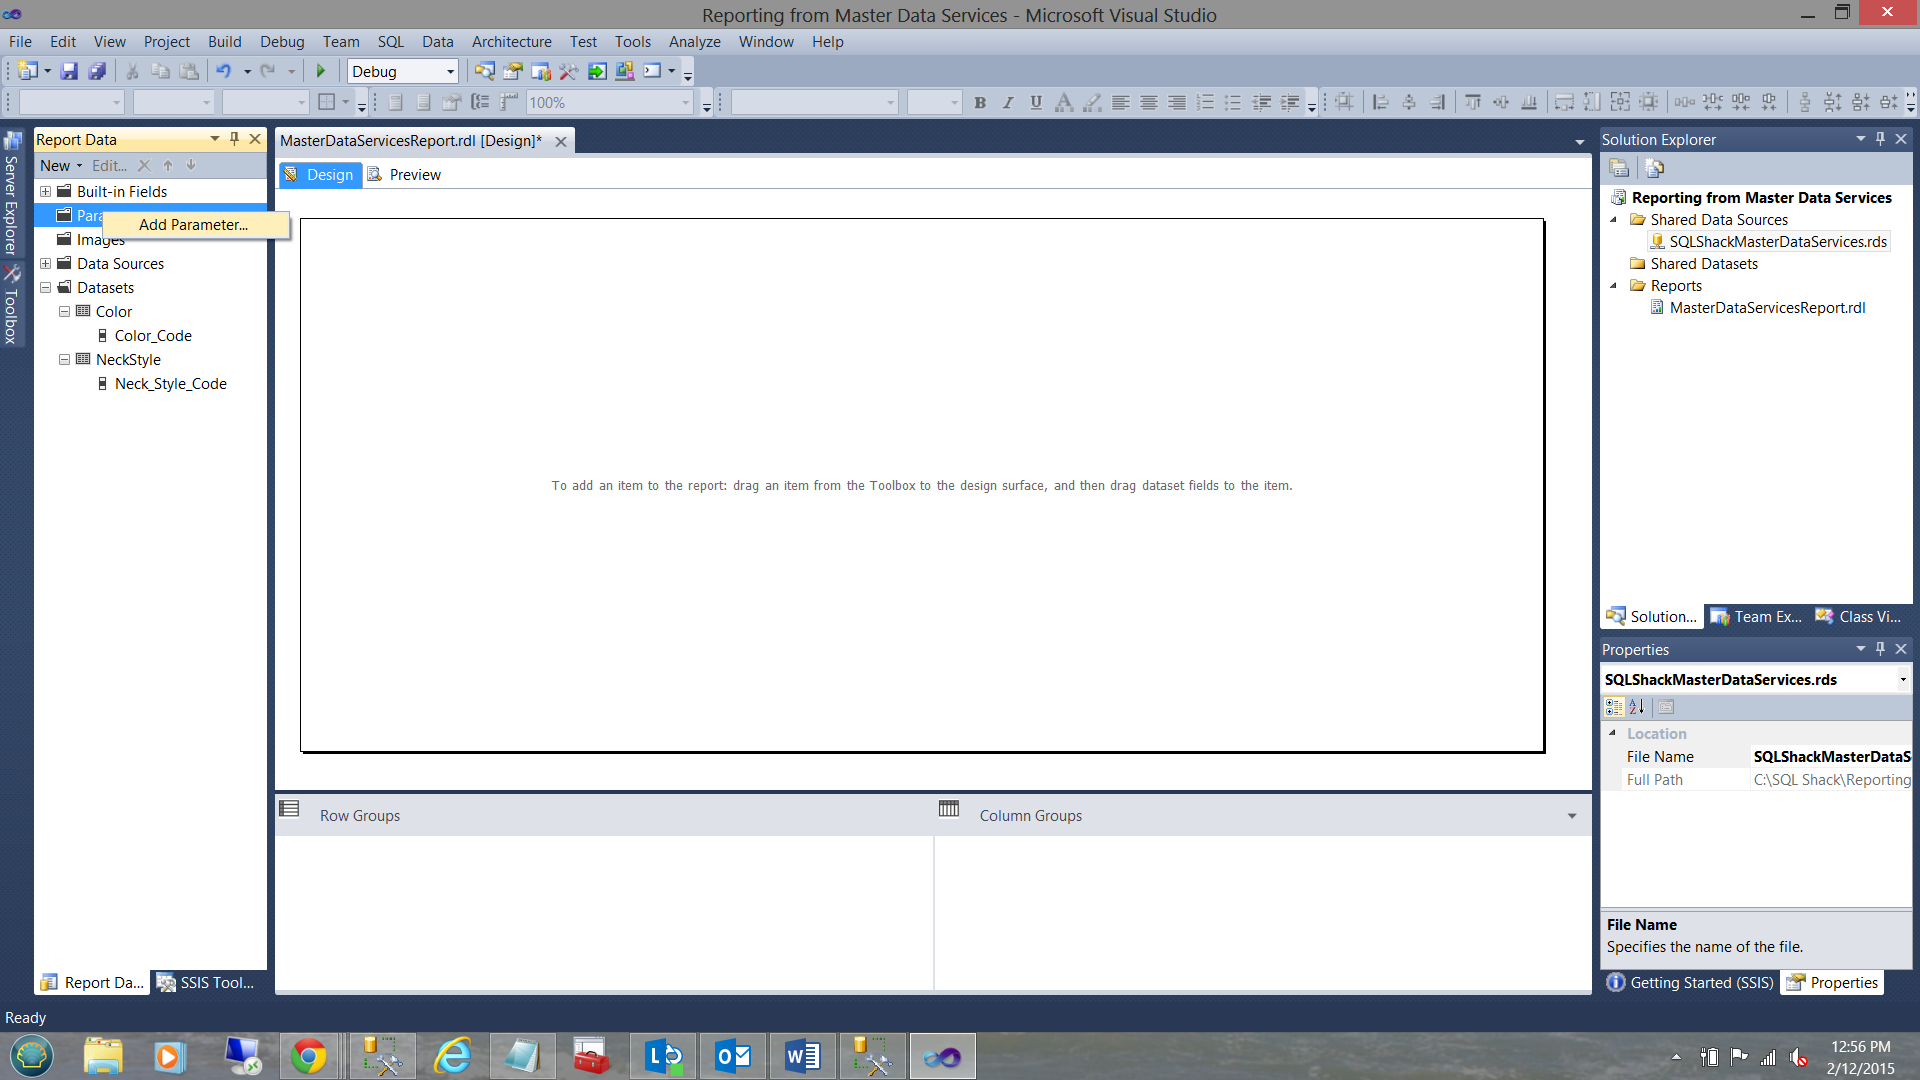
To begin creating the necessary parameters for our new report, we right click upon the “Parameters” folder in the top left of the screen dump above. From the context menu we select “Add Parameter”.
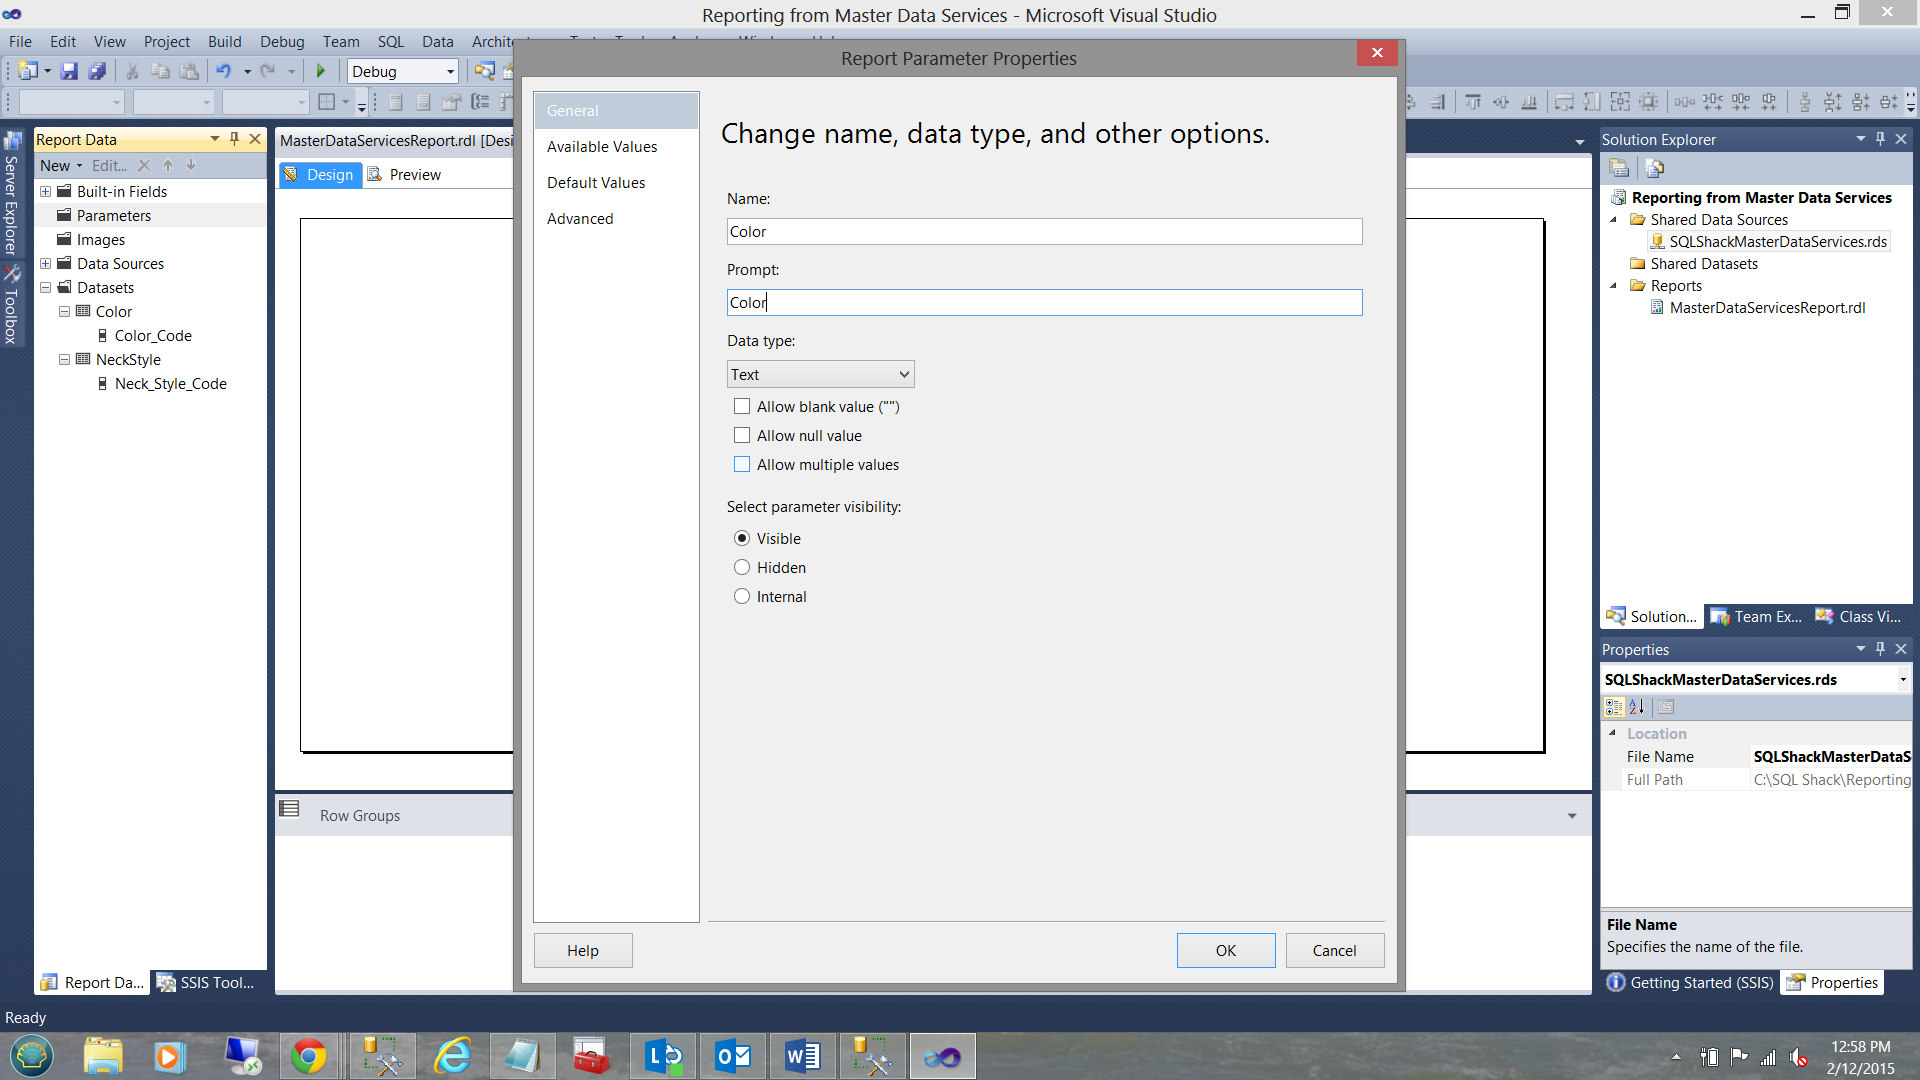
The “Report Parameter Properties” dialogue box opens. We give our parameter the name “Color” (see above).
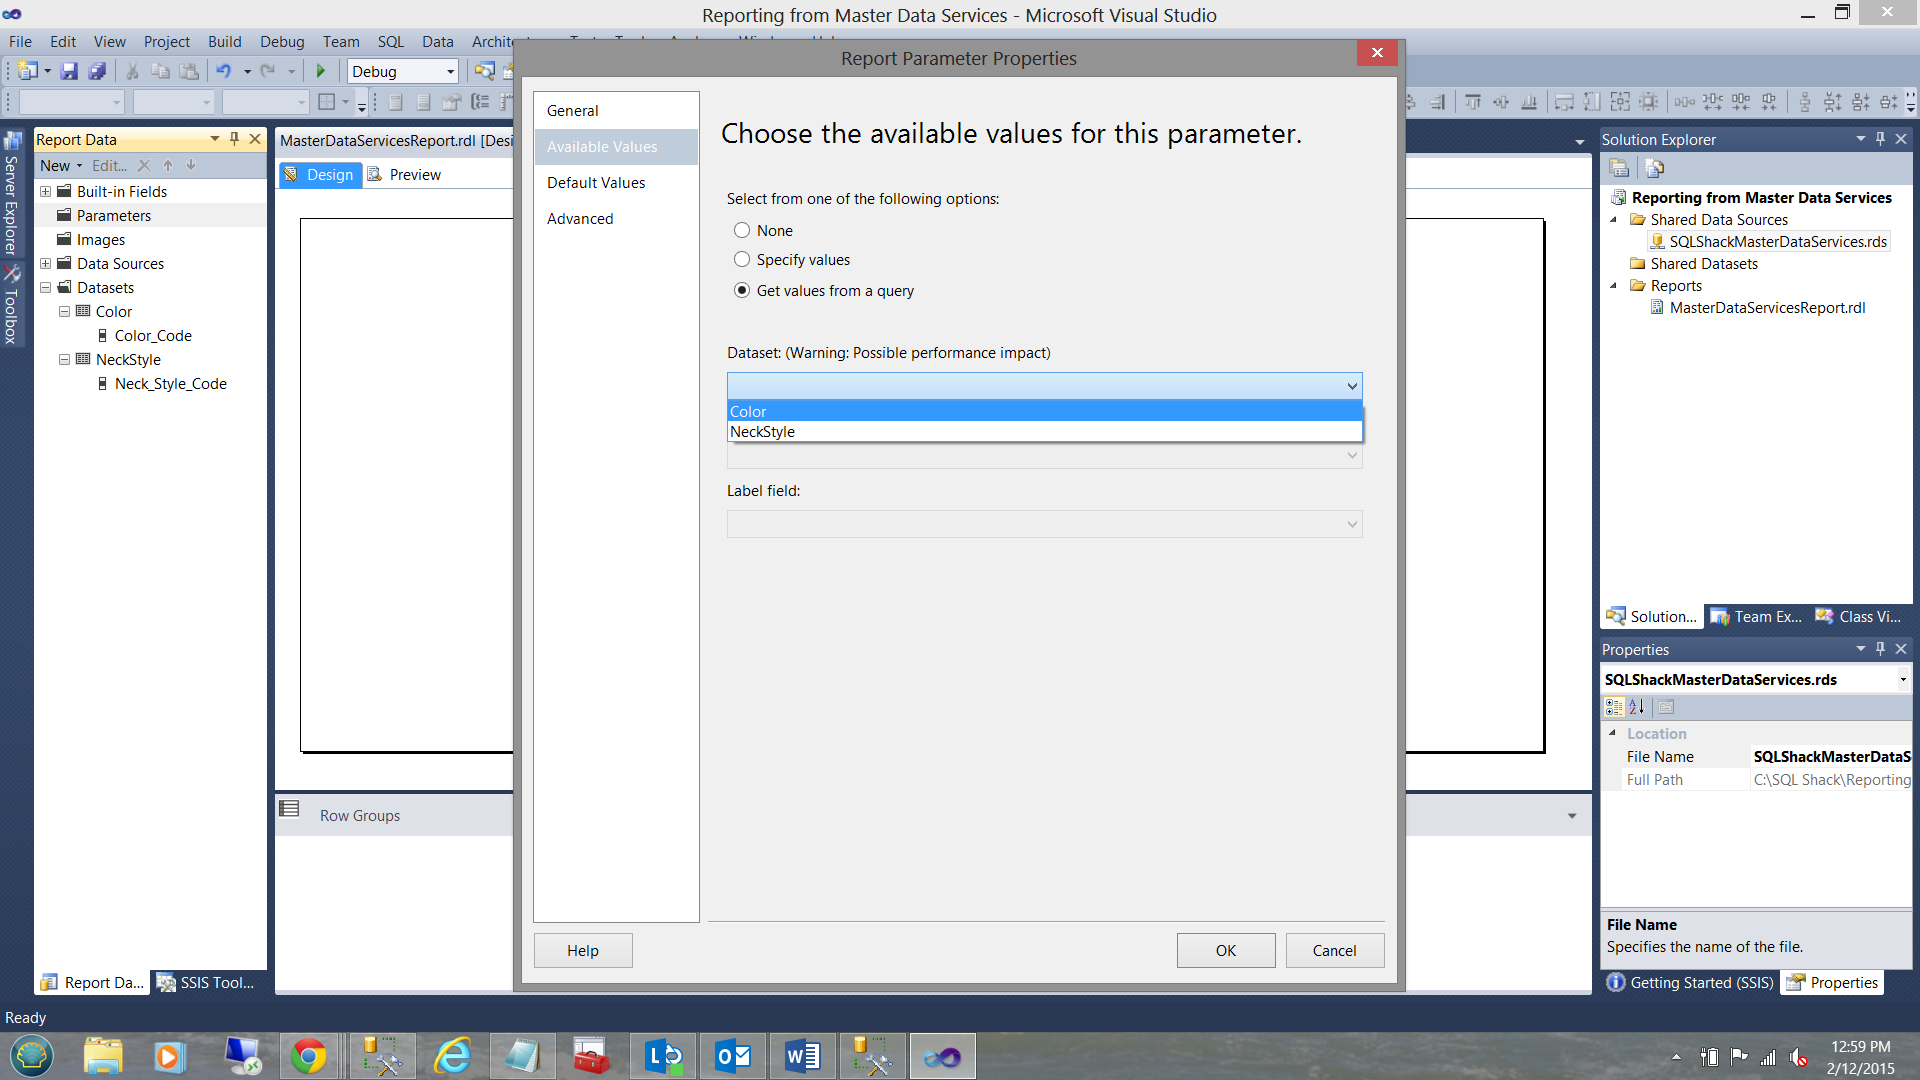
Clicking on the “Available Values” tab, we select the “Get values from a query” option and select the “Color” dataset shown in the “pick list” above.
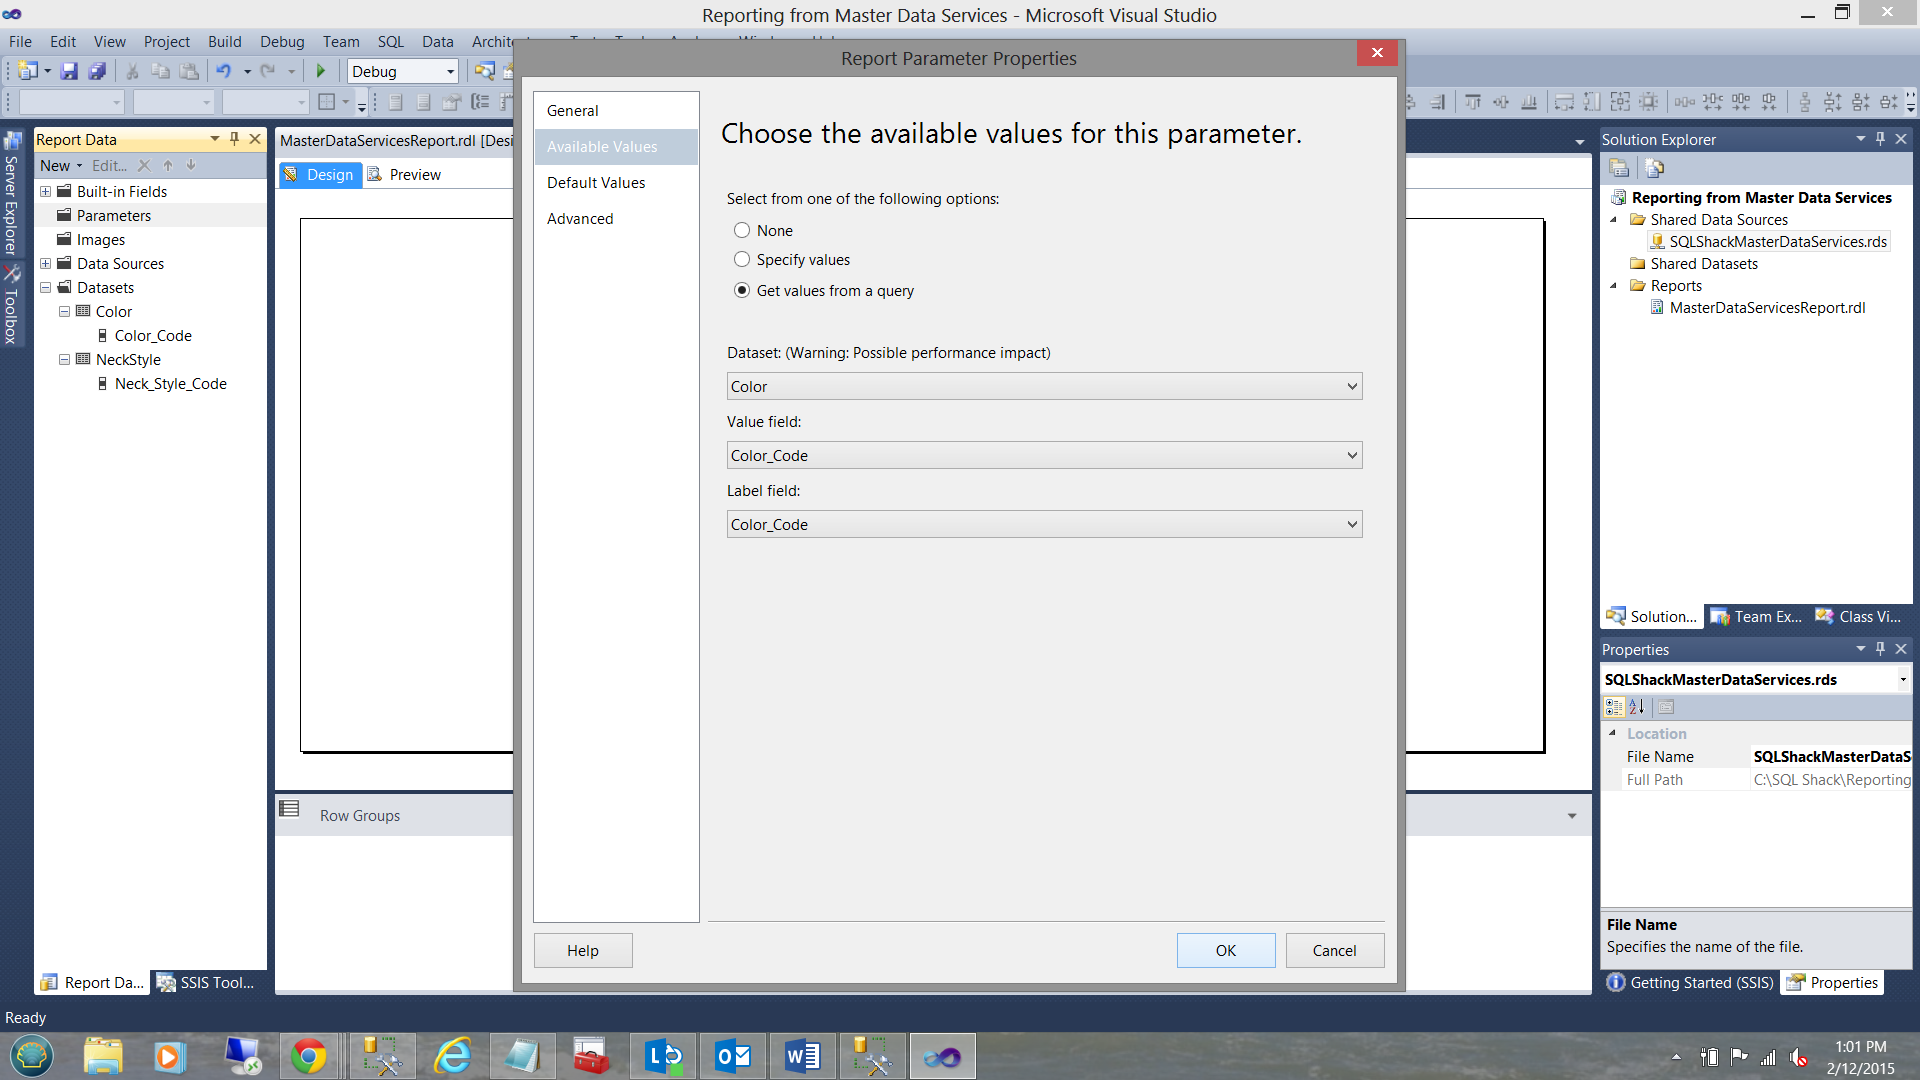
We set the “Value Field” and the “Label Field” to “Color_Code” (see above). We click OK to exit the dialogue box.
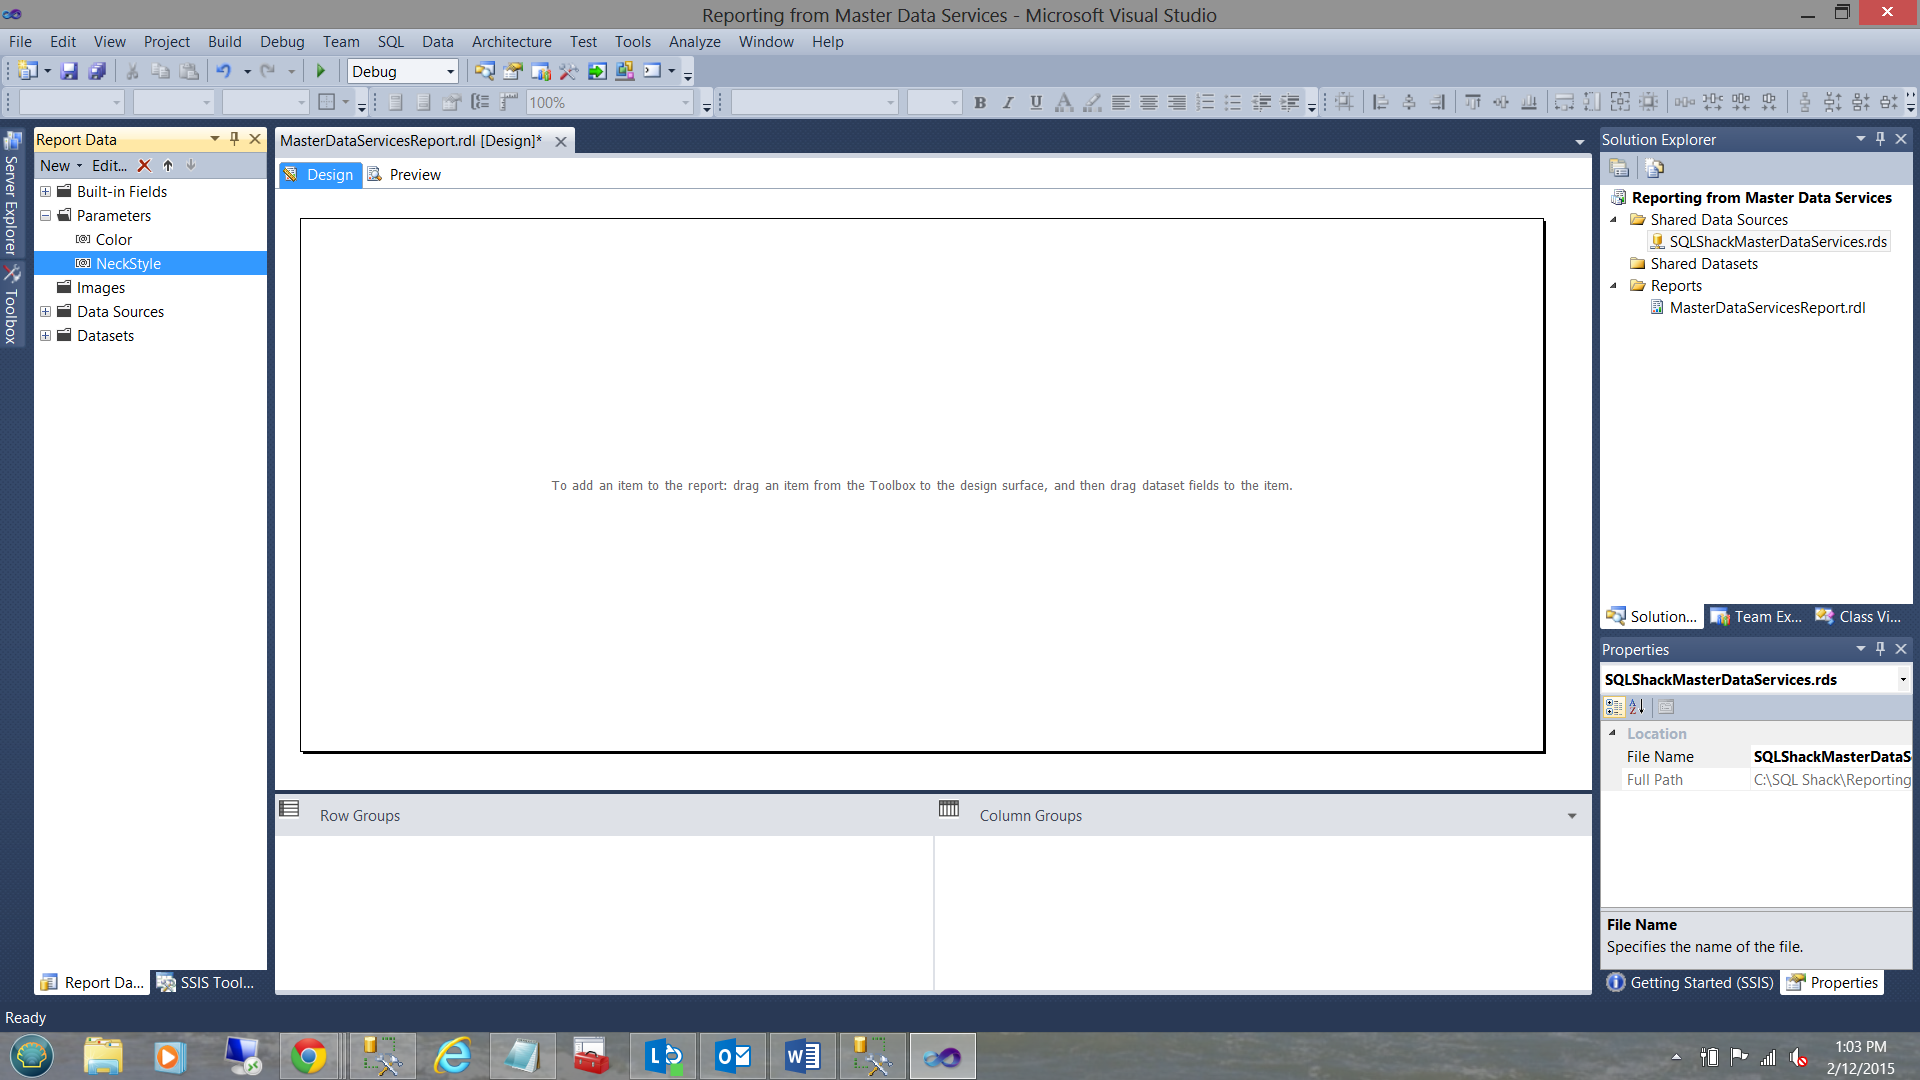
In a similar fashion, we create the “Neck Style” parameter.
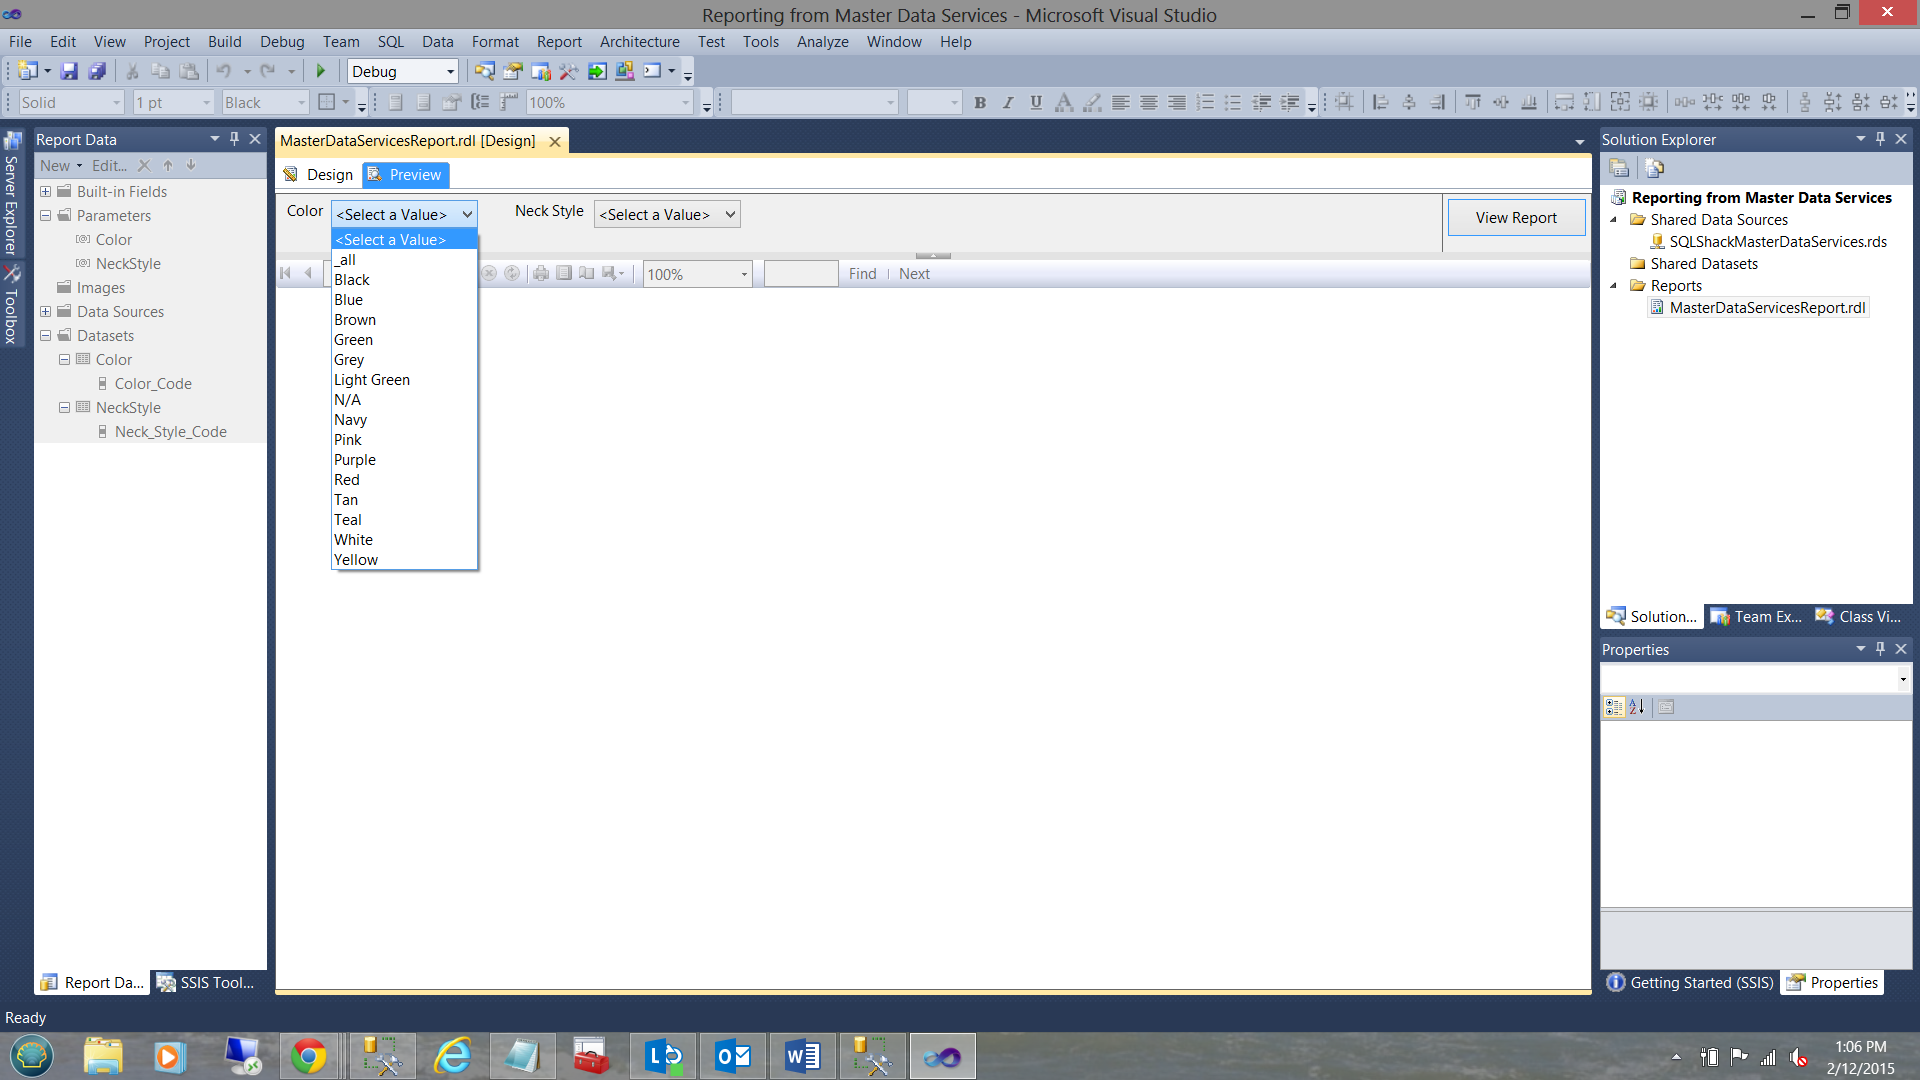
Previewing what we have thus far, we are able to see the “Color” “pick list” that has populated the “Color” parameter box.
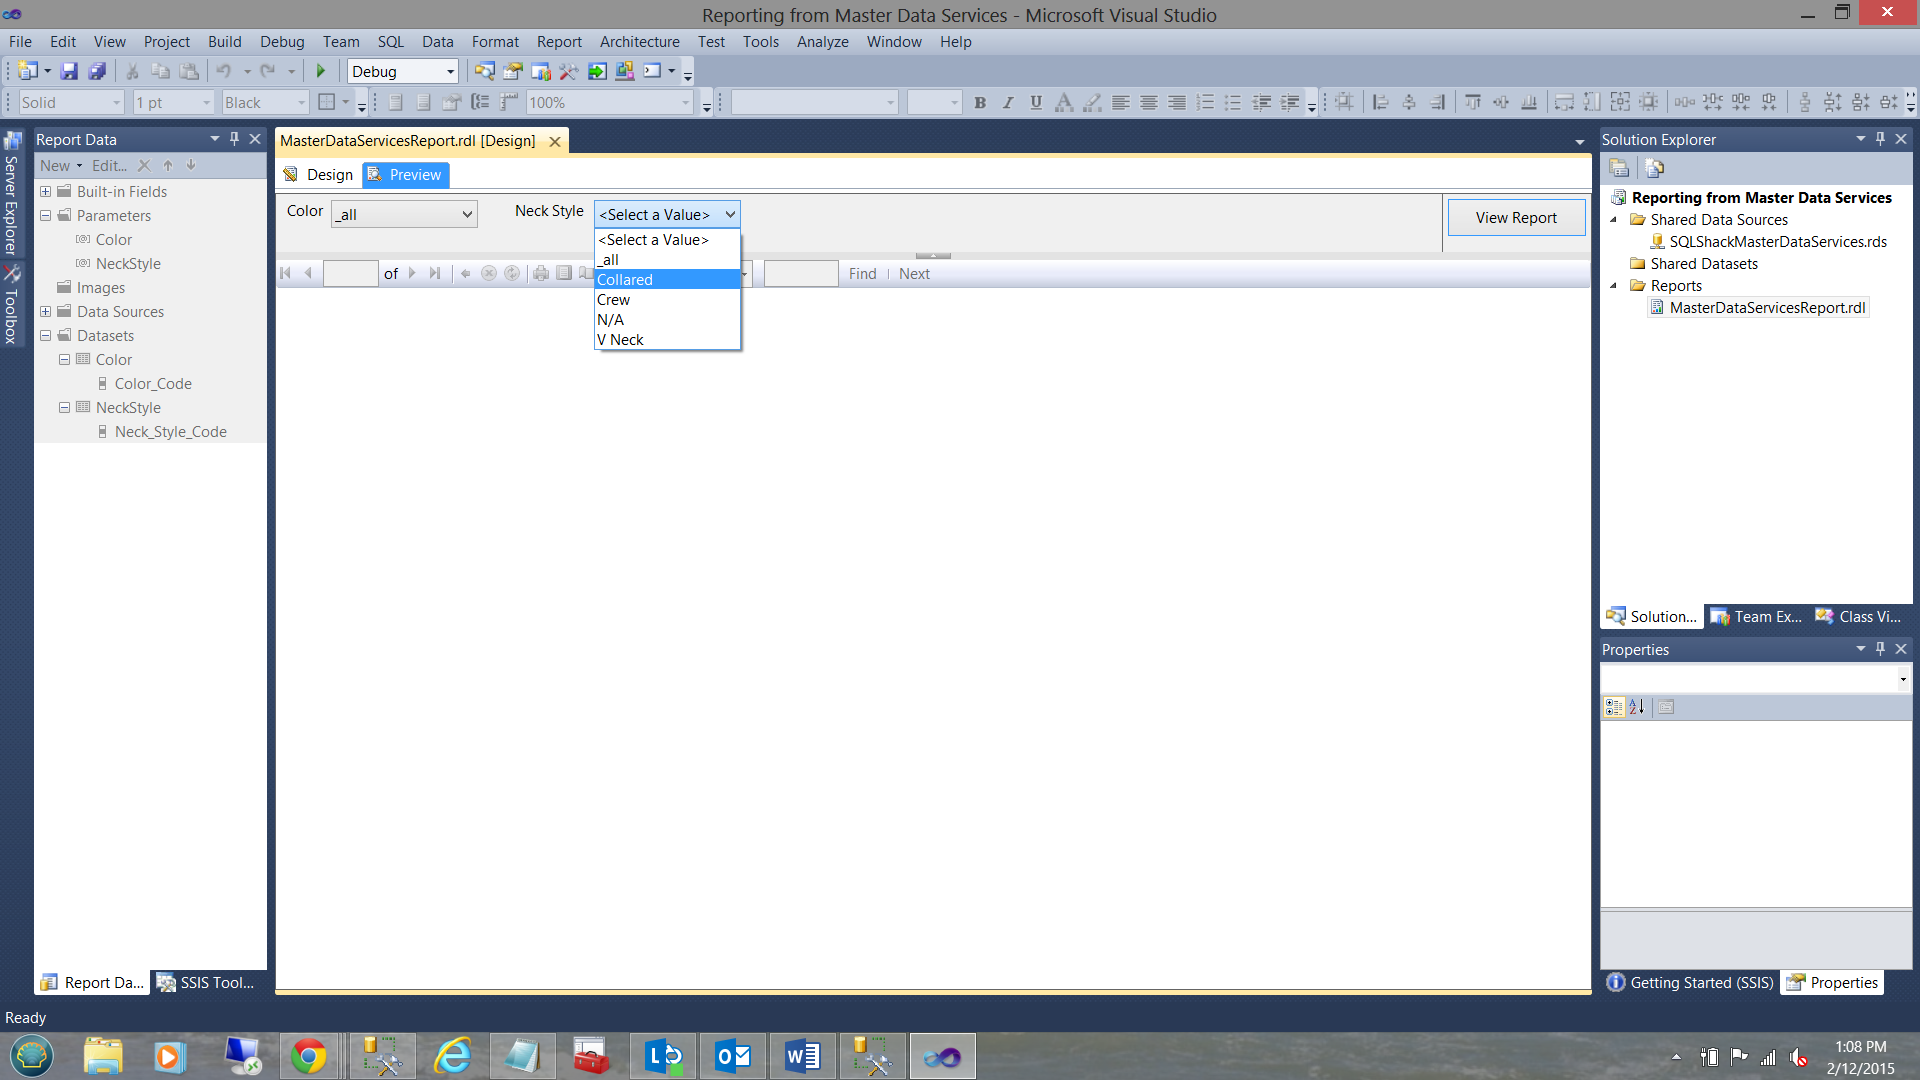
The screen shot above shows the values populated by the “Collar Type” dialogue box.
Creating the meat of the report
With the necessary infrastructure now in place, we now proceed to create a dataset to pull the “Product” data.
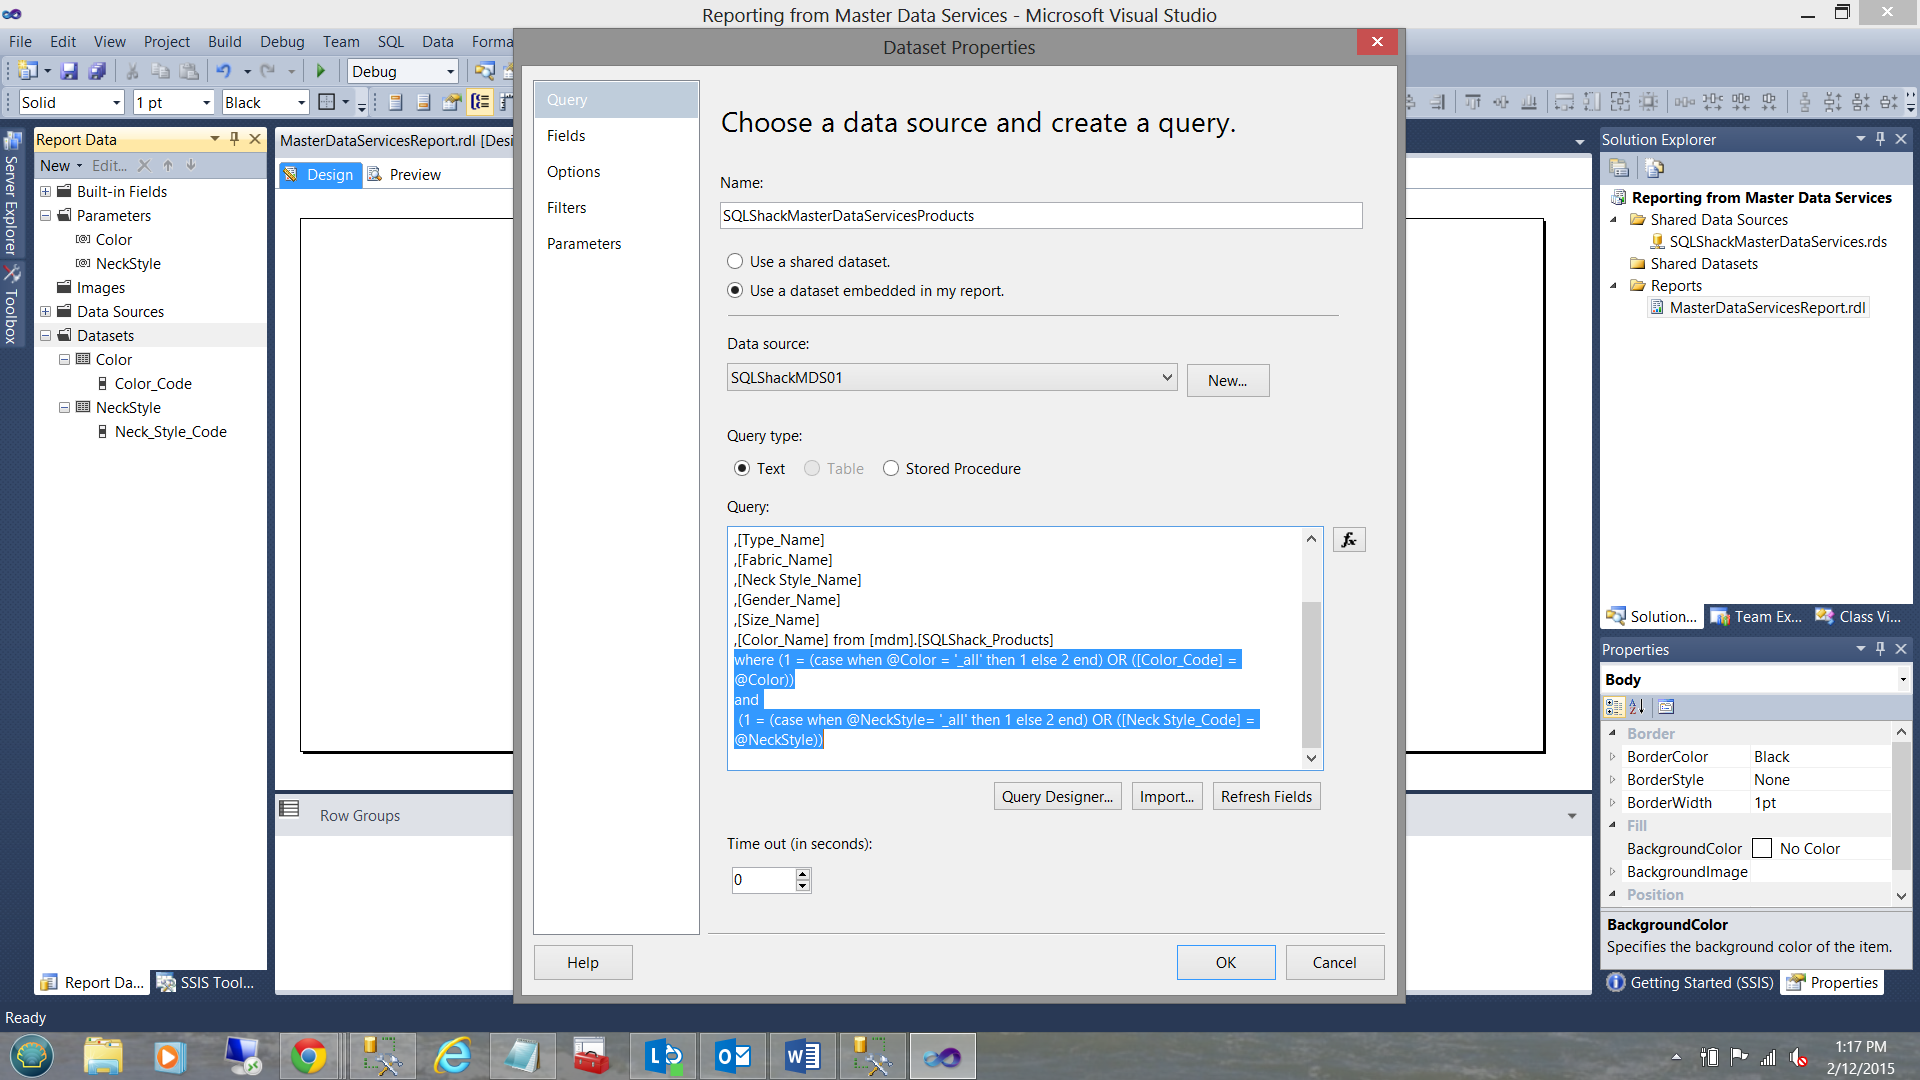
The code necessary to pull the data is shown above and the listing is shown below. Please do have a look at the way I have constructed the predicate!!
|
1 2 3 4 5 6 7 8 9 10 11 12 13 14 15 |
select [Name],[Cost] ,[Retail Price] ,[Discontinued_Name] ,[Available to Outlet_Name] ,[Type_Name] ,[Fabric_Name] ,[Neck Style_Name] ,[Gender_Name] ,[Size_Name] ,[Color_Name] from [mdm].[SQLShack_Products] where (1 = (case when @Color = '_all' then 1 else 2 end) OR ([Color_Code] = @Color)) and (1 = (case when @NeckStyle= '_all' then 1 else 2 end) OR ([Neck Style_Code] = @NeckStyle)) |
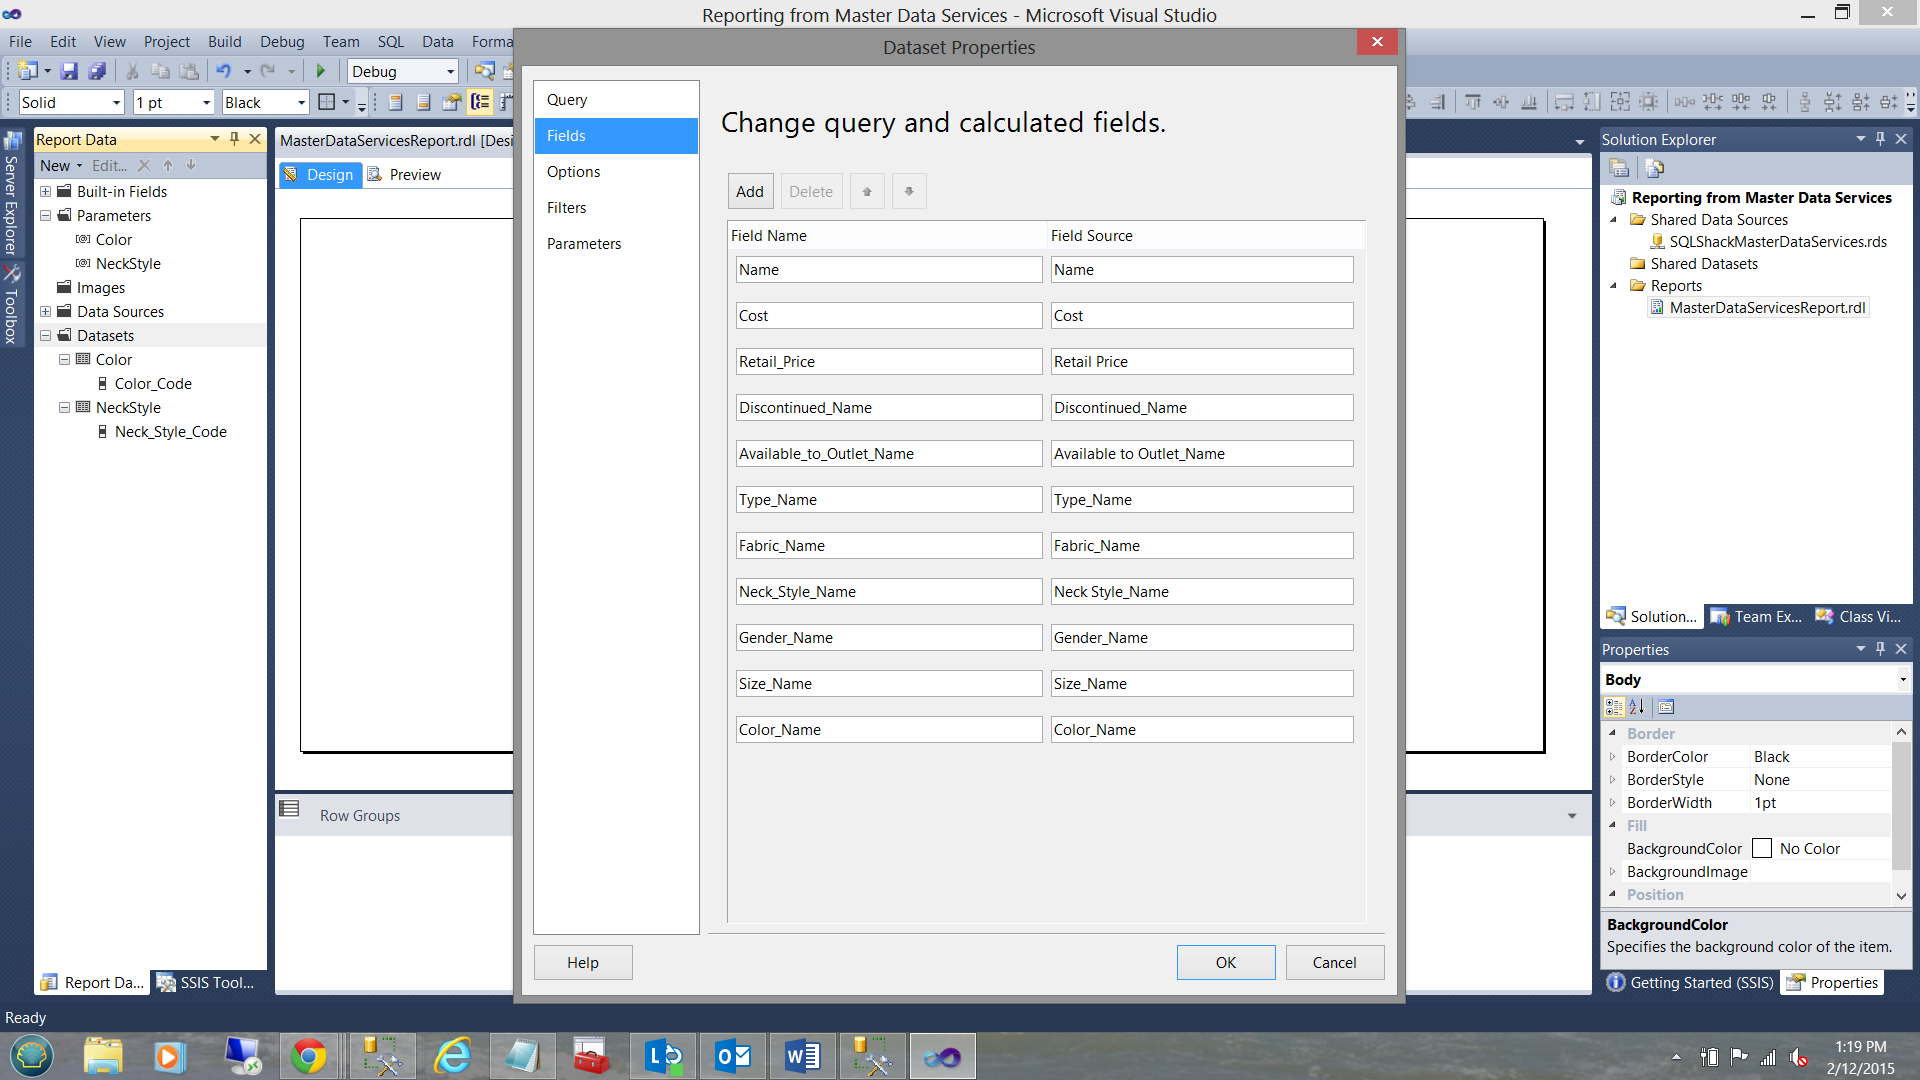
Clicking on our “Fields” tab, we see the fields that will be pulled from the Product entity.
We click OK to exit our “Dataset Properties” dialog box and find ourselves back on our work surface.
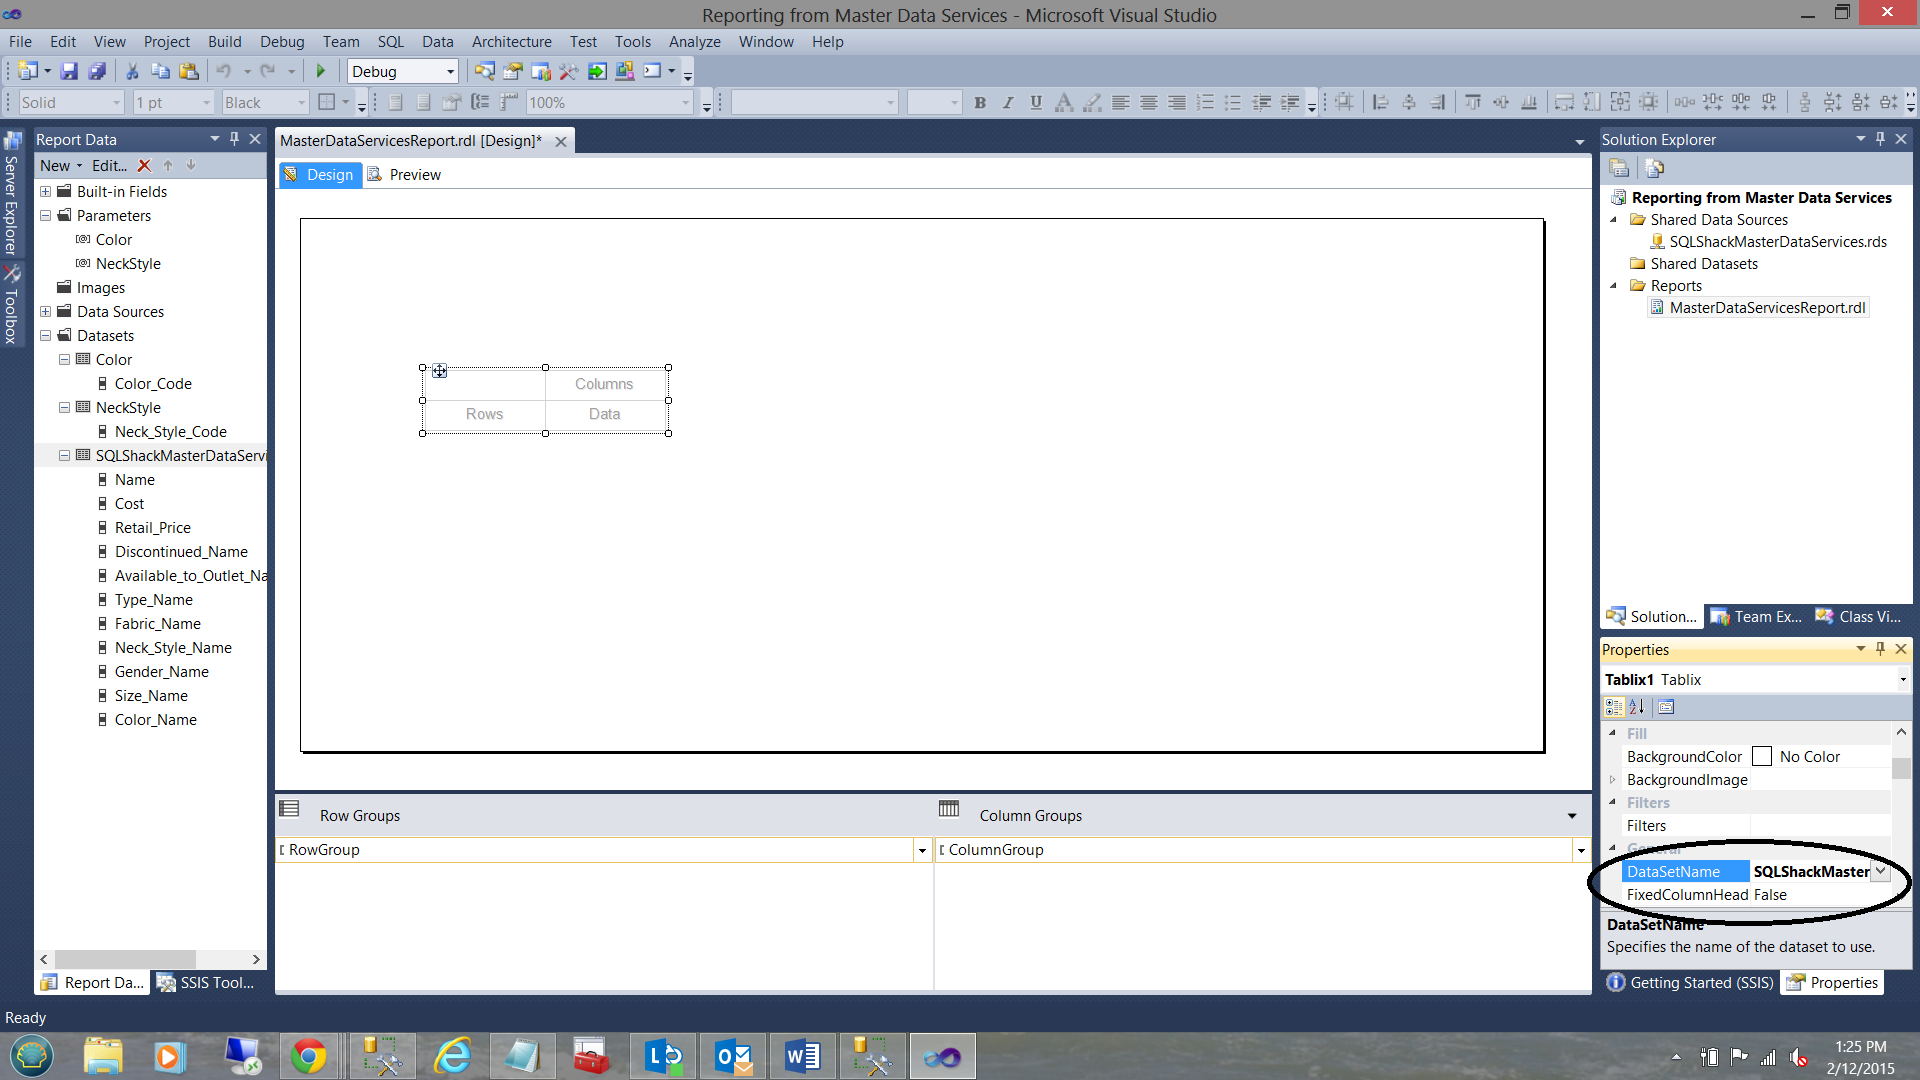
Our next task is to add a “Matrix report item” to our work surface.
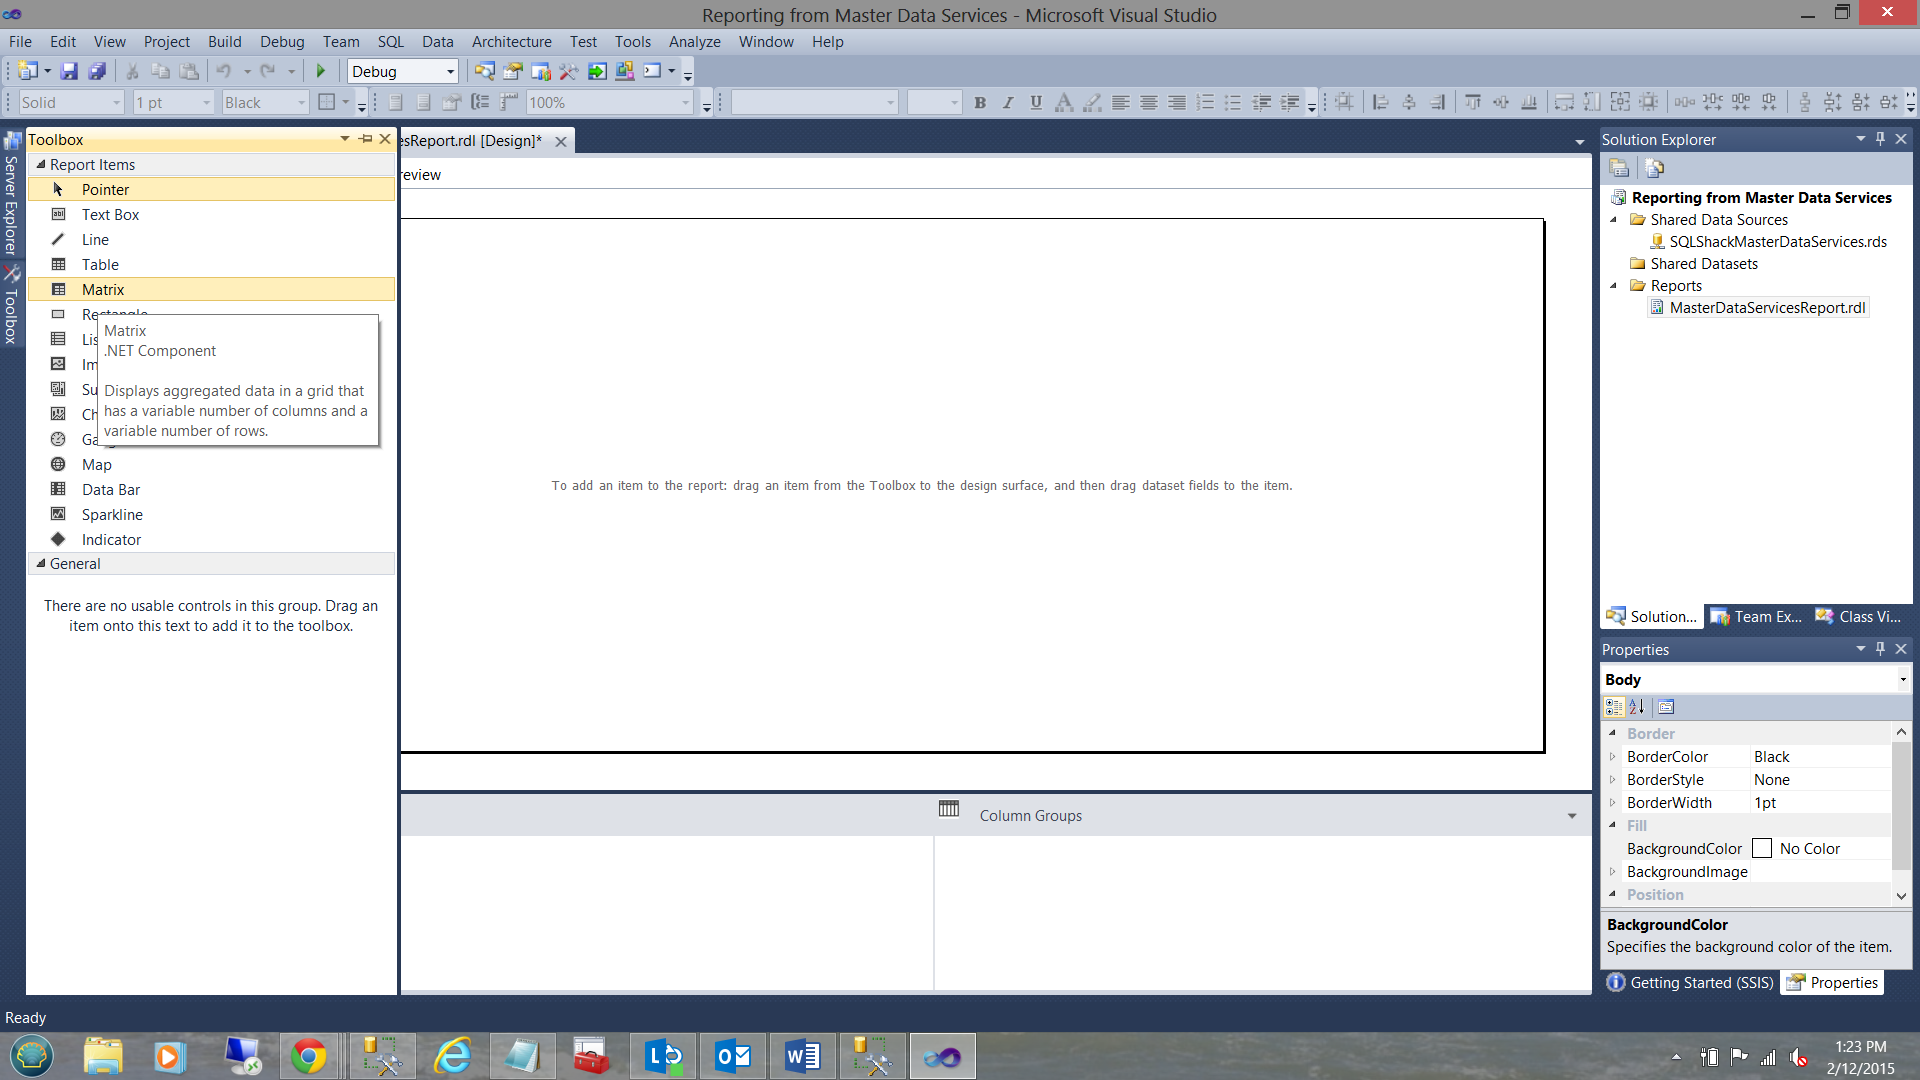
Dragging a “Matrix Report Item” from the tool box and placing it on our drawing surface, we now connect our matrix to the Product based dataset that we just created (see below and to the right).
Our next task is to remove the column grouping from our report (see below).
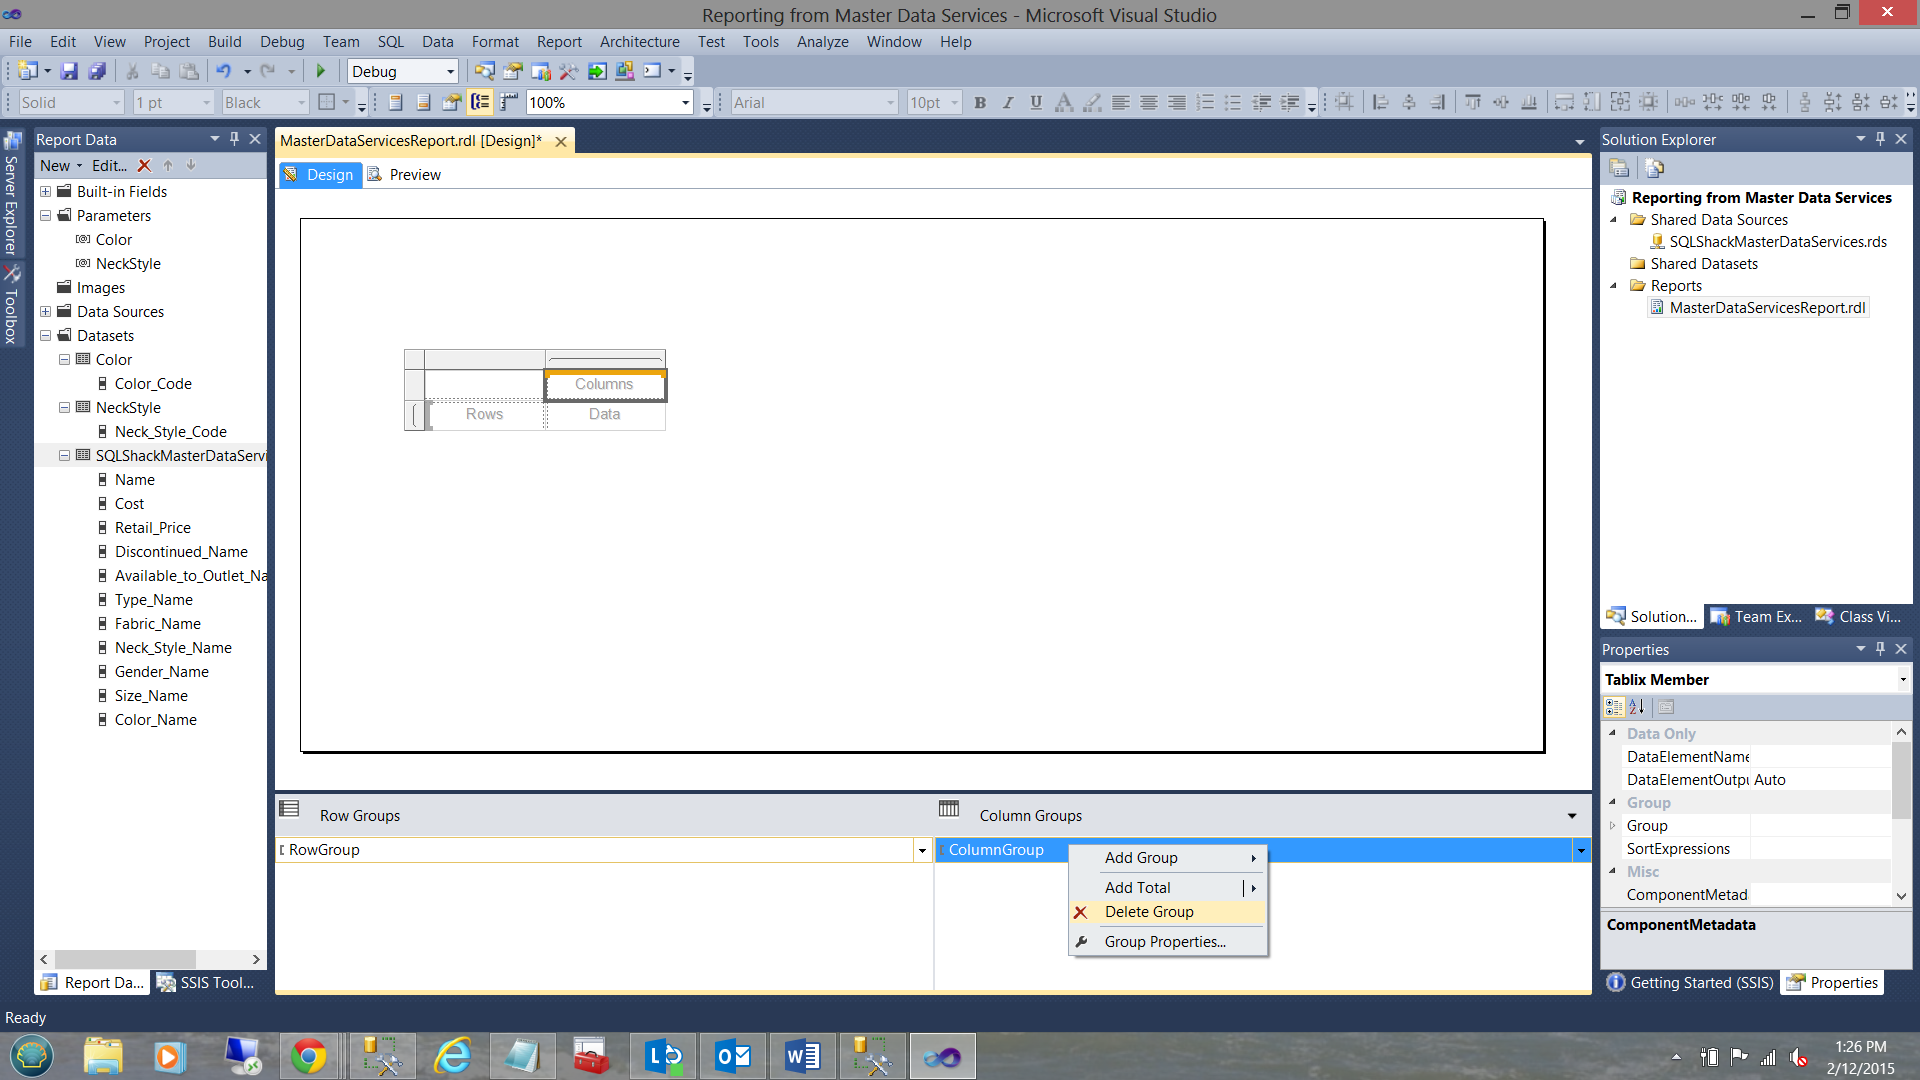
We right click upon the “ColumnGroup” and select “Delete Group” from the context menu.
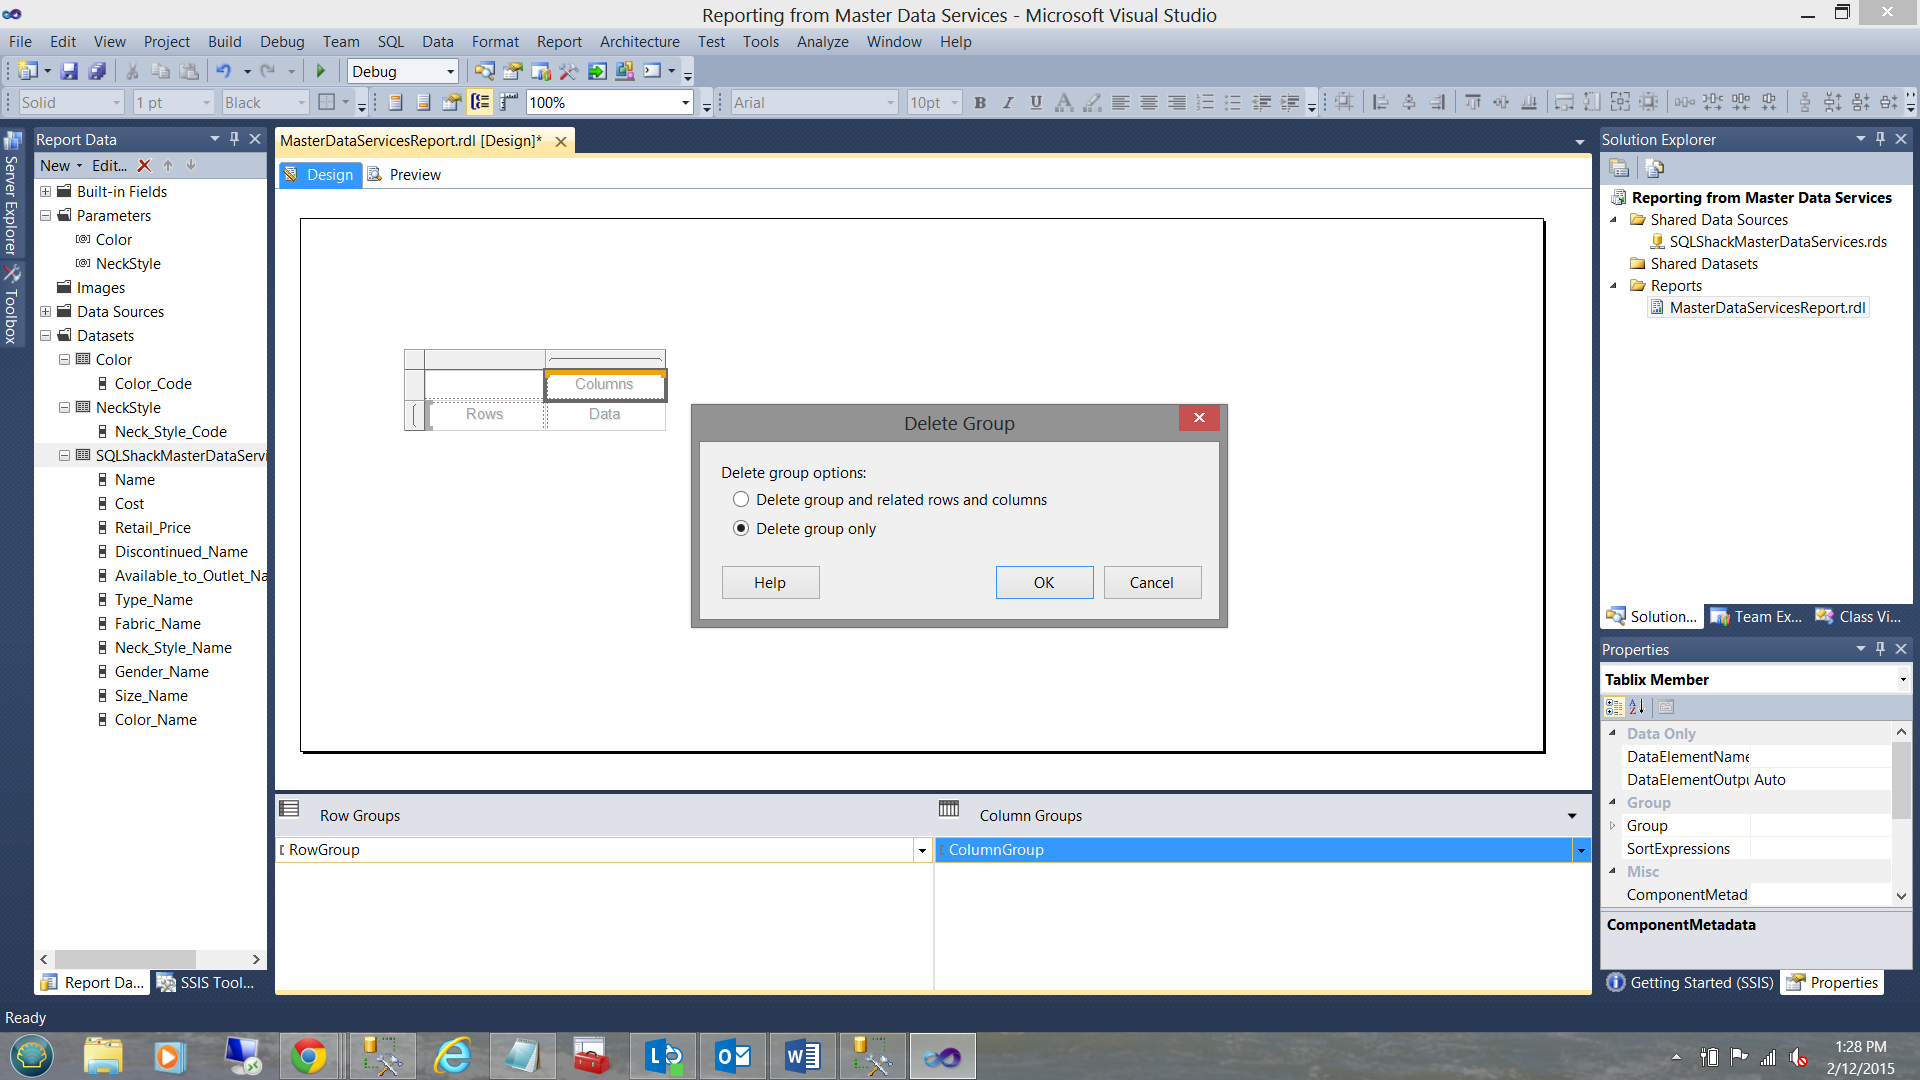
We are asked if we wish to delete the grouping and the data or merely the grouping only. We select “Delete group only” (see above).
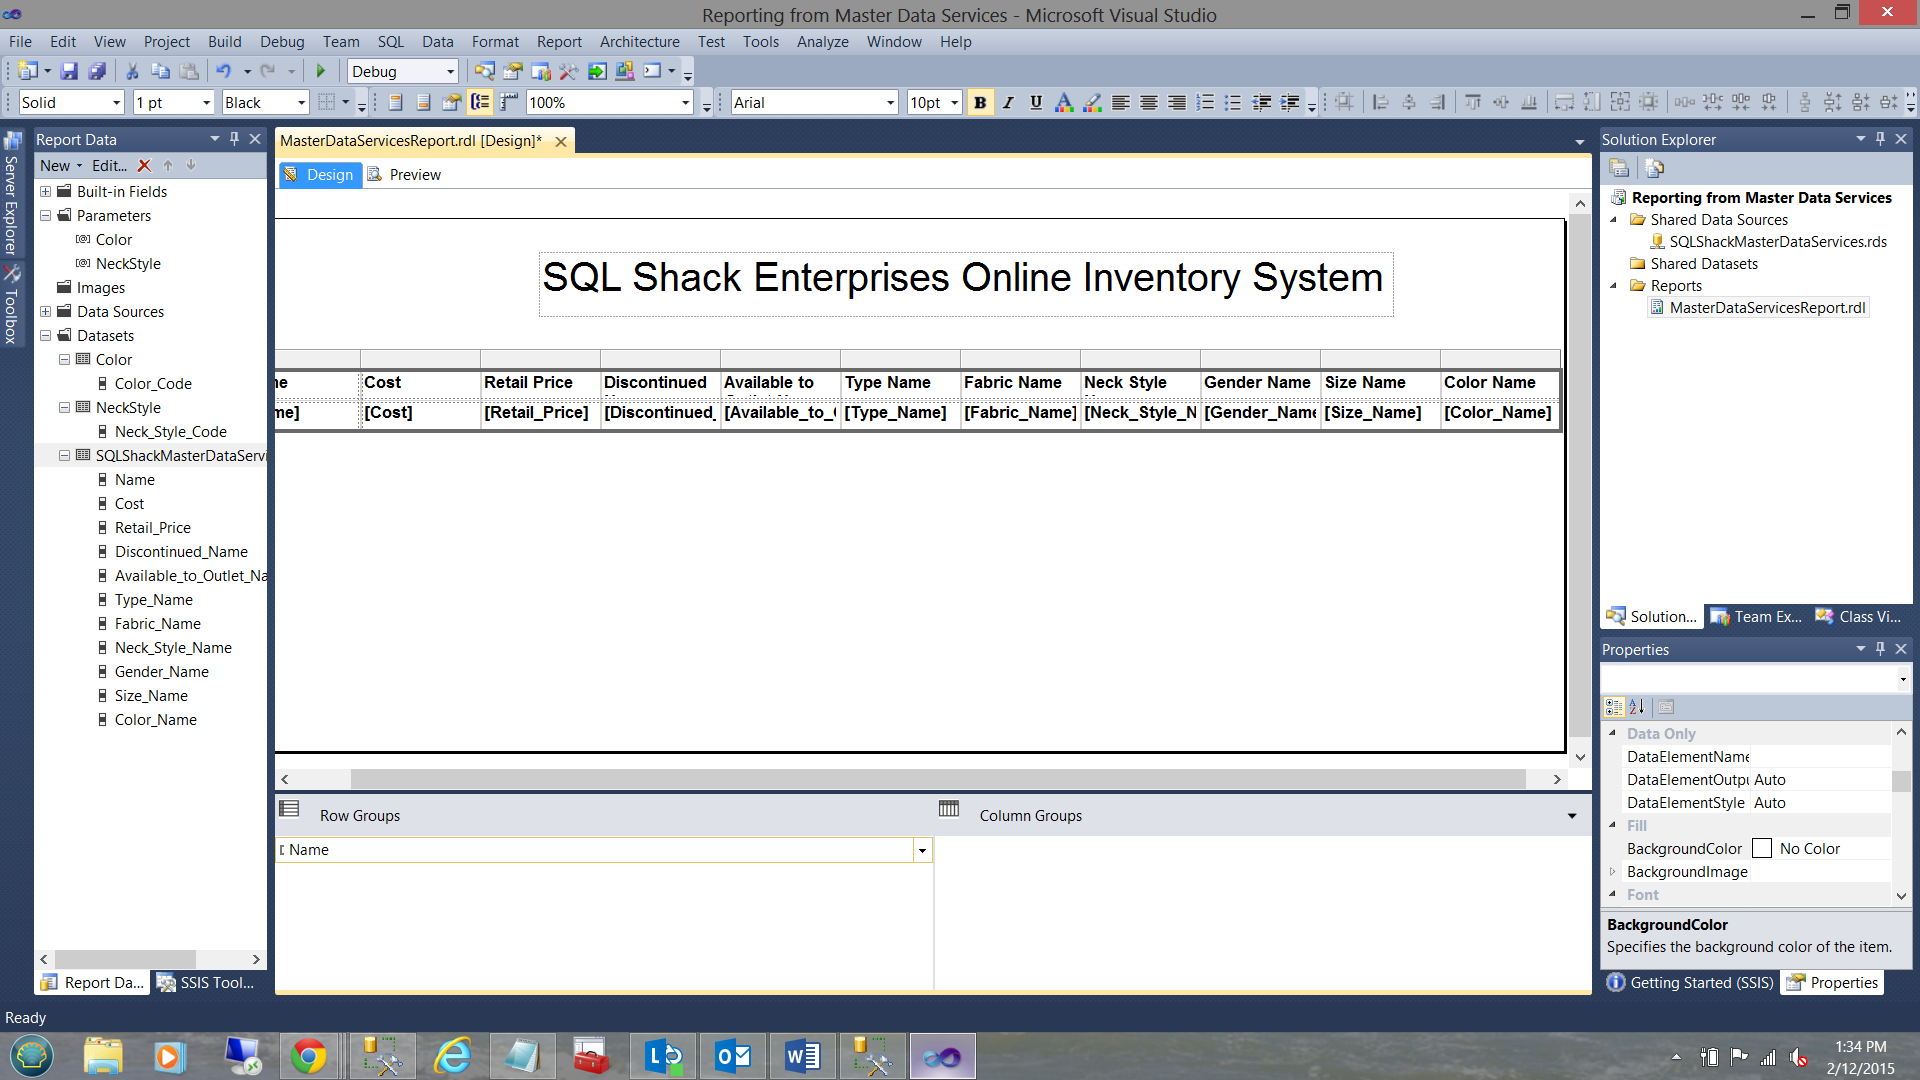
We now must add a few more columns to the matrix as we note in the screen dump below.
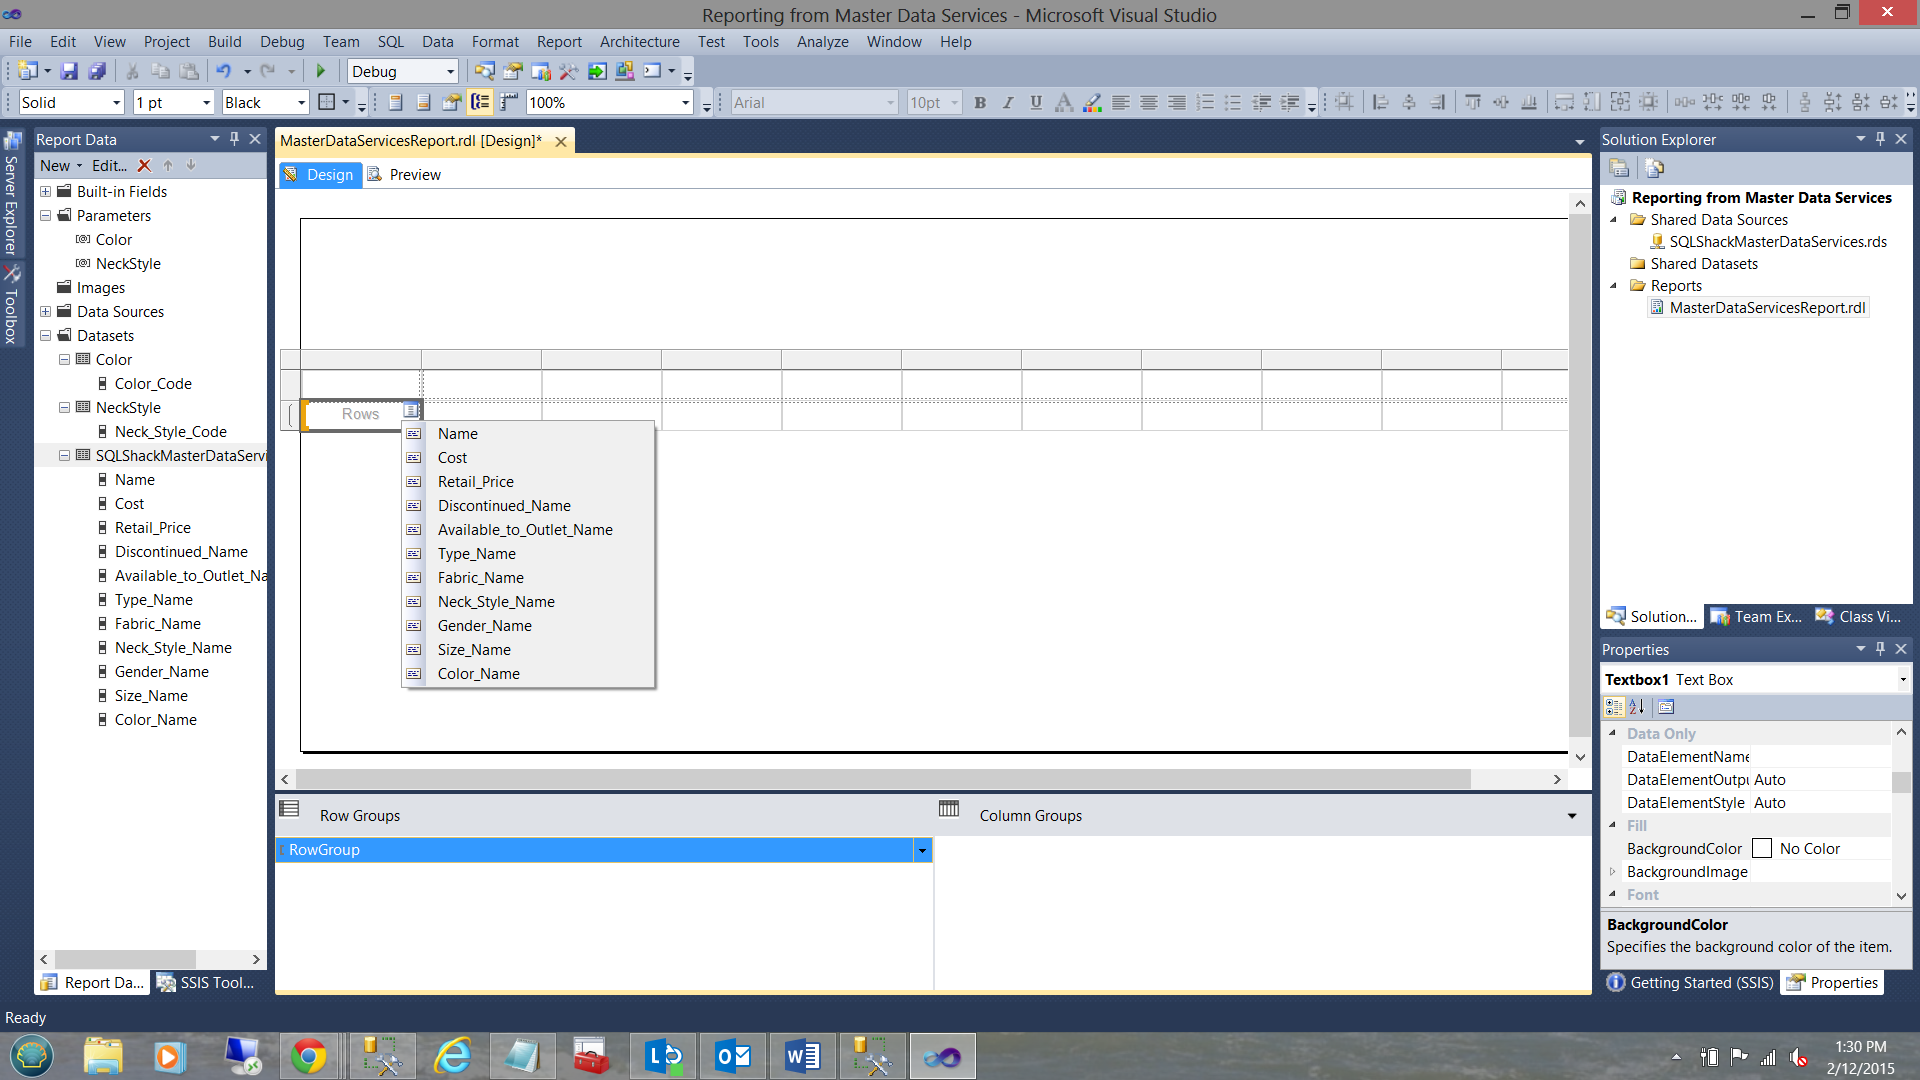
By clicking on the Rows ellipsis (see above) the list of the fields available to us are shown in the “pick list” (see above). We assign each field to its own column (see below). We also add a title for our report (see below).
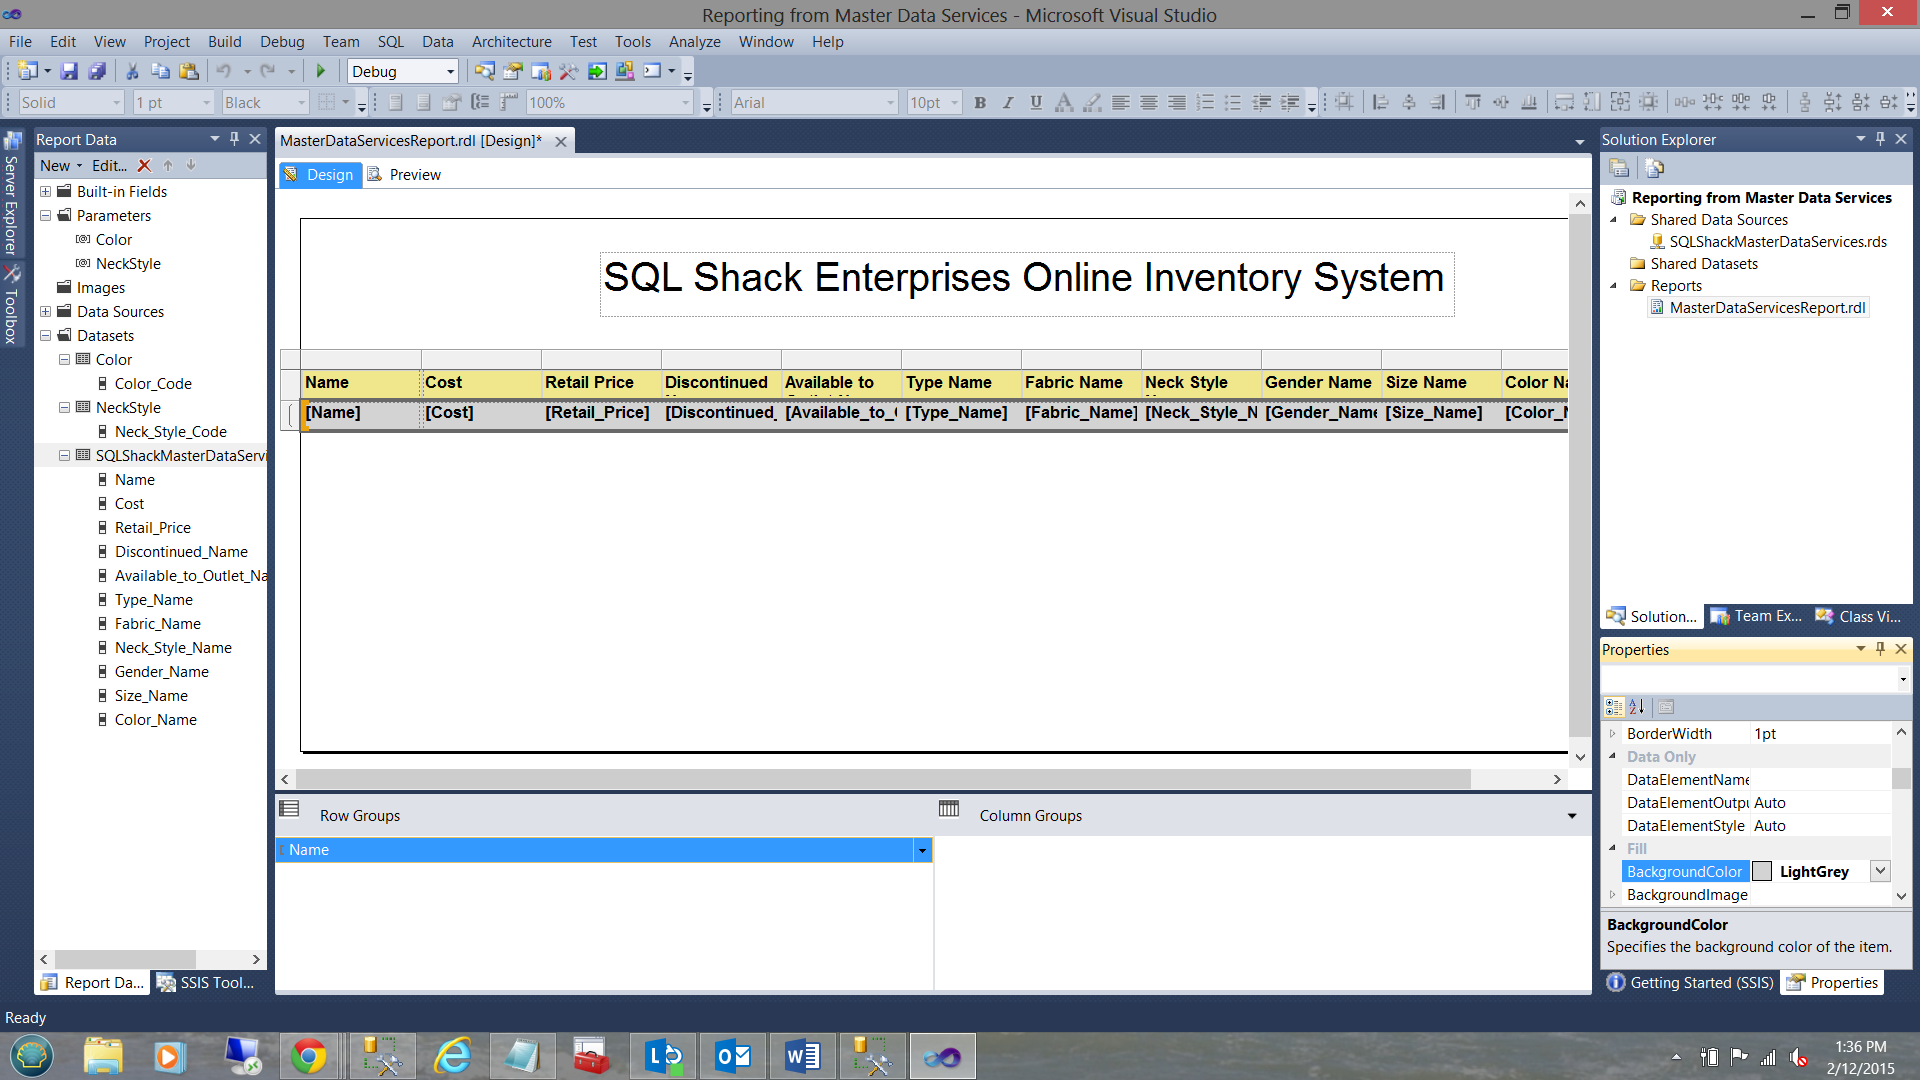
Adding a bit of coloring our report, the surface looks as follows.
Running our completed report
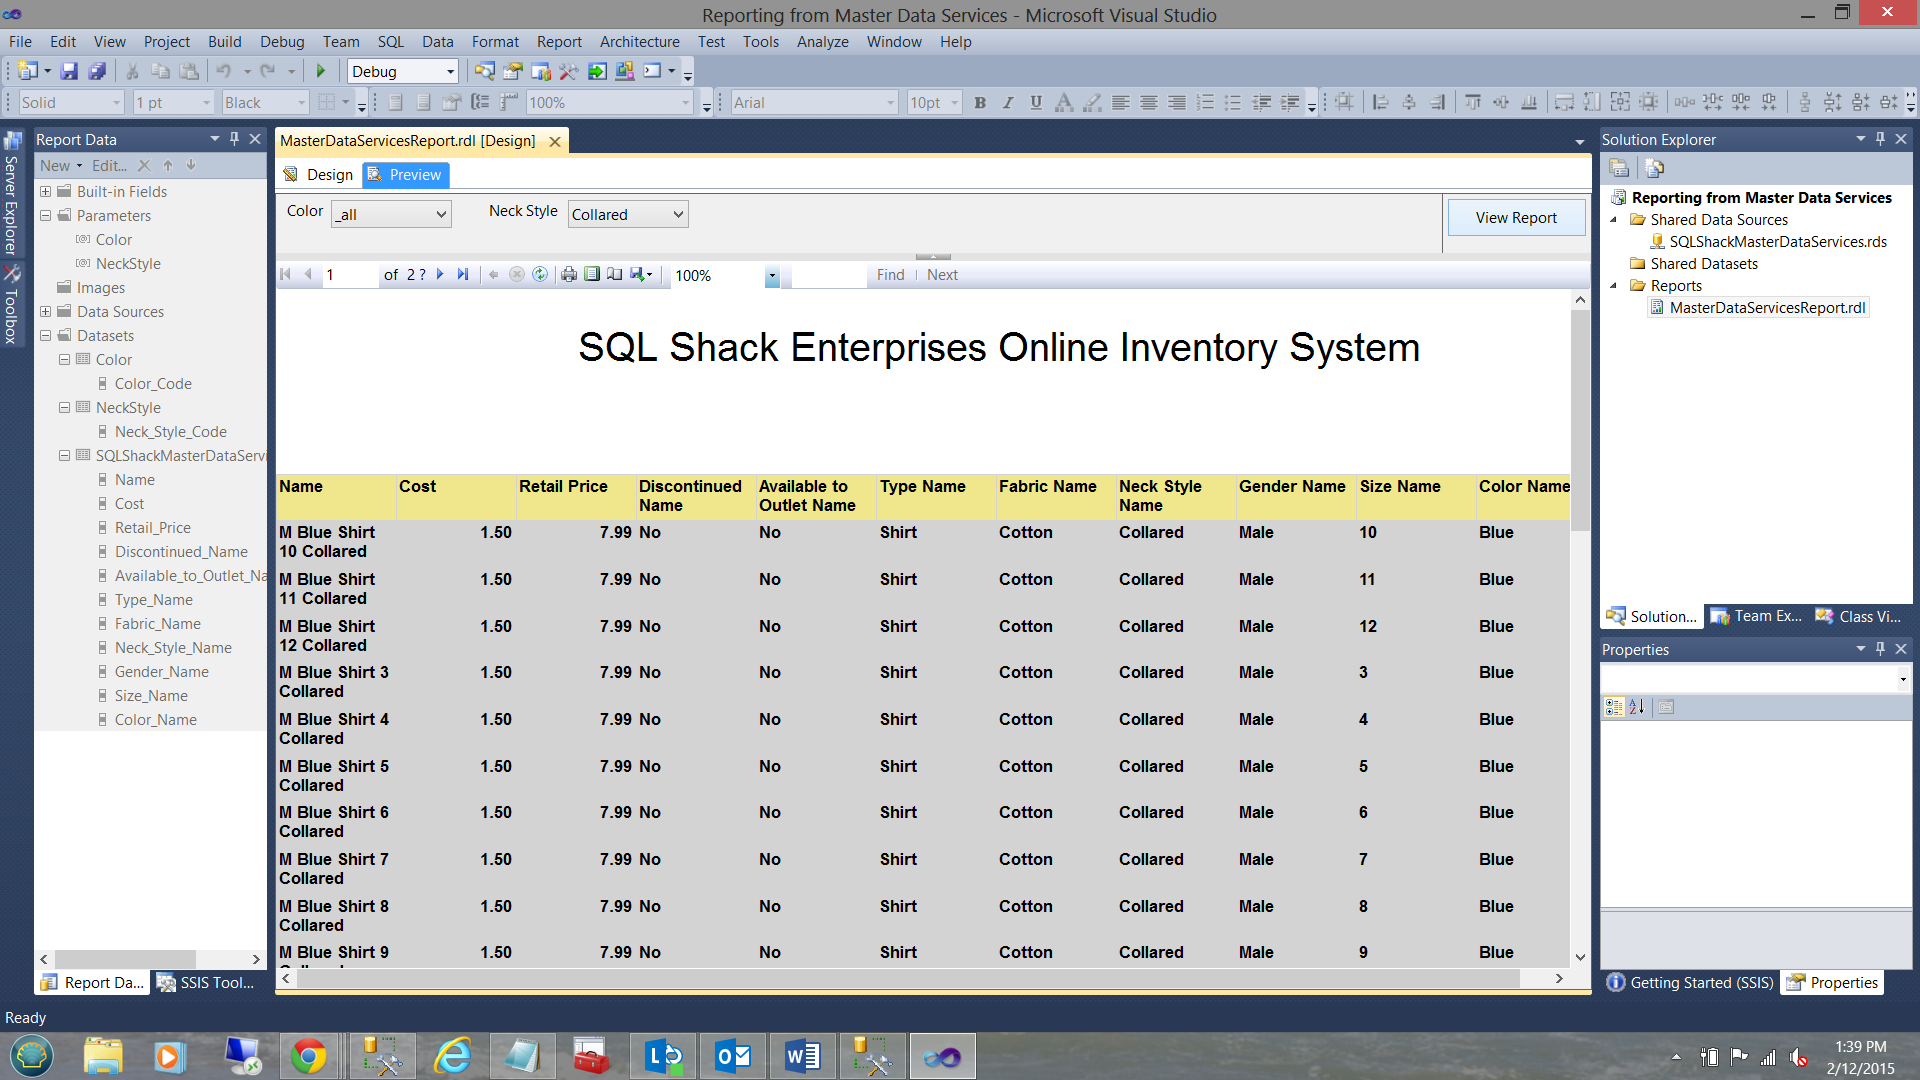
We click the “Preview” tab (from the report ribbon). For the color, we select “_all “colors (see above). For the neck style we select “Collared” (see above). The result set is displayed in the matrix above.
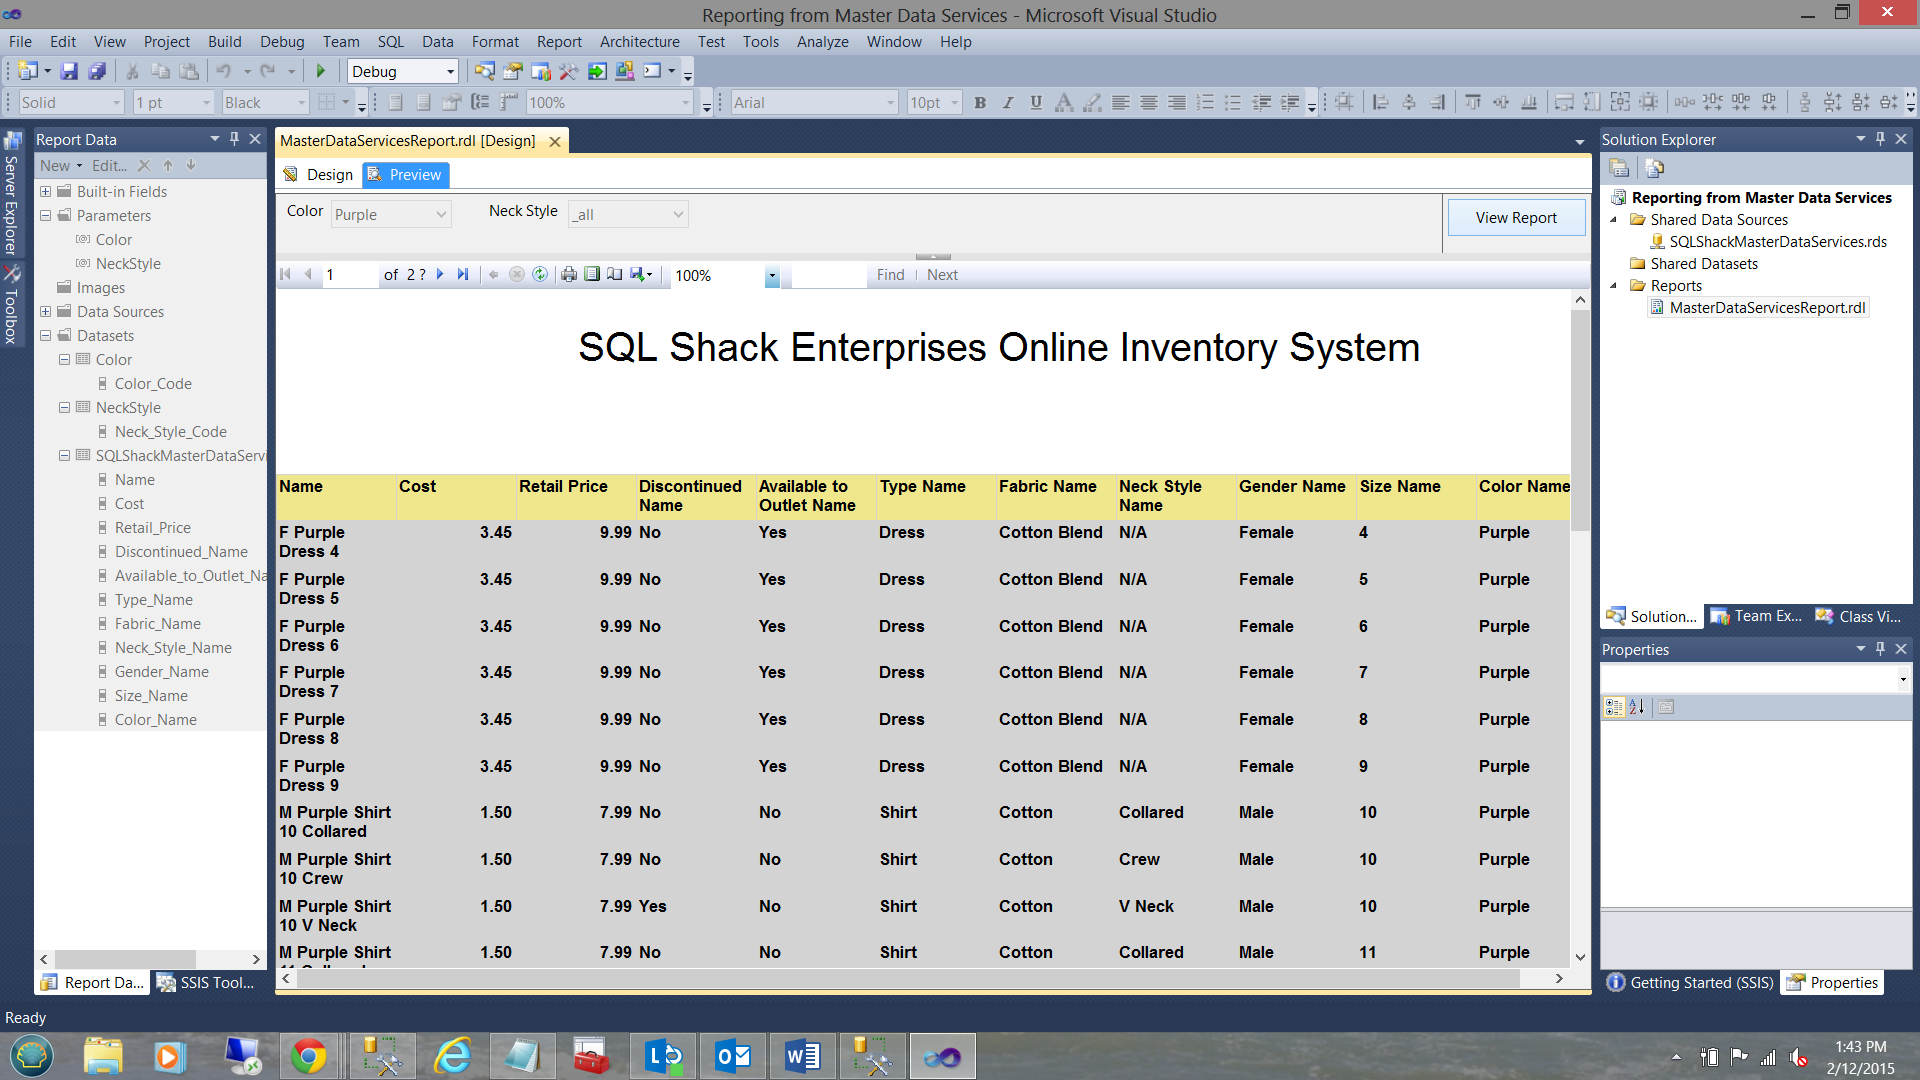
We see the result of all “Purple” items above.
Conclusions
Many smaller enterprises have limited resources to create and maintain front end GUI’s to help team members add, modify and delete data (as applicable). .Net development is costly and time intensive in addition to being an over kill for simple requirements (as was the case of our financial client). Working with Master Data Services provides a financially viable option to create quick and dirty user interfaces that may be maintained by the end user, thus freeing up other IT resources.
This ends our get together for today, HOWEVER as discussed in the introduction it would be super to have your comments as to whether or not you would like me to submit more Master Data Services related articles. I look forward to hearing your feedback.
In the interim, happy programming!!
Steve has presented papers at 8 PASS Summits and one at PASS Europe 2009 and 2010. He has recently presented a Master Data Services presentation at the PASS Amsterdam Rally.
Steve has presented 5 papers at the Information Builders' Summits. He is a PASS regional mentor.
View all posts by Steve Simon
- Reporting in SQL Server – Using calculated Expressions within reports - December 19, 2016
- How to use Expressions within SQL Server Reporting Services to create efficient reports - December 9, 2016
- How to use SQL Server Data Quality Services to ensure the correct aggregation of data - November 9, 2016