
Introduction
The indexes in many cases are great solutions to solve performance problems. For some problems, they are magical and very cheap solutions. In this chapter, we will show a demo of the SQL Server Tuning Advisor, which is a tool that comes with the SQL Server Installation. We will also use the SQL Server Profiler to generate the information for the Tuning Advisor.
The Tuning Advisor
The Tuning Advisor is a tool used to recommend and apply indexes, statistics and partitions in our SQL Server, based on the information from a sql script, from a xml file or a Profiler trace file. This tool analyzes queries and recommends indexes, statistics and partitions for our tables and views.
SQL Server Profiler
In order to record daily database activity, you can use the SQL Server Profiler tool. The SQL Server Profiler will store the T-SQL queries that will be used for the Tuning Advisor to start.
The SQL Server Profiler is a great tool to monitor long queries and monitor the performance of the daily database activities. It is also used to monitor database activities for security purposes.
You can use SQL Profiler to monitor Relational Databases (our scenario) or Multidimensional databases (SSAS).
Requirements
- The Tuning Advisor, which is included in all the SQL Server Editions except in the Express editions
- The SQL Server Profiler, which is included in all the SQL Server Editions except the Web and express editions
- We are using SQL Server 2014, but earlier versions can be used
To detect the SQL Server edition, you can use this query:
123select SERVERPROPERTY('Edition') AS Edition- You will also need the AdventureWorks database installed. In our example, the AdventureWorks 2014 is being used
Getting started
In SQL Server Profiler, we are going to record the Database Activity in a trace file. This file will be later used by the Tuning Advisor to give recommendations.
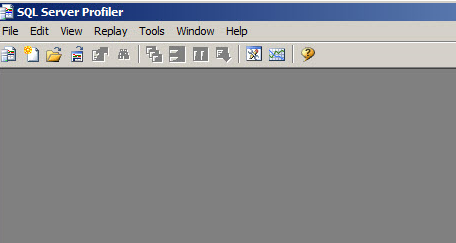
In order to start, open SQL Server Profiler:

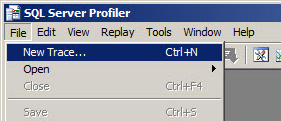
Figure 1. The SQL Server Profiler To trace the information, go to File>New Trace:
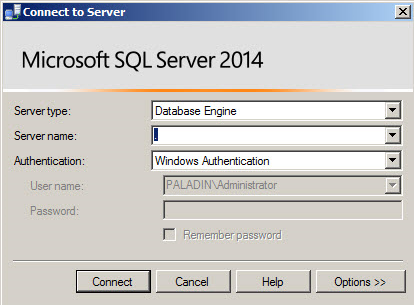
Figure 2. Create a New Trace Enter the SQL Server authentication information and press connect:
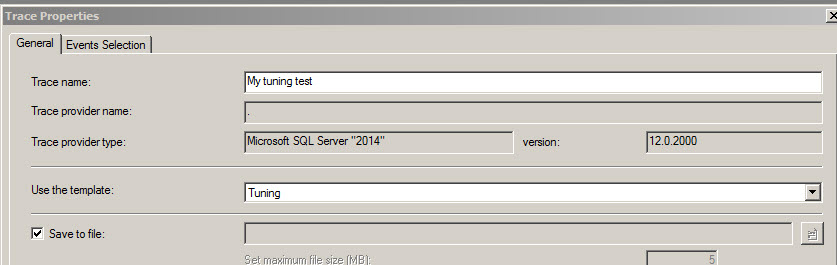
The General section allow us to specify the Trace name and we can specify the template. The template allows us to specify the type of the activity to monitor. In this case, we want to record information for the tuning wizard. For this purpose, the Tuning template can be used. Optionally, you can create your own template, but this is out of the scope of this article:
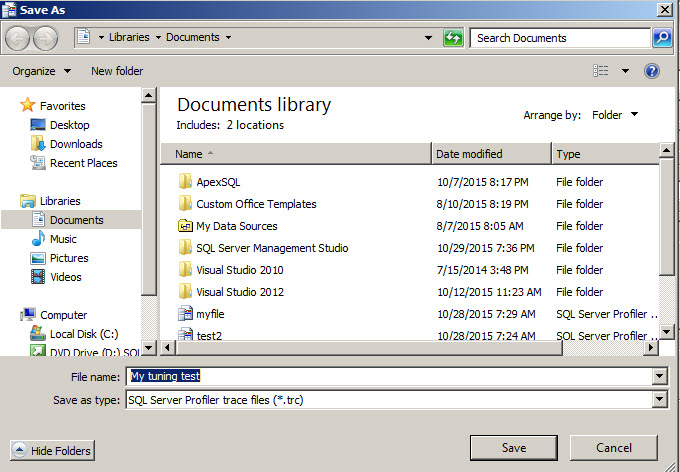
Figure 4. The Tuning template You can store the trace in a trace file or store in a SQL Server table. Storing in a file is faster, but storing in a table is useful to create advanced queries for tracking purposes. In this sample, we will store in a file:
Figure 5. The trace file - Once you have the trace properties defined, run the trace
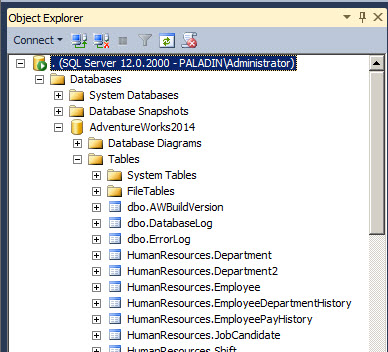
In order to generate activity, open SQL Server Management Studio (SSMS):
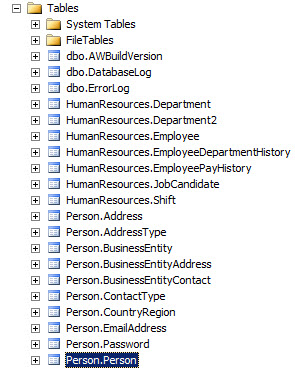
Figure 6. The SSMS and the AdventureWorks We are going to work with the Person.Person table:
Figure 7. The Person.Person table To simulate the lack of indexes, we are going to remove an existing index of the table Person.Person:
1234DROP INDEX [IX_Person_LastName_FirstName_MiddleName] ON [Person].[Person]GONow, run these queries in order to generate some information:
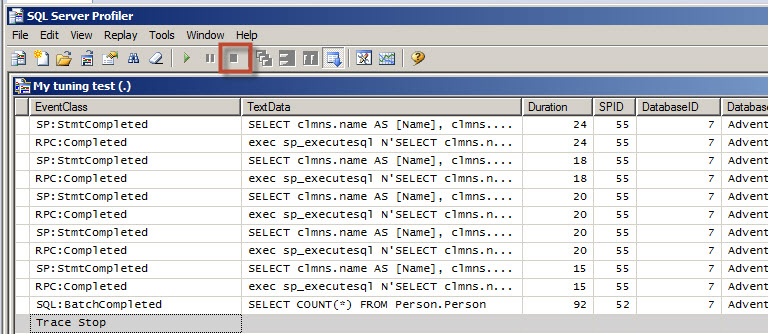
12345678SELECT BusinessEntityID, FirstName, MiddleName, LastNamefrom Person.Personwhere LastName = 'Allison'SELECT COUNT(*) FROM Person.PersonThis is a simulation to learn how to work with the tuning advisor. Usually, you will run the profiler and the users will work on the daily tasks and the Profiler will be loading the queries with real activities and at the end of the day, the trace will be stopped (you can specify the time to stop the trace in Profiler). In the SQL Server Profiler, stop the trace:
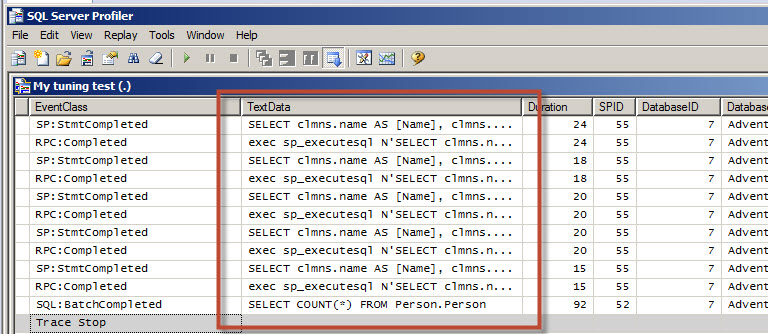
Figure 8. Stopping the trace If you check TextData you will notice that a lot of internal queries were generated when you used the SQL Server Profiler. The Profiler stores all the activity and you can filter some information to reduce the workload:
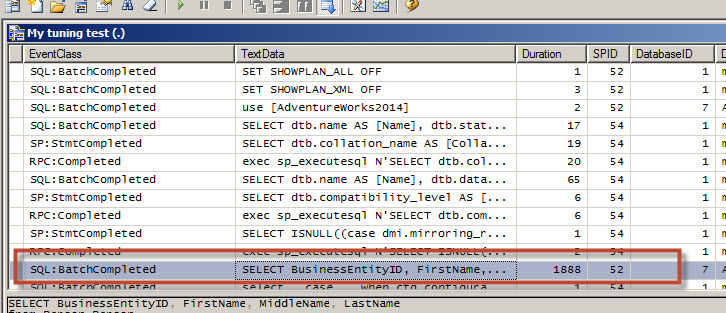
Figure 9. The trace information If we check the trace information, we will see the query run on step 10. The duration of the query execution is 1888 ms:
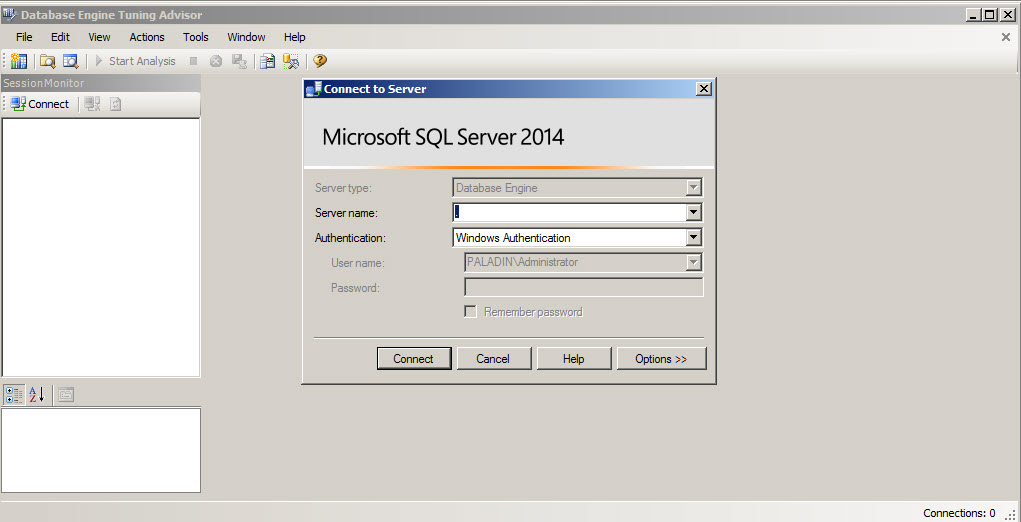
Figure 10. The query run Now that we have the information collected in a trace file, it is time to open the Database Engine Tuning Advisor:
Figure 11. The Tuning Advisor By default, the session name is the user name and the date:
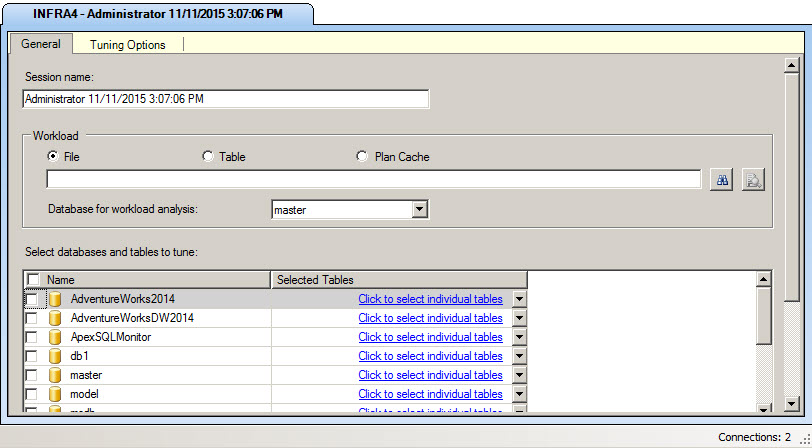
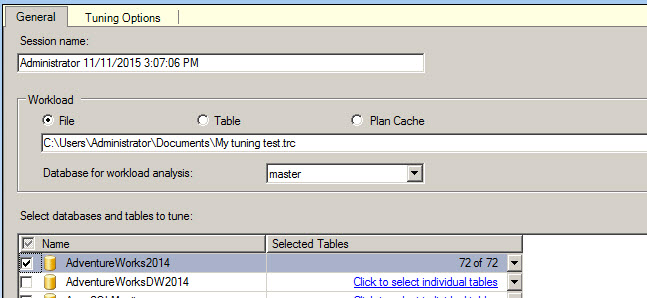
Figure 12. The Advisor Session You can upload information from a .trc file from Profiler (our scenario), from a sql script, from a xml file, from a table and from the Plan Cache. You can also choose where to do the analysis. In this example, the workload will be done in the master database. Finally, we will select the database to tune. We used the AdventureWorks database:
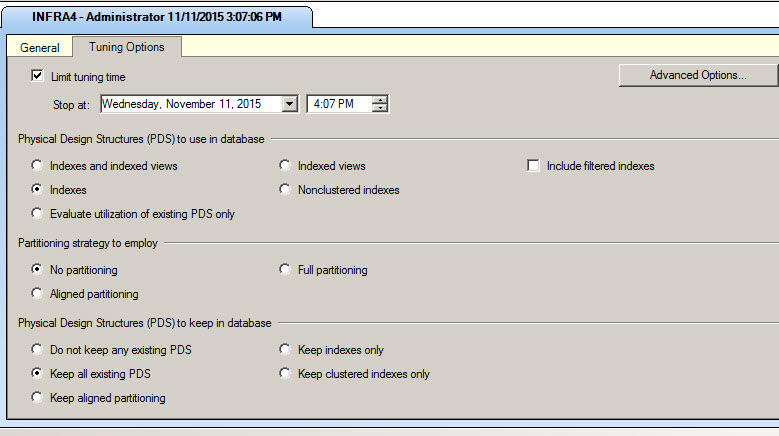
Figure 13. The session options The tuning options tab will help you to configure some options like the stop time of the analysis. If your workload is huge, analyzing all the information may take several hours. That is why you can limit the time to analyze the information.
You can also limit your analysis to just Index, just index views or limit the analysis to non-clustered indexes. All these options will reduce the analysis time. You have also options to analyze the partitioning strategy and the Physical design structure to keep in the database. You can decide which structures to keep.
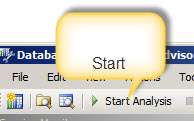
Figure 14. The tuning options Once you have all the configurations ready, you can start the analysis:
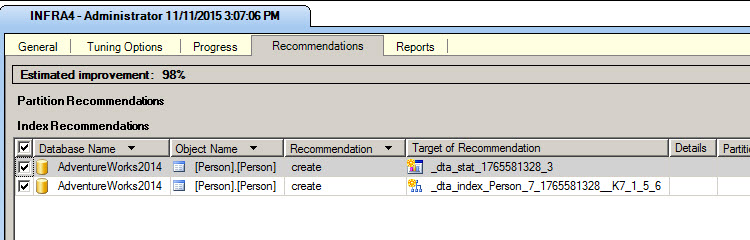
Figure 15. Starting the analysis Once the Analysis is done, you will be able to see the Recommendations. In this example, the estimated improvement with the changes will be 98 %. It shows the Database, the object Name (in this case the Person.Person table). The recommendations are to create statistics and to create an index:
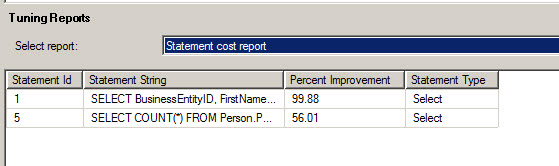
Figure 16. The Tuning Advisor recommendations In the reports tab, there are several reports. The Statement cost report will show the T-SQL statements and the percentage of improvement when we apply the changes:
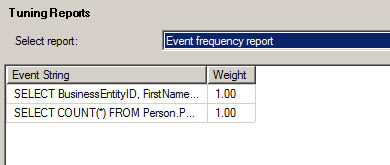
Figure 17. The statement cost report The event frequency report shows how frequently the queries are used. This is very important because an excessive number of indexes can decrease the performance. You cannot blindly apply the recommendations, you need to analyze the reports first and choose wisely, the queries most frequently used. You should prioritize frequently used queries:
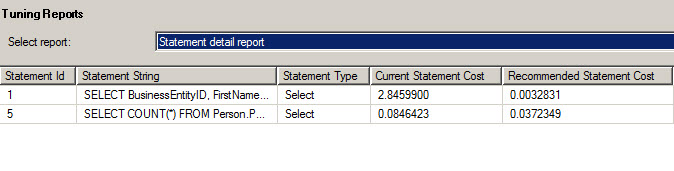
Figure 18. The Event frequency report The statement detail report shows the current cost and the cost of the query applying the recommendations. The lowest cost, the best performance
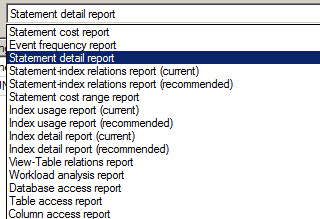
Figure 19. The Statement detail report In addition, there are more reports available. Use them wisely to select the best recommendations:
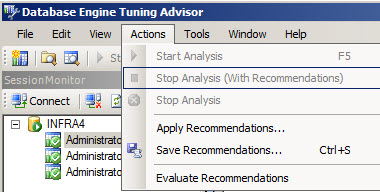
Figure 20. The Tuning Advisor reports In the Actions menu, you can apply the recommendation, which will create the indexes, statistics or any other recommendation. The Save Recommendations will save the recommendations in a .sql script. The Evaluation option evaluates the recommendations:
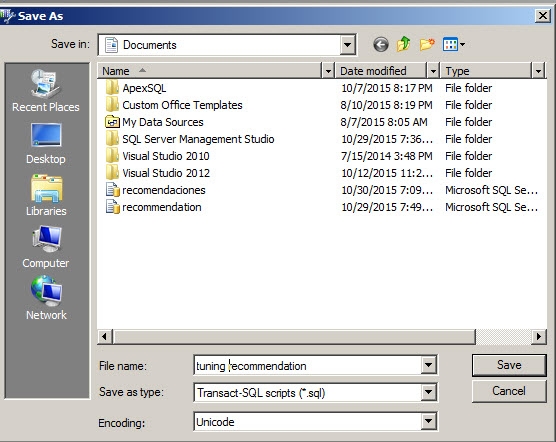
Figure 21. The Tuning Advisor actions In this example, we will save the recommendations in a sql script:
Figure 22. The script with the recommendations Open the script created on step 25 and execute the sentences. The script will create 1 index and 1 statistic:
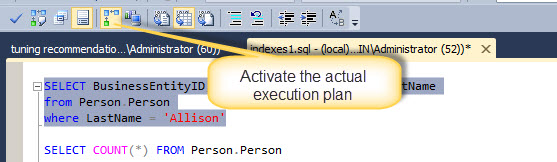
1234567891011121314151617181920use [AdventureWorks2014]goSET ANSI_PADDING ONgoCREATE NONCLUSTERED INDEX [_dta_index_Person_7_1765581328__K7_1_5_6] ON [Person].[Person]([LastName] ASC)INCLUDE ( [BusinessEntityID],[FirstName],[MiddleName]) WITH (SORT_IN_TEMPDB = OFF, DROP_EXISTING = OFF, ONLINE = OFF) ON [PRIMARY]goCREATE STATISTICS [_dta_stat_1765581328_3] ON [Person].[Person]([NameStyle])goNow, run again the query of the step 10, but activate the Actual Execution Plan icon. The execution plan will show if the new index created is being used:
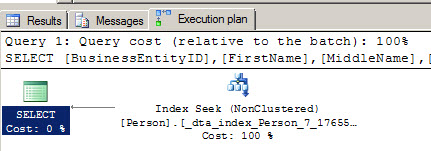
Figure 23. Activating the actual execution plan As you can see, the Index created in the step 26 is being used by the query:
Figure 24. The Execution Plan - PostgreSQL tutorial to create a user - November 12, 2023
- PostgreSQL Tutorial for beginners - April 6, 2023
- PSQL stored procedures overview and examples - February 14, 2023
Conclusion
As you can see, the Tuning Advisor is a nice and simple tool. You just need to run the profiler store the trace in a file or a table or just pass a sql script with the queries to analyze or simply you can analyze the plan cache.
The recommendations done by the Tuning Advisor should be carefully analyzed. You should analyze the indexes and check the reports before implementing them.
Read the next chapter and learn how to use the command line tool called DTA.

He has worked for the government, oil companies, web sites, magazines and universities around the world. Daniel also regularly speaks at SQL Servers conferences and blogs. He writes SQL Server training materials for certification exams.
He also helps with translating SQLShack articles to Spanish
View all posts by Daniel Calbimonte