
In this article, we will learn various methods of how to get an SQL execution plan of a query.
Introduction
A SQL Execution plan is a very helpful query analysis tool that helps to diagnose the query performance issues and to understand the backside of the complex operation details. A query plan can be likened to an X-ray of a query because;
- A SQL execution plan offers detailed visualized or XML format reports that describe how a query is performed step by step
- An execution plan is a very helpful guide when we want to understand which activities are performed or will be performed during a query’s execution. Because the query plan includes all the query execution steps resource consumption, and other statistical measurements
- An execution plan plays a key role in diagnosing and resolving query performance issues
SQL Server offers two types of execution plans:
- Estimated Execution Plan displays which steps may do and flow if it executes the query and it only displays the estimated details.
- The Actual Execution Plan is generated after the successful execution of a query and it includes the actual statistics, unlike the estimated plans.
How to display an SQL execution plan in Azure Data Studio
Azure Data Studio is a new generation database development environment that can be used for on-premises and cloud data platforms. One of the remarkable features of the Azure Data Studio is to work on multiple operating systems:
- Windows
- macOS
- Linux
In order to display the estimated execution plan of a query in Azure Data Studio, we click the Explain button at the top of the query window.
|
1 2 3 4 5 6 7 8 9 10 |
SELECT ProductID, SUM(LineTotal) AS TotalsOfLine, SUM(UnitPrice) AS TotalsOfPrice, SUM(UnitPriceDiscount) AS TotalsOfDiscount FROM Sales.SalesOrderDetail SOrderDet INNER JOIN Sales.SalesOrderHeader SalesOr ON SOrderDet.SalesOrderID = SalesOr.SalesOrderID WHERE PurchaseOrderNumber LIKE 'PO%' GROUP BY ProductID |
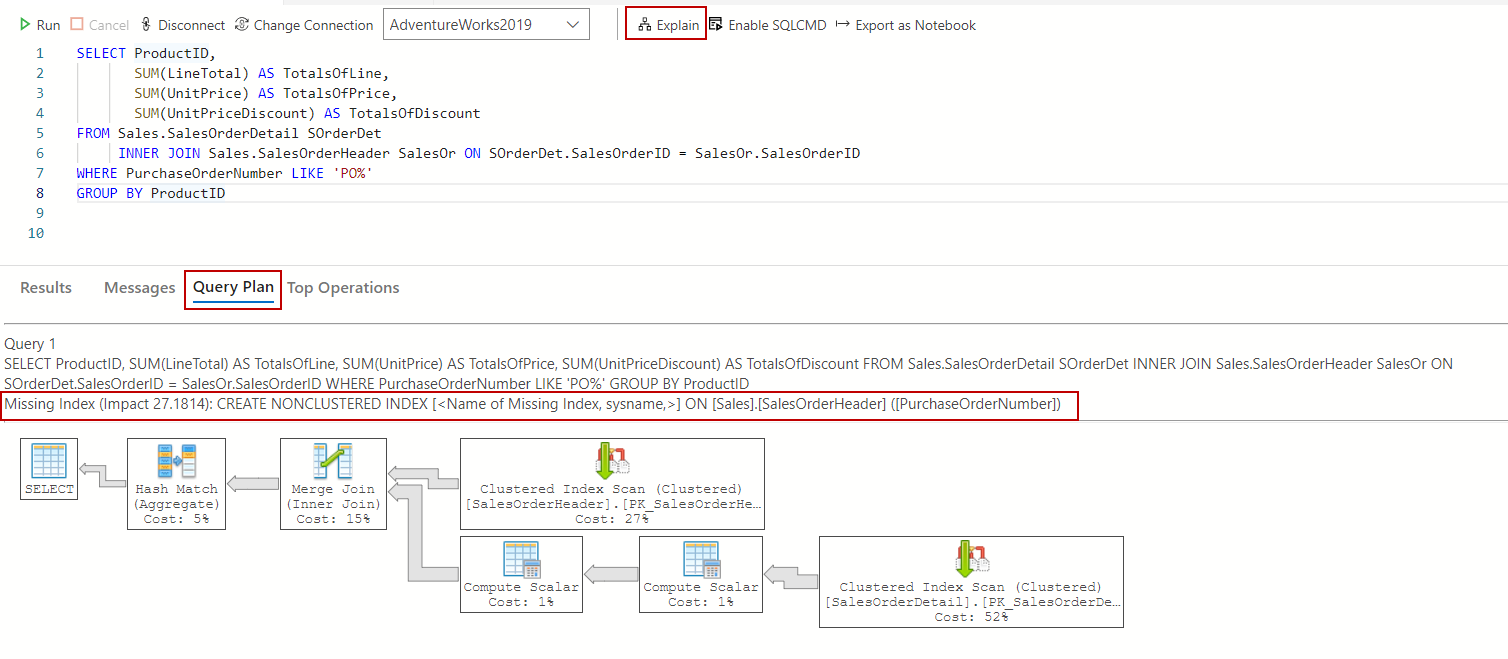
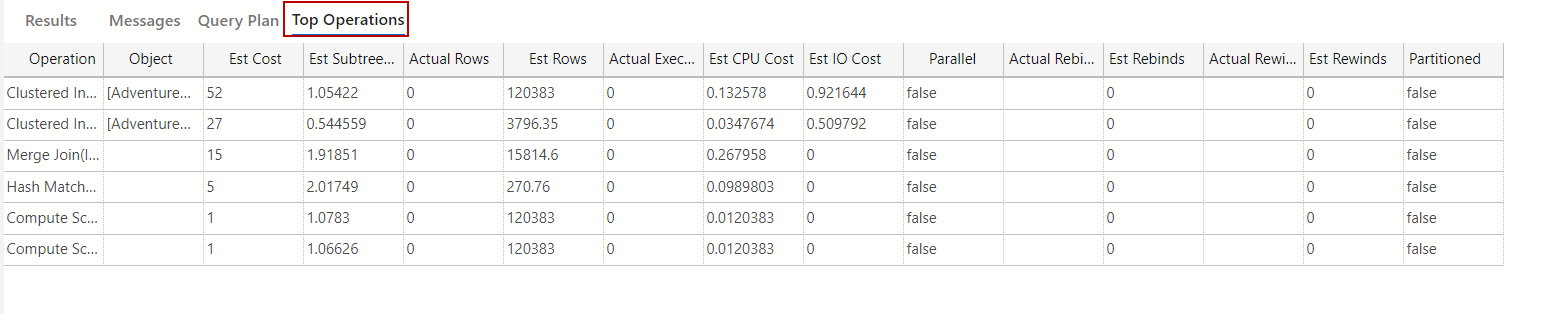
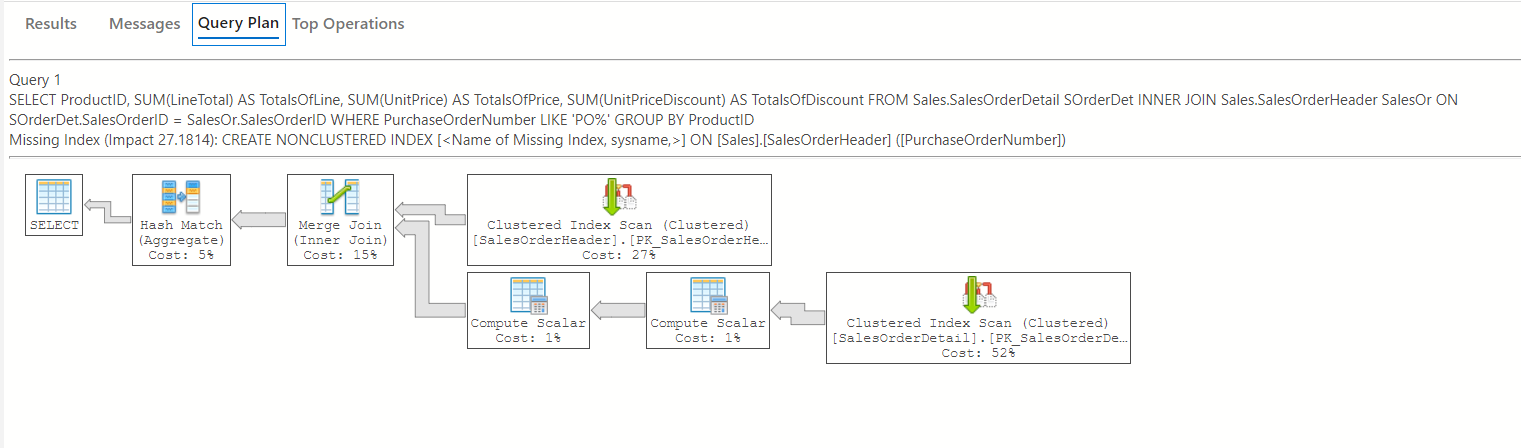
At the same time, we can find out the missing index suggestions under the query text. In the Top Operations tab, we can see a table report that contains various statistics about the estimated query plan operators.
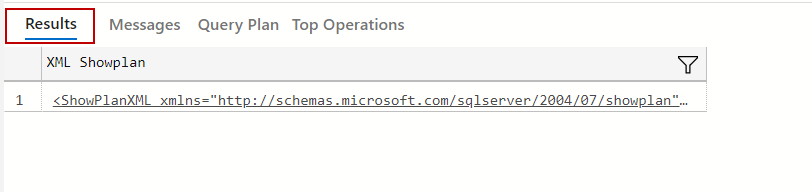
The Results tab shows the XML format of the estimated SQL execution plan.
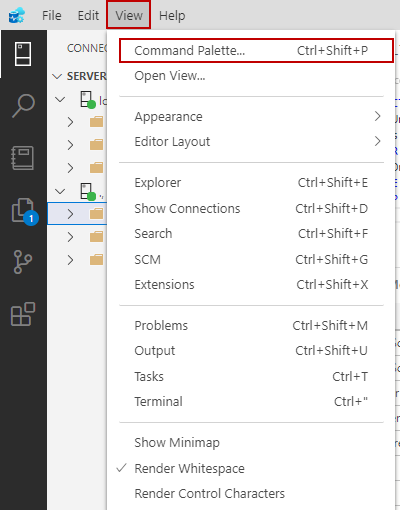
We need to enable the Command Pallete to display the actual query plan in Azure Data Studio. At first, we will expand the View menu and then select Command Pallete.
The Command Palette is a searchable command prompt that can be used to practically run commands or change settings. We type the “actual” keyword in the box and click the Run Current Query with Actual Plan.
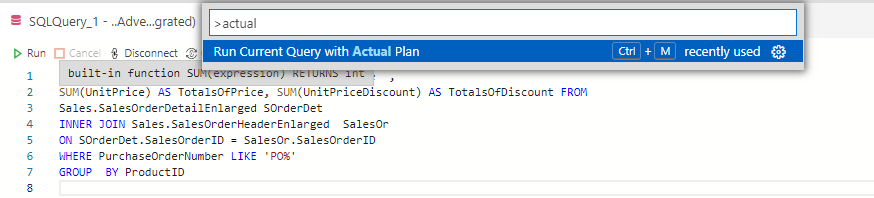
In this way, we will both execute the query and also we will obtain the actual query plan.
Tip: With the help of the extensions we can gain new functionalities to Azure Data Studio. For example Queryplan.show extension visualizes the query plan in a different style.

How to display an SQL execution plan in SQL Server Management Studio
SQL Server Management Studio (SSMS) is an advanced development environment that enables us to configure, manage and administrate SQL Server databases. At the same time, SSMS allows us to develop SQL queries. SSMS includes two simplistic features that help to obtain estimated and actual query plans. Under the Query menu of the SSMS, we can find out the following options:
- Display Estimated Execution Plan
- Include Actual Execution Plan
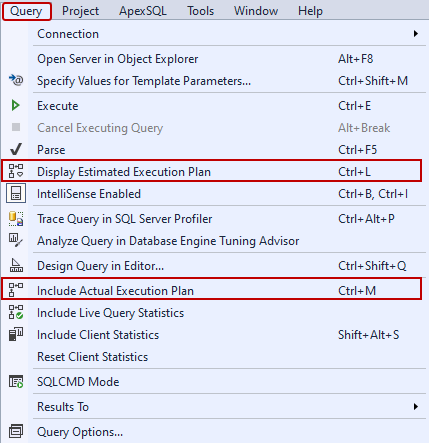
As an alternative method, we can use two small buttons where are located on the SQL editor toolbar.

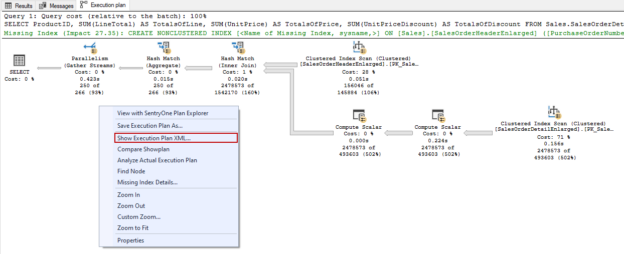
After clicking any of these buttons the graphical execution plan will appear on the Execution Plan tab. When we hover the mouse icon over the query plan operators, a detailed pop-up will be shown that includes detailed info about the operator.
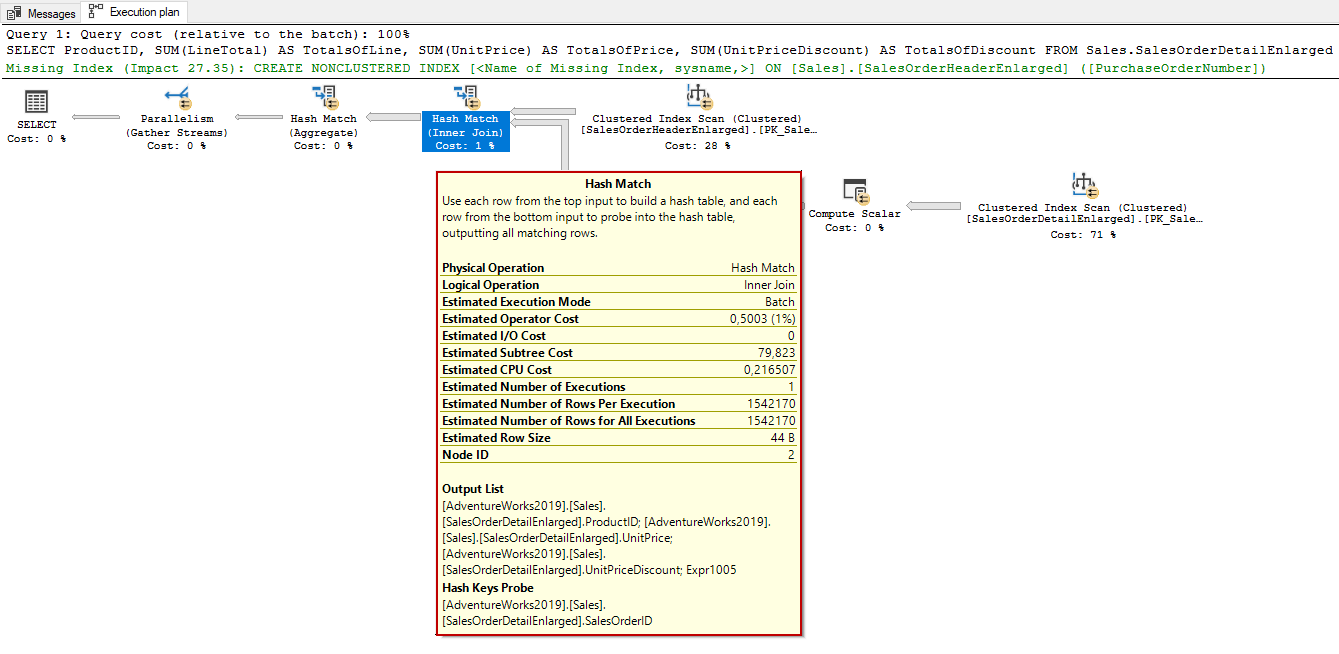
The plan arrows point out the data directions between the operators and how many rows are pumped into the next operator.
![]()
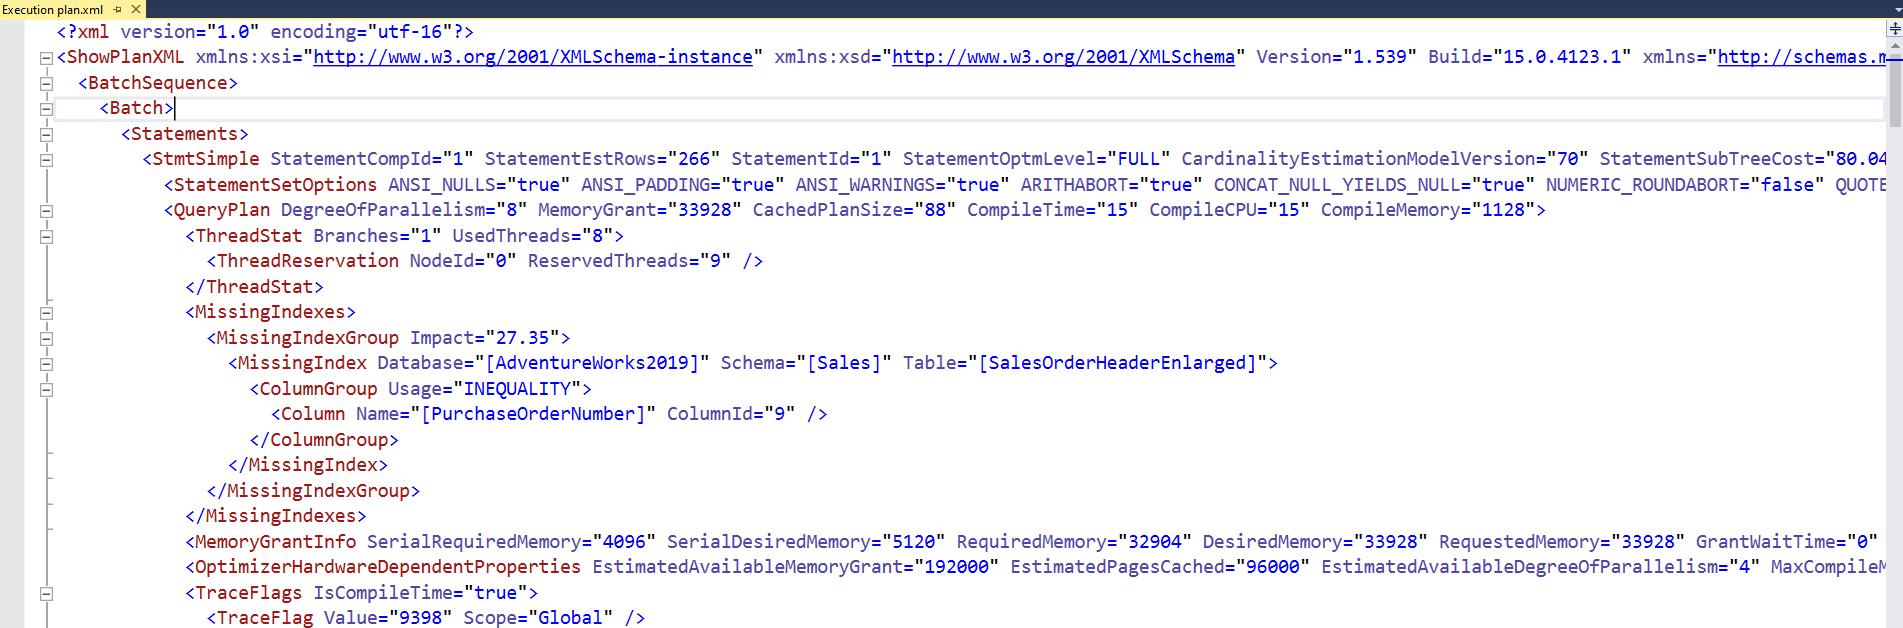
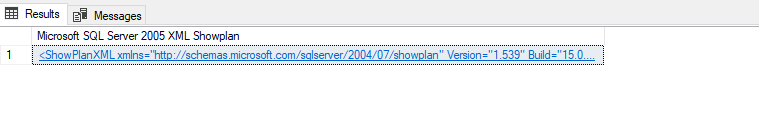
When we want to show the execution plan in an XML format, we right-click on the execution plan and choose the Show Execution Plan XML menu item.

After clicking this menu item, the plan will be displayed in XML format in a new window.
Using the SHOWPLAN command
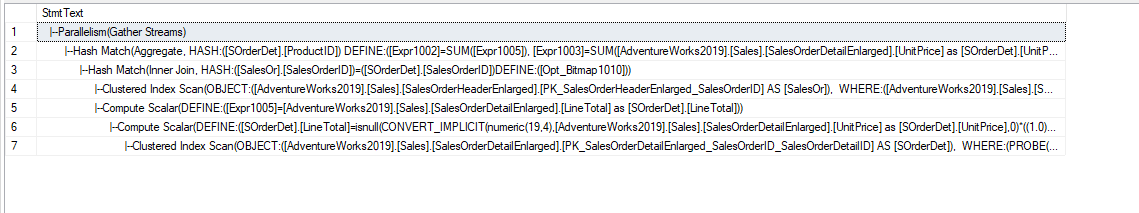
Besides the graphical query plans, we can obtain the execution plans in text or XML format with help of the SET SHOWPLAN command. The first command that we will learn is SHOWPLAN_TEXT. When we enable the SHOWPLAN_TEXT option before a query, a hierarchical tree result set will return that includes which operators will be performed in order. In fact, this result set contains very limited information, so it would not be very realistic to consider it as a complete query plan.
|
1 2 3 4 5 6 7 8 9 10 11 12 13 14 |
SET SHOWPLAN_TEXT ON GO SELECT ProductID, SUM(LineTotal) AS TotalsOfLine, SUM(UnitPrice) AS TotalsOfPrice, SUM(UnitPriceDiscount) AS TotalsOfDiscount FROM Sales.SalesOrderDetail SOrderDet INNER JOIN Sales.SalesOrderHeader SalesOr ON SOrderDet.SalesOrderID = SalesOr.SalesOrderID WHERE PurchaseOrderNumber LIKE 'PO%' GROUP BY ProductID GO SET SHOWPLAN_TEXT OFF |
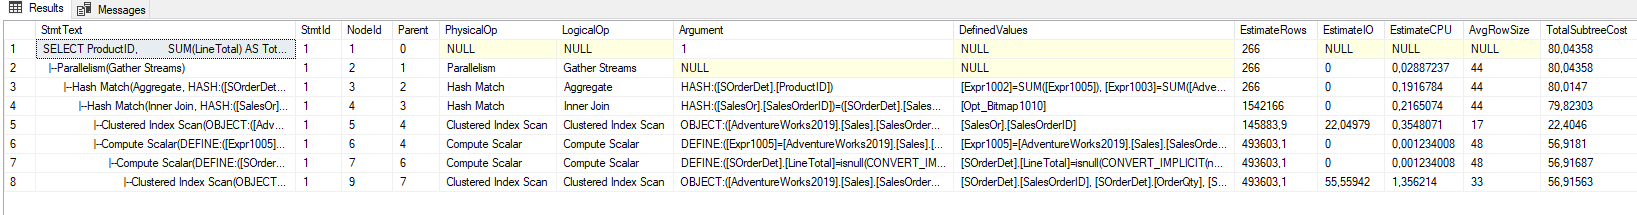
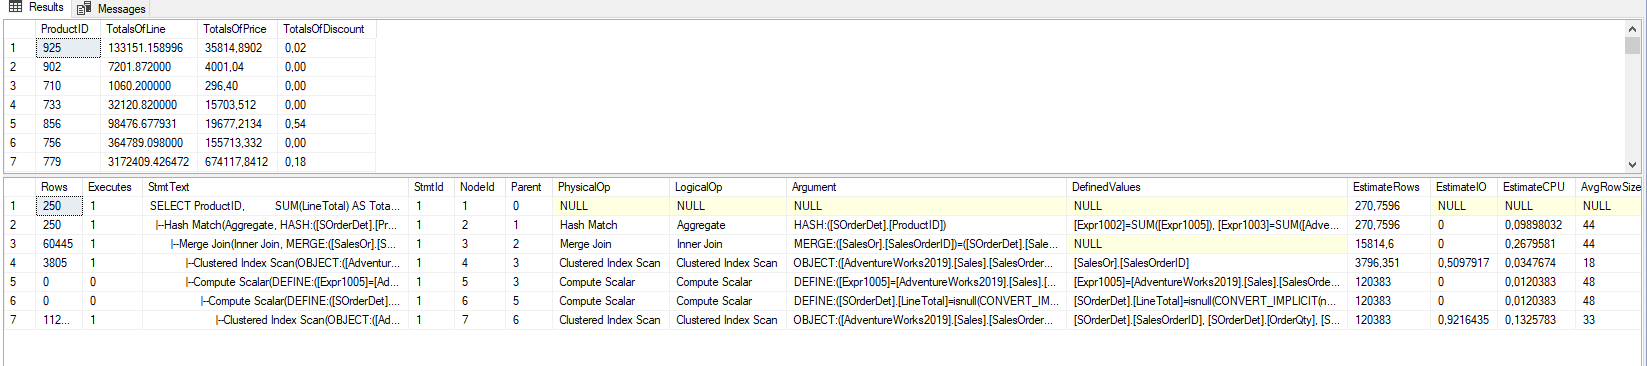
The SHOWPLAN_ALL is another option that we can use to get an estimated execution plan in a text format. The returned result set includes the estimated row numbers and other resource cost estimations.
|
1 2 3 4 5 6 7 8 9 10 11 12 13 14 |
SET SHOWPLAN_ALL ON GO SELECT ProductID, SUM(LineTotal) AS TotalsOfLine, SUM(UnitPrice) AS TotalsOfPrice, SUM(UnitPriceDiscount) AS TotalsOfDiscount FROM Sales.SalesOrderDetail SOrderDet INNER JOIN Sales.SalesOrderHeader SalesOr ON SOrderDet.SalesOrderID = SalesOr.SalesOrderID WHERE PurchaseOrderNumber LIKE 'PO%' GROUP BY ProductID GO SET SHOWPLAN_ALL OFF |
With help of the SHOWPLAN_XML command, we can display the estimated execution plan in an XML format. This command can be considered the same as XML formatted of the estimated query plan.
|
1 2 3 4 5 6 7 8 9 10 11 12 13 14 |
SET SHOWPLAN_XML ON; GO SELECT ProductID, SUM(LineTotal) AS TotalsOfLine, SUM(UnitPrice) AS TotalsOfPrice, SUM(UnitPriceDiscount) AS TotalsOfDiscount FROM Sales.SalesOrderDetail SOrderDet INNER JOIN Sales.SalesOrderHeader SalesOr ON SOrderDet.SalesOrderID = SalesOr.SalesOrderID WHERE PurchaseOrderNumber LIKE 'PO%' GROUP BY ProductID GO SET SHOWPLAN_XML OFF; |
As a last, we will take a glance at the STATISTICS PROFILE. After enabling this command, we can obtain the actual execution plan in text format with the query result set.
Using SQL Server query plan cache
SQL Server stores the compiled plans in the query plan cache so they can be reused by the query optimizer for the next execution of the queries. To view these cached plans we can use the dm_exec_cached_plans dynamic management view. Through the following query, we can return cached query plans.
|
1 2 3 4 5 6 |
SELECT UseCounts, Cacheobjtype, Objtype, TEXT, query_plan FROM sys.dm_exec_cached_plans cp CROSS APPLY sys.dm_exec_sql_text(plan_handle) sqltext CROSS APPLY sys.dm_exec_query_plan(plan_handle) queryplan |
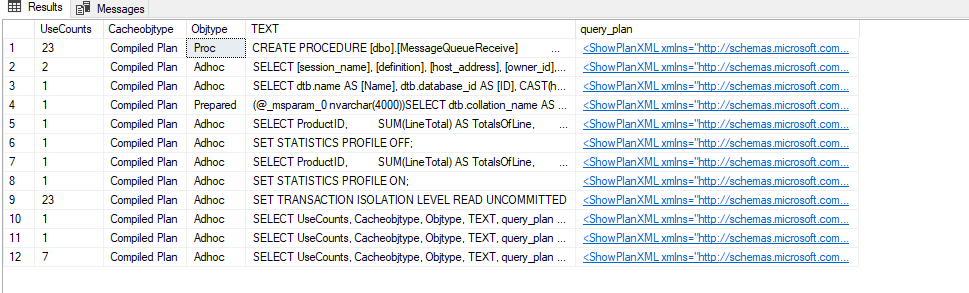
UseCounts: How many times the cached query plan is referenced.
Cacheobjtype: Type of object in the cache.
Objtype: SQL Server can store query plans for different objects and this column shows the database object type.
TEXT: Cached object literal query text.
query_plan: Estimated SQL execution plan.
Using Query Store
SQL Server Query Store stores the SQL execution plan and performance metrics of the queries automatically. The main advantage of the Query Store is to offer different reports to analyze the query performance and enable force a query to use a specific execution plan. The sys.query_store_plan internal table stores details about the SQL execution plans that are related to the queries that are captured by the query store.
|
1 2 3 4 5 6 7 8 9 10 |
SELECT plan_id, query_id, s.compatibility_level , s.last_execution_time, s.last_compile_duration, CAST(query_plan AS XML) AS 'Execution Plan' FROM sys.query_store_plan s |
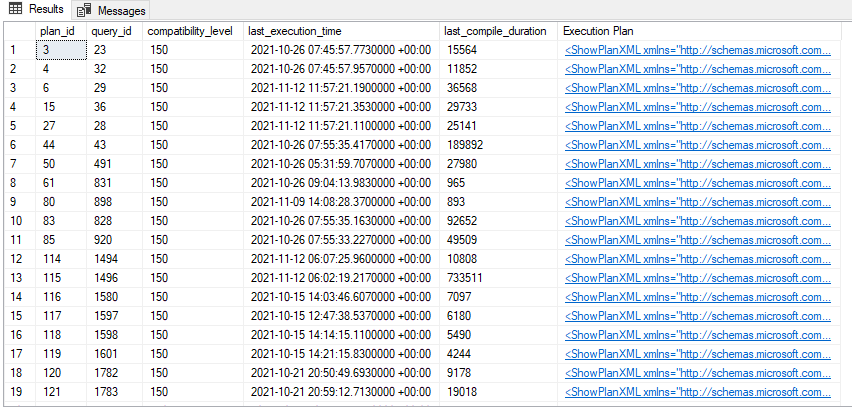
The displayed execution plans are the estimated SQL execution plans.
Using Extended Events
An Extended Event is a monitoring tool that captures the various activities that are performed in the database engine. The events can capture estimated or actual query plans of the executed queries:
query_post_compilation_showplans: This event captures the estimated query plan of a query when it is initially compiled.
query_post_execution_showplan: This event captures the actual SQL execution plan of a query when it is initially compiled.
The following query will create an extended event that includes the above-mentioned events. Additionally, it will filter the captured event only for the particular database.
|
1 2 3 4 5 6 7 8 9 10 11 12 |
CREATE EVENT SESSION [CaptureQueryPlans] ON SERVER ADD EVENT sqlserver.query_post_compilation_showplan( ACTION(sqlserver.session_id,sqlserver.sql_text) WHERE ([sqlserver].[database_name]=N'AdventureWorks2019')), ADD EVENT sqlserver.query_post_execution_showplan( ACTION(sqlserver.session_id,sqlserver.sql_text) WHERE ([sqlserver].[database_name]=N'AdventureWorks2019')) WITH (STARTUP_STATE=OFF) GO ALTER EVENT SESSION CaptureQueryPlans ON SERVER STATE = START |
After creating and enabling the extended event, we will launch the Watch Live Data screen to observe the captured events. Firstly, we will clear the query plan cache for the Adventureworks database.
|
1 2 3 |
ALTER DATABASE SCOPED CONFIGURATION CLEAR PROCEDURE_CACHE |
As a next step, we will execute our sample query two times and interpret the captured data that are
|
1 2 3 4 5 6 7 8 9 10 11 |
SELECT ProductID, SUM(LineTotal) AS TotalsOfLine, SUM(UnitPrice) AS TotalsOfPrice, SUM(UnitPriceDiscount) AS TotalsOfDiscount FROM Sales.SalesOrderDetail SOrderDet INNER JOIN Sales.SalesOrderHeader SalesOr ON SOrderDet.SalesOrderID = SalesOr.SalesOrderID WHERE PurchaseOrderNumber LIKE 'PO%' GROUP BY ProductID GO 2 |
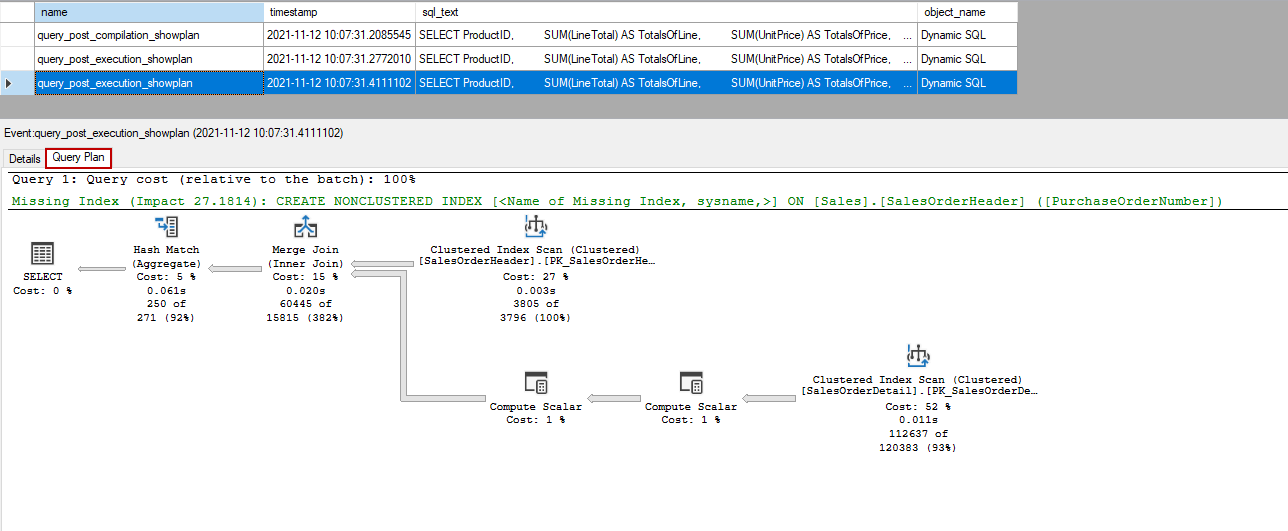
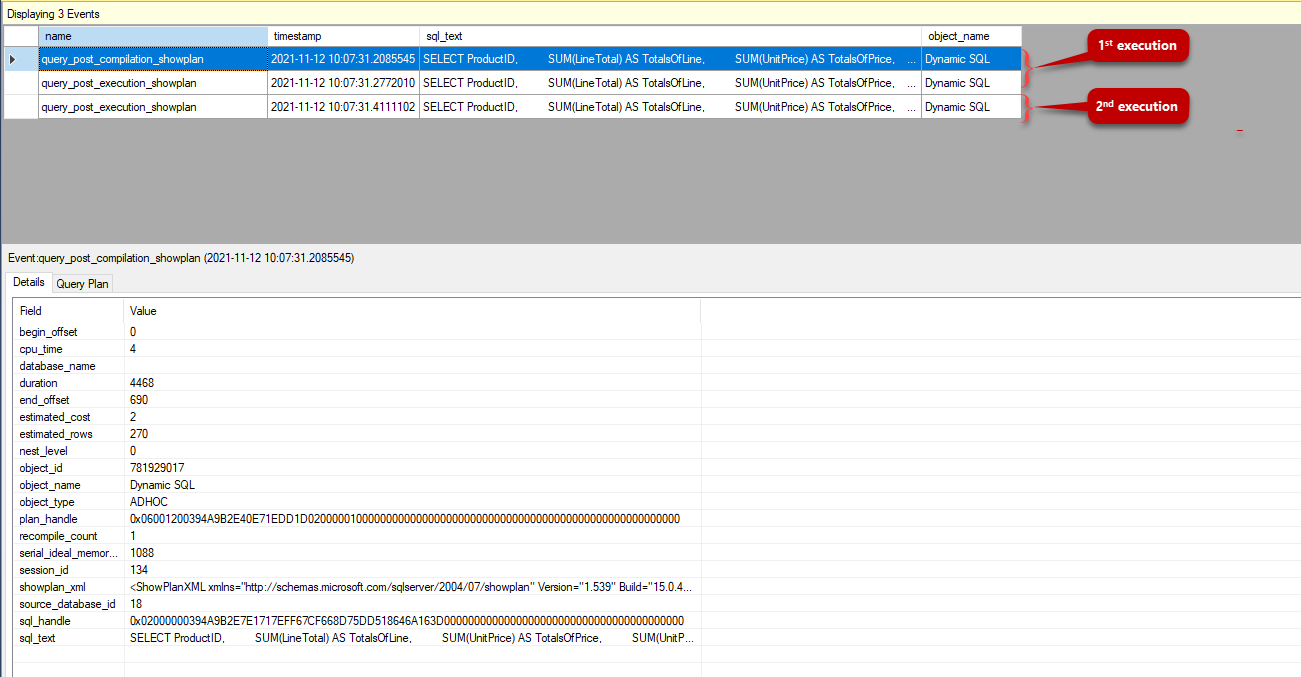 In the first execution of the query, the query plan is not in the plan cache therefore the query is initially compiled, and then it is added into the query plan cache. For this reason, the query_post_compilation_showplan event is captured but in the second execution, we can not see this event because the optimizer finds an appropriate cached plan and use it. We can obtain the graphical execution plan by jumping the Query Plan tab.
Summary
SQL execution plans include all details about query execution steps therefore it plays a crucial role to understand the back-stage activities and resolve the performance issues. In this context, we can use different tools or commands to display query plans:
- Azure Data Studio
- SQL Server Management Studio
- SHOWPLAN command
- Query Store
- Extended Events

Most of his career has been focused on SQL Server Database Administration and Development. His current interests are in database administration and Business Intelligence. You can find him on LinkedIn.
View all posts by Esat Erkec
- SQL Performance Tuning tips for newbies - April 15, 2024
- SQL Unit Testing reference guide for beginners - August 11, 2023
- SQL Cheat Sheet for Newbies - February 21, 2023