
In this article, we are going to explore different ways to check the SQL Server uptime. We can determine SQL Server uptime by using any of the following methods:
- Querying SQL Server dynamic management views
- SQL Server database monitoring dashboard
- Windows Event viewer
- SQL Server error log
For demonstration, I am restarting the SQL Server services at 00:10 hours. We are restarting the SQL Server services using SQL Server configuration manager. You can read How to use SQL Server Configuration Manager to learn more about the SQL Server configuration manager. Let us understand all methods.
Querying SQL Server dynamic management views
We can use any of the following dynamic management views.
When we restart the SQL Server services, the TempDB database is created. So we can consider the value of the create date column of the sys.databases DMV as SQL Server instance uptime. Run the following query:
|
1 2 3 |
use master go select name, create_date from sys.databases where name='tempDB' |
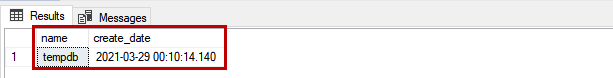
As you can see in the output, the value of the TempDB database is 00:10:14.
This method is not accurate because the user databases and system databases initialize before the TempDB database initializes during the startup process. Sometimes, the user databases and system databases take longer to initialize, so the initialization time of TempDB depends on the time taken to initialize other databases.
We can get the SQL Server instance uptime by querying the sys.sysprocesses DMV. The login time shows the instance startup time. Run the following T-SQL query.
|
1 2 3 |
use master go SELECT login_time as [SQL Server Instance Uptime] FROM sys.sysprocesses where spid=1; |
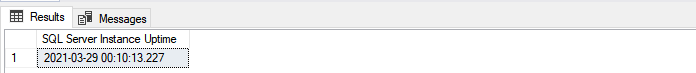
As you can see, the instance startup time returned by the query is 00:10:13.227.
In the SQL Server 2008 and later versions, we can use Sys.dm_os_sys_info DMV to get the SQL Server uptime. This DMV provides accurate instance startup time. Run the following query:
|
1 2 3 |
use master go select sqlserver_start_time as [SQL Server Instance Uptime] from sys.dm_os_sys_info |
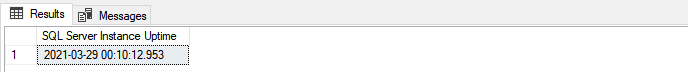
As you can see in the above image, the SQL Server startup time is 00:10:12.953.
- Note: The TempDB creation time is 00:10:14, and the value returned by the DMV is 00:10:12.953, which indicates that it took two seconds to initialize other user databases
SQL Server database monitoring dashboard
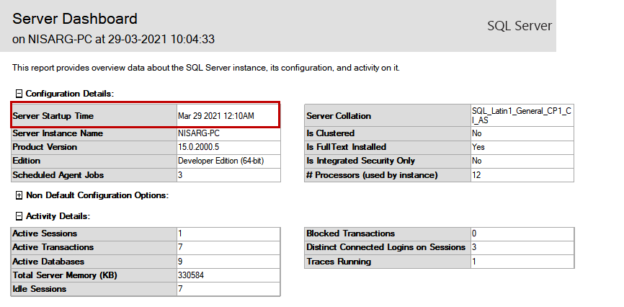
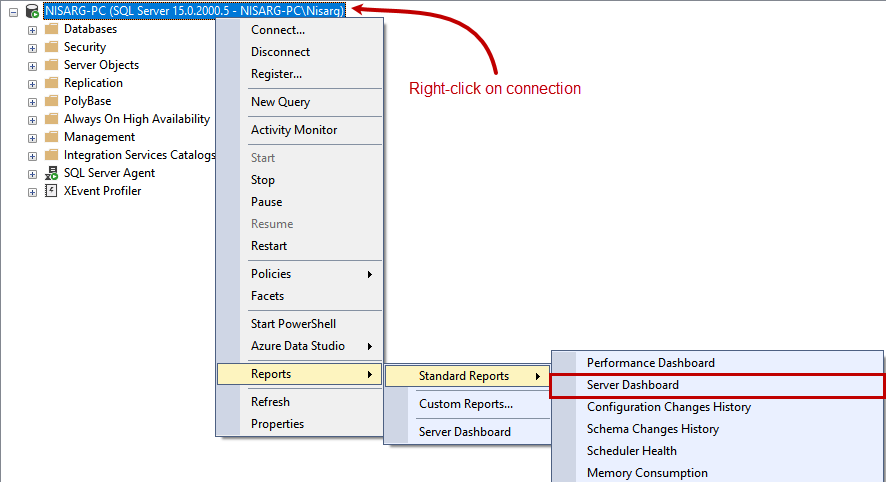
We can view the SQL Server instance uptime from the SQL Server monitoring dashboard. It’s built-in reports used to monitor the real-time performance of the SQL Server instances and the databases. To view the report, right-click on the SQL Server connection Hover on Reports Hover on Standard Reports Click on Server dashboard.
In the server dashboard report, you can view the details of the SQL Server instance. The SQL Server instance uptime is in the Server Startup Time dashboard of the Configuration Details grid. The Server startup time is in HH: MM AM/PM format.
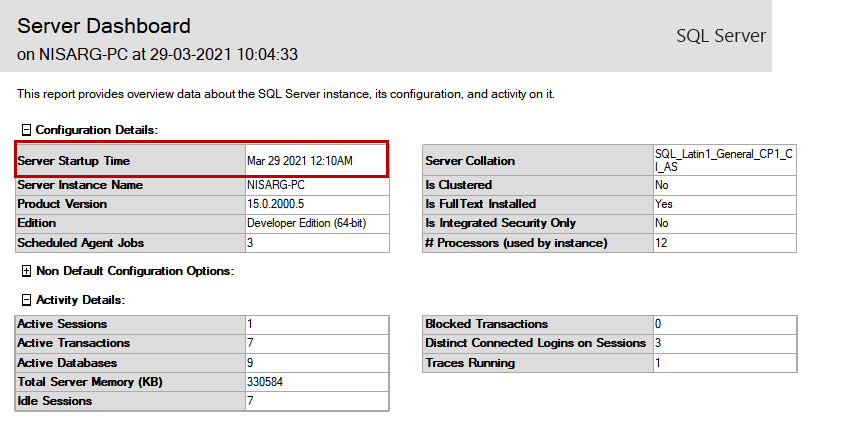
As you can see in the above screenshot, the server startup time is 12:10 AM.
Windows Event viewer
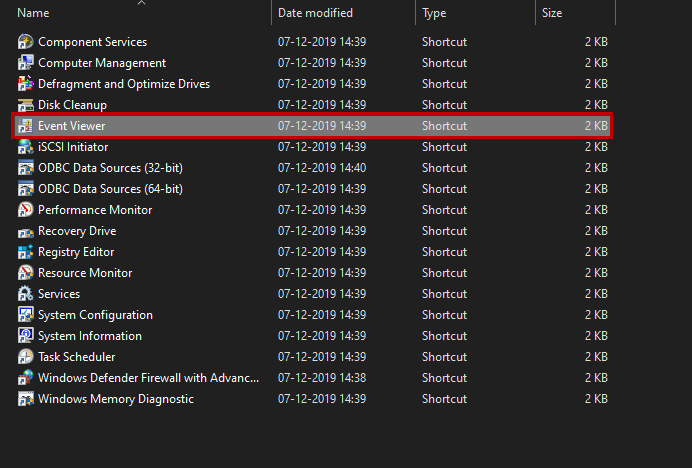
We can view the SQL Server instance uptime from the windows event viewer. Open Control Panel Open Administrative tools Click on Event viewer.
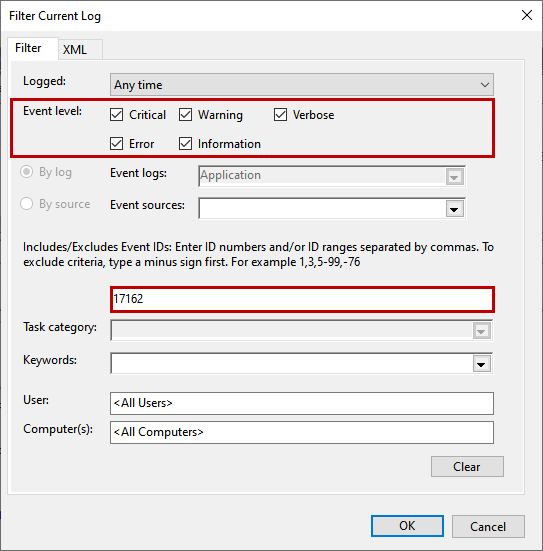
In the event viewer MMC (Microsoft Management console), expand Windows Logs Click on Application. You can see the numerous events that occurred on the workstation. To identify the service startup time, we must filter the event ID 17162. To filter the event log, click on Filter current log in the right-pan of the event viewer.
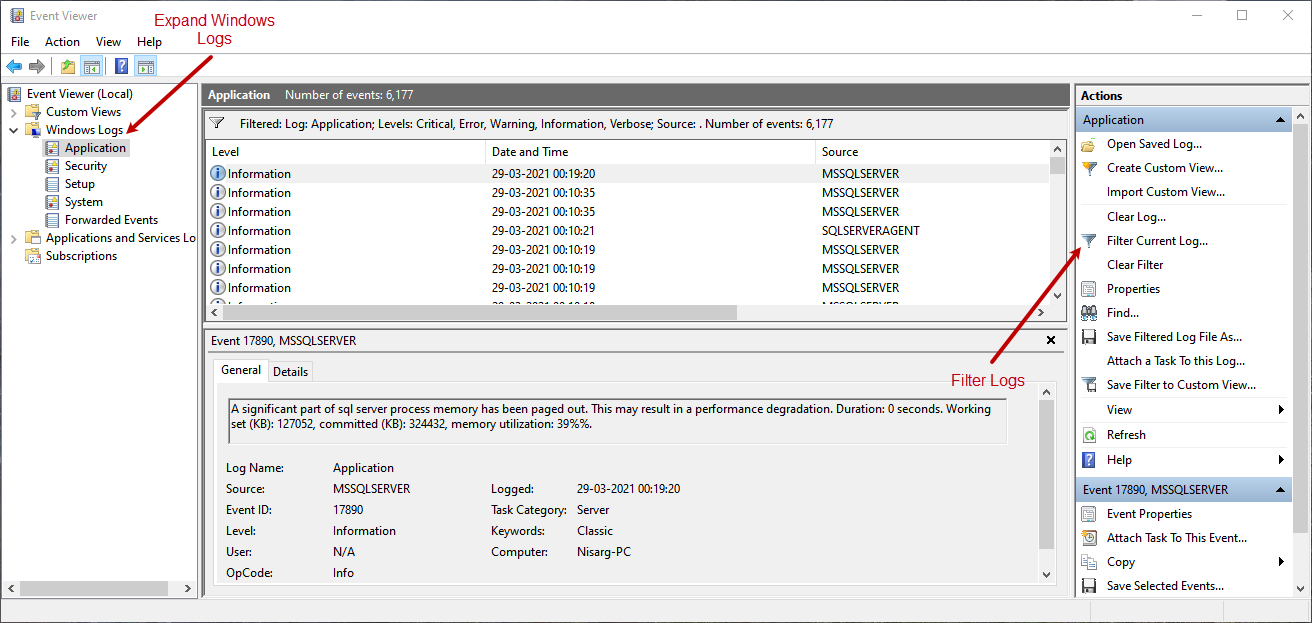
In the filter current log, select all event levels, specify the 17162 event ID in the event ID text box and click OK.
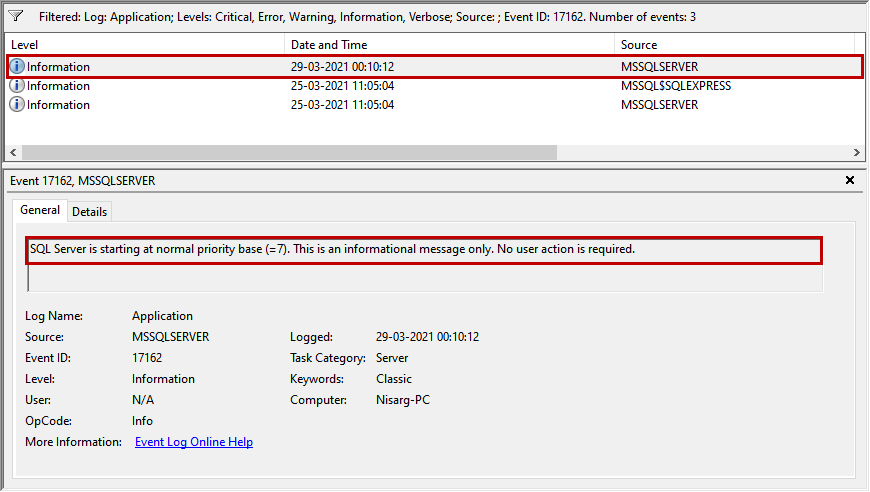
Click on the event whose source is MSSQLSERVER and Level is information. In the general information pane, you can see the information message with the SQL Server instance uptime.
SQL Server error log
When we restart the SQL Server services, the system stored procedure named sp_cycle_errorlog executes. The procedure creates a new errorlog file. In the new errorlog file, the instance startup time and event details are written.
This method does not provide accurate instance startup time, but it gives the closest time of instance uptime. You can access the error log using SQL Server Management Studio (SSMS) and the system stored procedure named xp_readerrorlog.
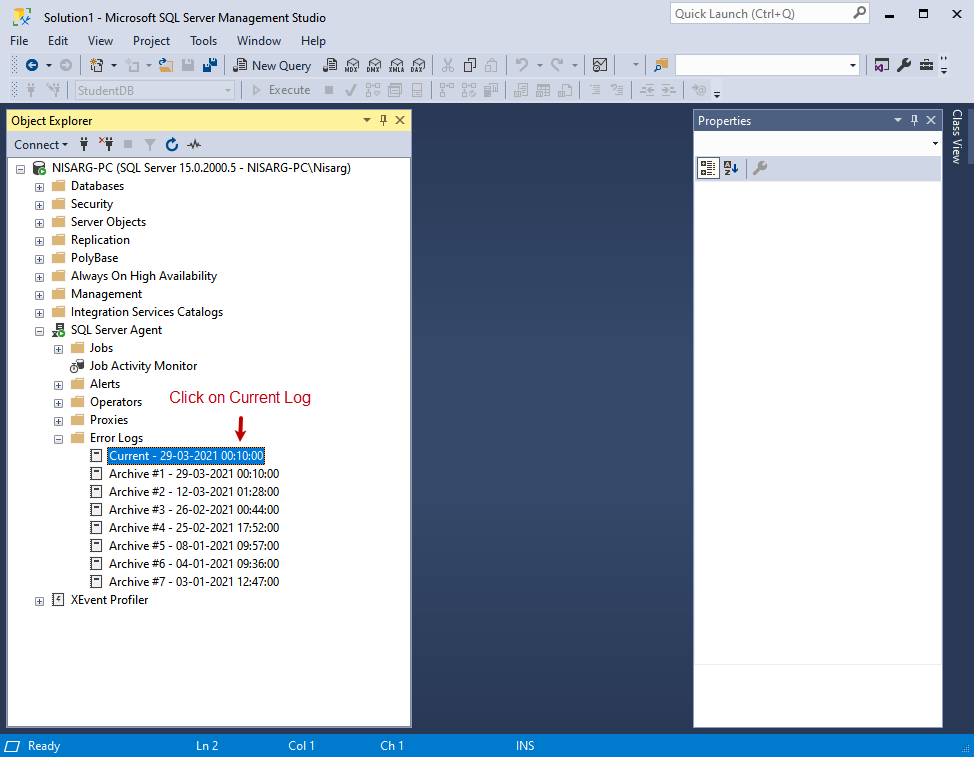
To view the error log using SQL Server Management Studio, Open SSMS Connect to SQL Server instance Expand SQL Server Agent node Expand Error Logs Click on Current.
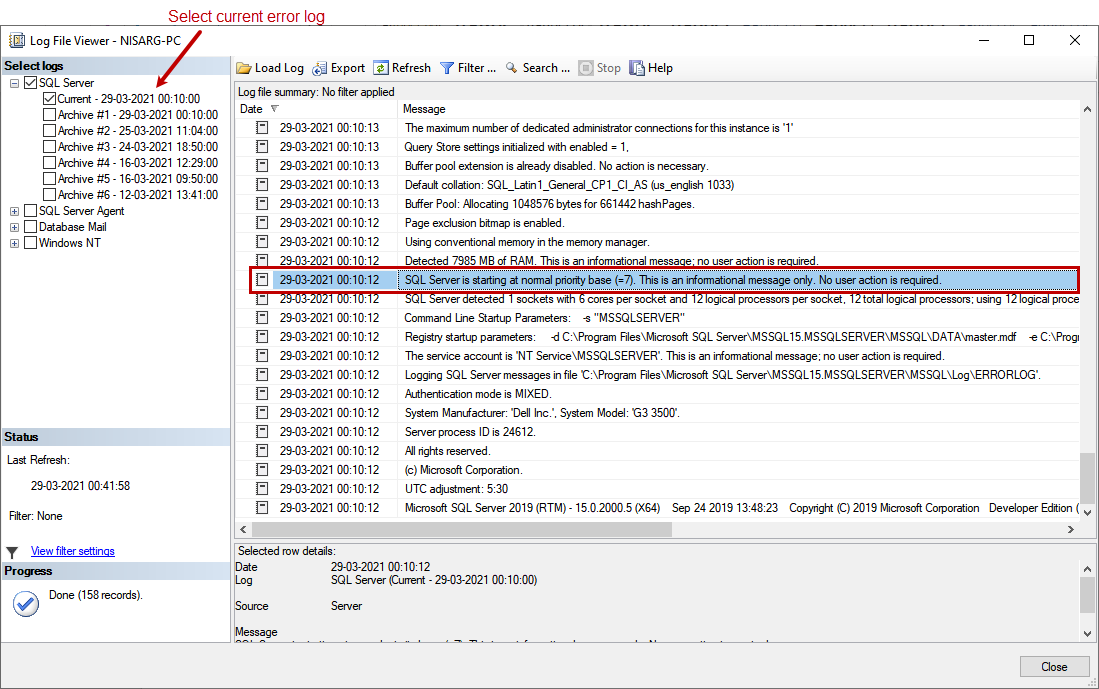
In the Error log file viewer, expand SQL Server and select on Current Log. In the list of the events, you can view the SQL server instance uptime.
Alternatively, we can use the xp_readerrorlog stored procedure to view and filter the error log of the SQL Server. You can read SQL Server error logs using the xp_readerrorlog command to learn more about the xp_readerrorlog stored procedure.
To populate the instance startup time, run the following query:
|
1 2 3 |
use master go EXEC xp_ReadErrorLog 0, 1, N'SQL',N'Starting' |
The above query filters the error log of SQL Server and searches the error text containing ‘SQL’ and ‘starting’ keywords.
The output is the following:
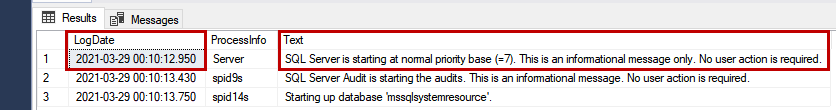
As you can see in the above image, the instance startup time is specified in the LogDate column.
Summary
In this article, we explored different ways to check the SQL Server uptime.

He has expertise in database design, performance tuning, backup and recovery, HA and DR setup, database migrations and upgrades. He has completed the B.Tech from Ganpat University. He can be reached on nisargupadhyay87@outlook.com
- Copy SQL Databases between Windows 10 and CentOS using SQL Server data tools - October 19, 2022
- Changing the location of FILESTREAM data files in SQL Database - October 14, 2022
- Manage SQL Databases in CentOS: Manage filegroups of user databases - October 5, 2022