
In Data Warehouse language, slicing and dicing is done with Dimension Attributes. Sometime a developer feels the need to provide everything to end users, whereas seasoned Business Intelligence Architects understand to provide only the attributes from the requirements. It is a hard path to follow and the seasoned architect’s experience might be the better option.
Multidimensional Cubes (cubes) handle the attribute list differently than the Tabular Model for SQL Server Analysis Services (SSAS). The cube wizard selects dimensions not previously defined but based on relationships built in the Data Source View outside of the Dimensions already built. If these dimensions are not deselected during the cube wizard, the dimension is built with Keys only. On the other hand, the Tabular Model will select all the columns in a table or view imported like the older versions SSAS for cubes.
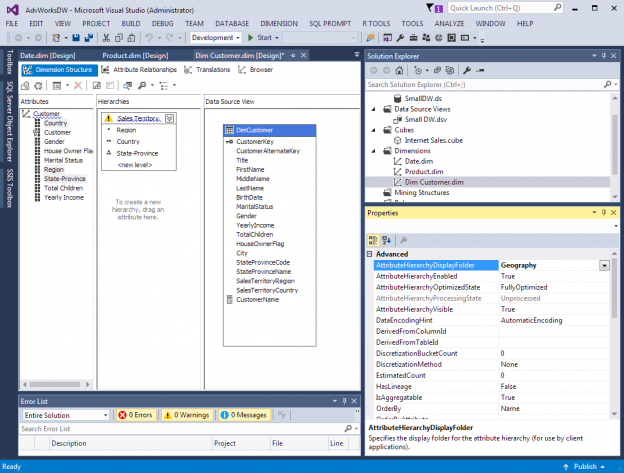
The cube created in the previous article, Initial Attributes and Measures in SSAS Multidimensional Cubes, had the Date Dimension created through the dimension wizard and was completed before running the cube wizard. But, the other dimensions related to the fact table selected were created with the Cube wizard and added as dimensions like Dim Product and Dim Customer in Figure 1.
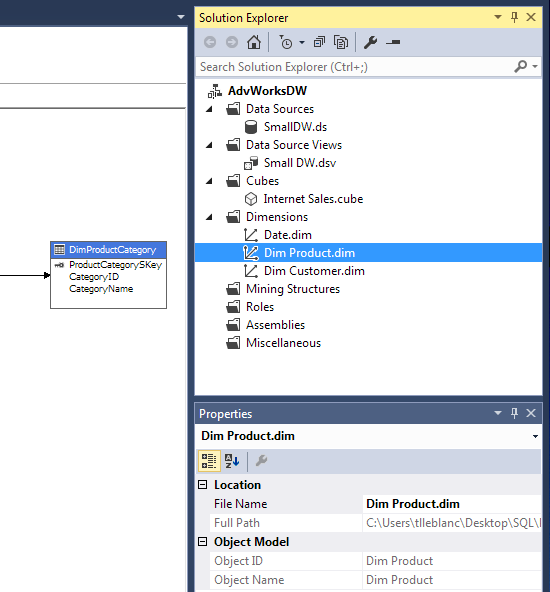
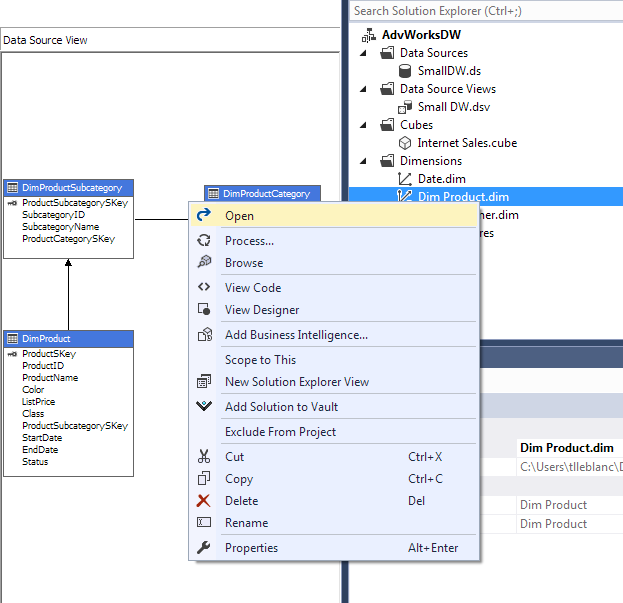
To update the new dimensions, go to the Dimensions folder in the solution explorer and double click the Dim Product dimension or right click and select Open from the submenu.
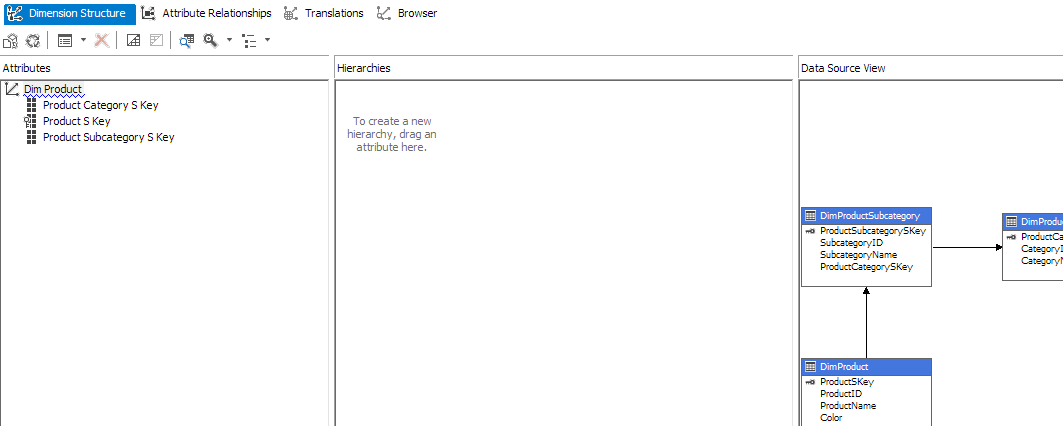
The Dimension editor will open to the Dimension Structure Pane, but also note there are 3 other panes (or tabs): Attribute Relationships, Translations and Browser.
There needs to be some cleaning up of the names used for attributes and dimension name as well as adding new attributes and changing the NameColumn for the keys. Right clicking on these names and select rename from the submenu will assist in this task. After renaming, deploy the cube in order to browse the changes. It is always good to deploy the project when making changes with Multidimensional Cubes. If too many changes are made at once, an error during deployment might be harder to catch.
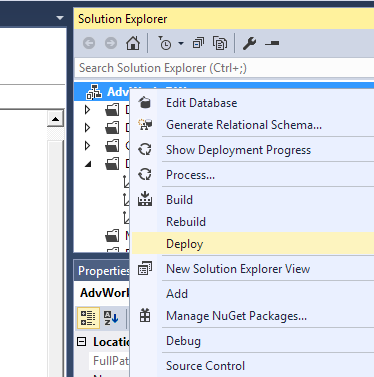
To Deploy, right click the project and select Deploy from the submenu like Figure 4.
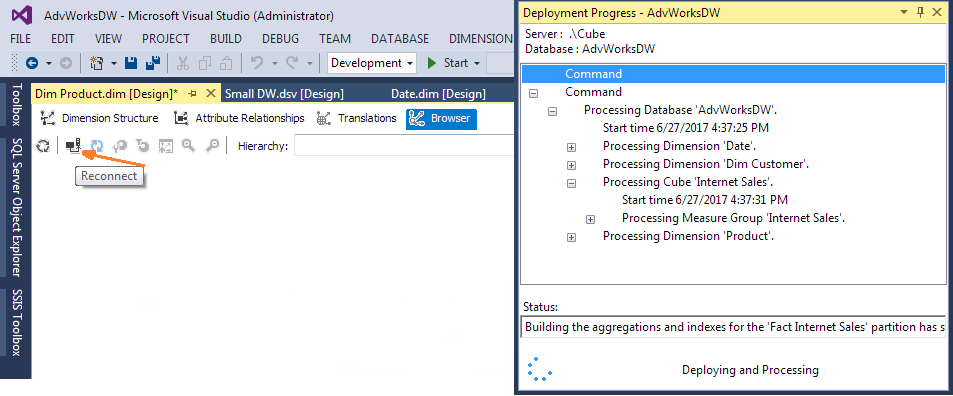
After the cube is deployed, go to the Browser tab of the Dimension editor and reconnect to browse the changes.
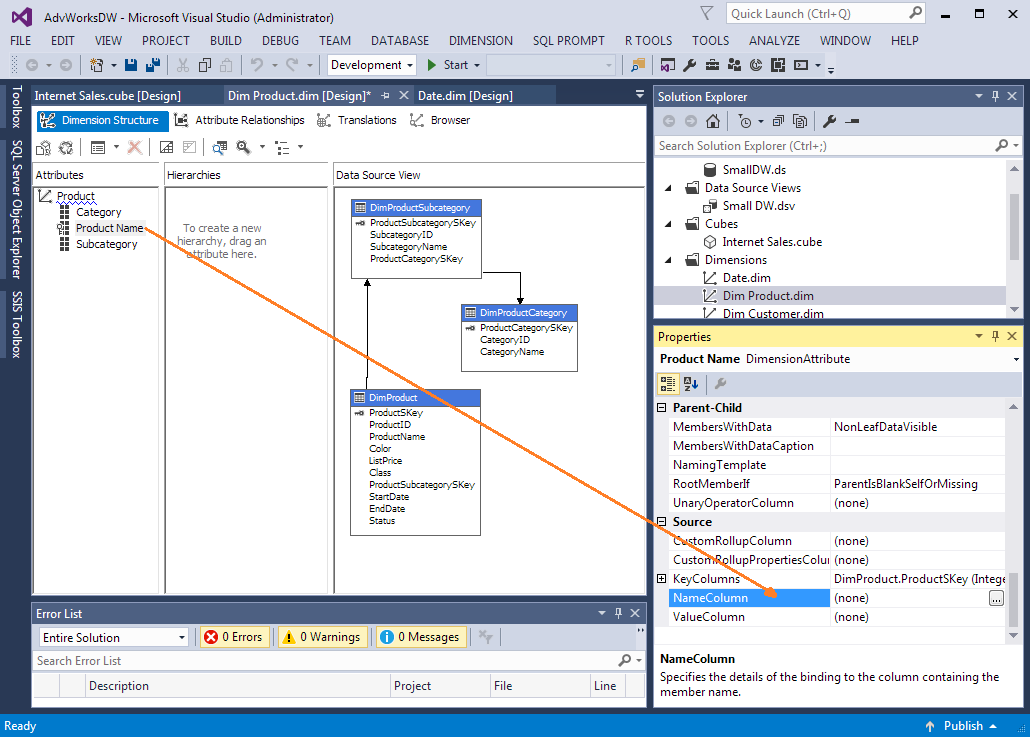
The Product, Category and Subcategory all have keys as the displayed values in this cube. Changing the NameColumn property will enable a different column value to be used. The end user does not want to see the integer key for product, they would want to see the Product Name. This example in Figure 6 changes the Product NameColumn to ProductName, Category to CategoryName and Subcategory to SubcategoryName.
Figure 6 also shows the Data Source View pane that contains the DimProduct, DimProductCategory and DimProductSubcategory tables plus their relationships. This was done by the Cube Wizard because the Dimension tables had foreign keys when connecting to the Data Source and creating the Data Source View. These Dimension tables can be separate Dimensions in the Cube if the user prefers that architecture.
The columns Color, ListPrice and Class are also added to the product dimension before another deployment. In addition to the new attributes, a hierarchy is create for Category/Subcategory/Product Name. Hierarchies are useful in visual reporting tools to show the Parent/Child relationship between attributes. This can be a natural hierarchy like Year/Qtr/Month/Day or a user hierarchy like Color and Class.
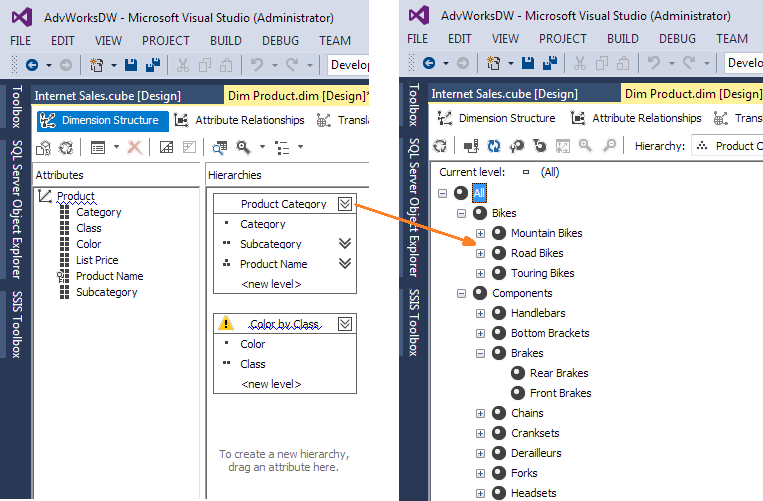
The blue squiggly line under the Hierarchy Color by Class indicates that there is not a relationship set in the Attribute Relationships for the Dimension between these two source columns for their attributes. Figure 8 shows the relationship for Category, Subcategory and Product Name. This indicator is only a warning and will not prevent the cube from being deployed. It is only a saying no relationship can cause performance issues when using large dimensions with this hierarchy type.
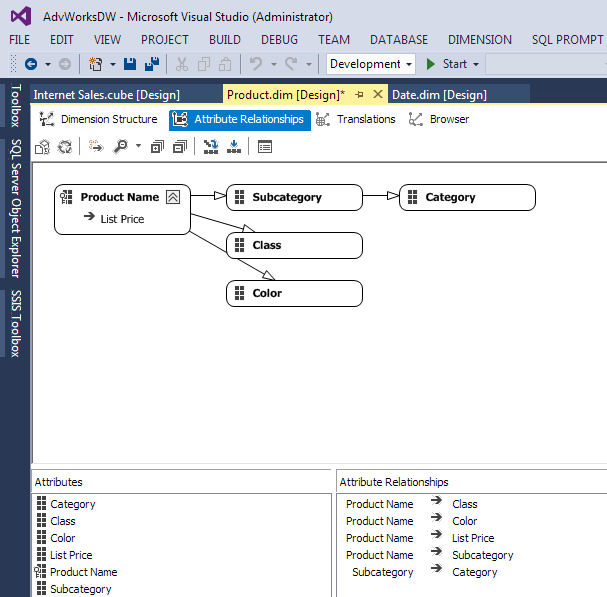
The Dimension understands that only one Category can be related to one Subcategory and one Subcategory for one Product. But, many Subcategories can have the same Category as well as many Products can have the same Subcategory. This is because the Data Source View has these as separate tables with relationships. That is not the case for Color and Class. The Color and Class columns are in the Product table and there is no direct relationship between the two attributes, at least that Analysis Services can see.
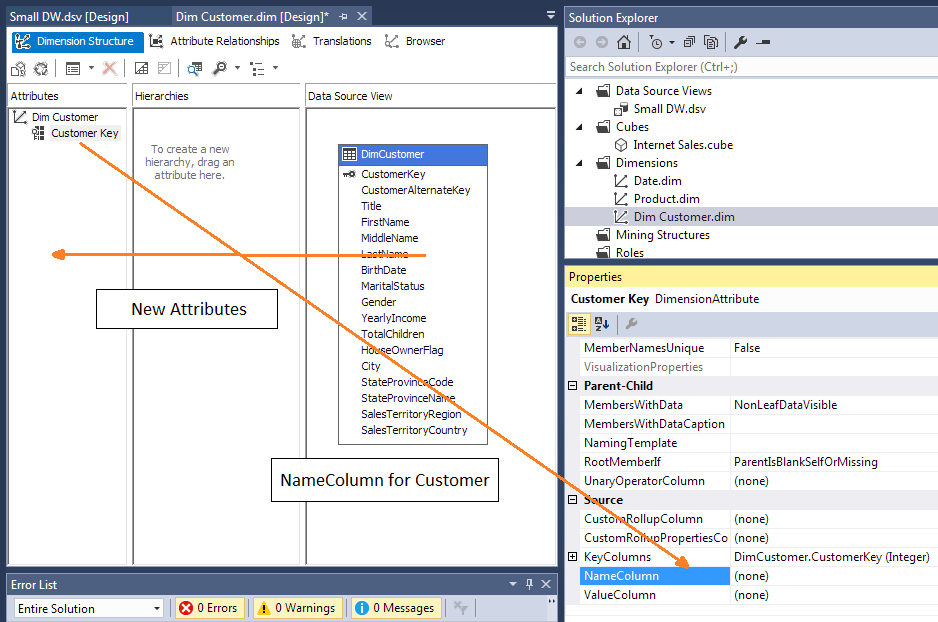
Figure 9 shows the Dim Customer and the changes needed for it to be useful. We need to update the Data Source View for the table DimCustomer in order to add a new column for the combination of LastName and FirstName. This will be used in the NameColumn of the Customer Key. Additional attributes related to Geography and Demographics are required for slicing and dicing
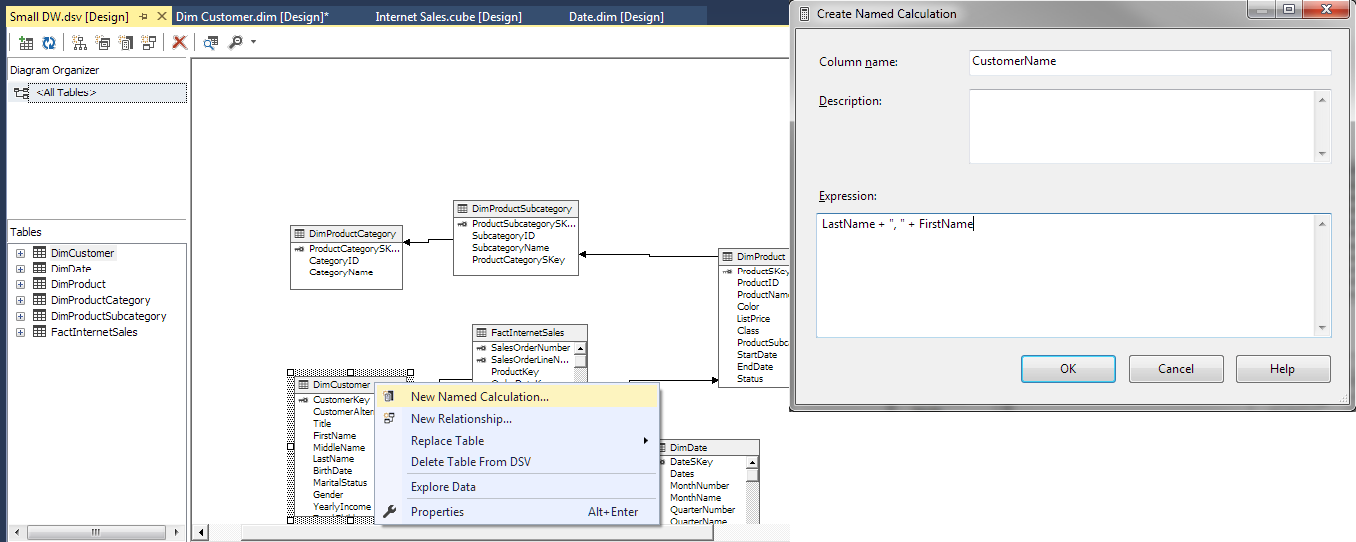
The Data Source View can be used to replace the table with a query or another table/view from a Data Source. Or, you could add the new column by right clicking the DimCustomer table and selecting New Named Calculation… The new column will be called CustomerName and can be created with the following statement: LastName + ‘, ‘ + FirstName
The Customer Key can be renamed to Customer and Dim Customer to Customer. The new attributes Gender, YearlyIncome, TotalChildren and HouseOwnerFlag will be used for Demographics and StateProvinceName, SalesTerritoryRegion and SalesTerritoryCountry will be used for Geography. Figure 11 shows the new attributes and NameColumn for Customer Key.
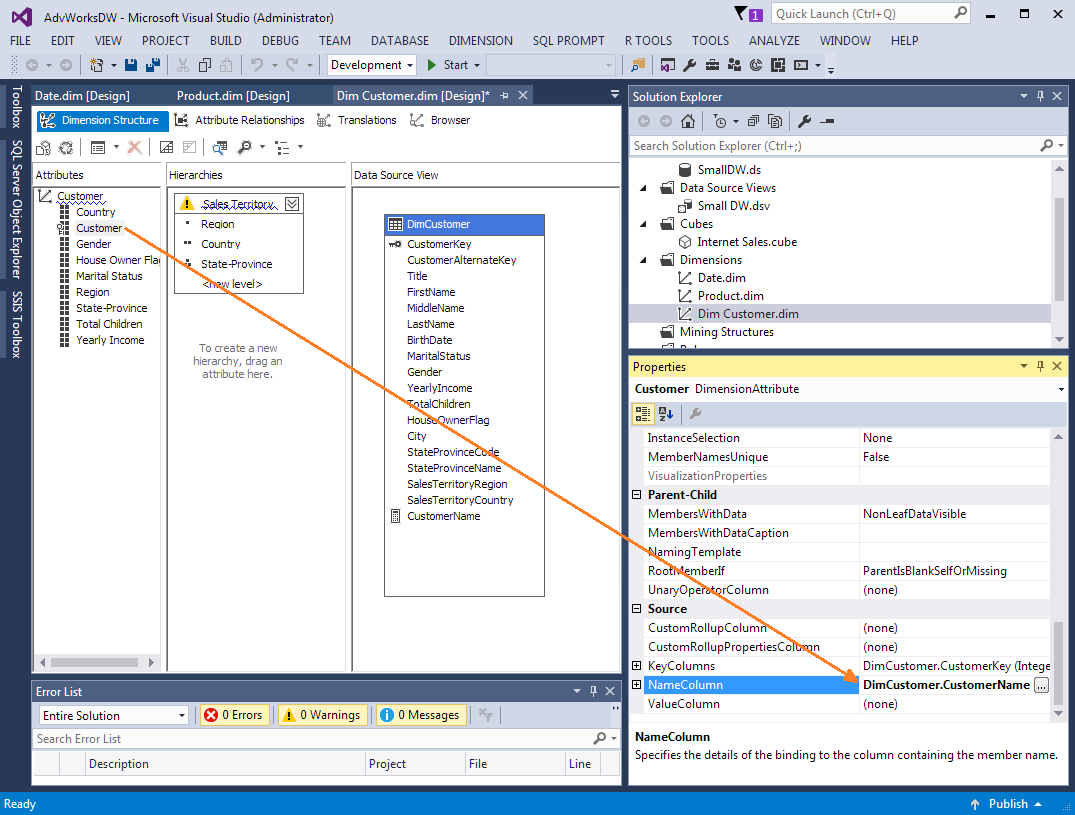
There is also a property for an attribute called AttributeHierarchyDisplayFolder that enables attributes to be organized into a folder structure for better display in tools like Excel. Figure 12 shows Geography used as the folder for Country, Region and State-Province. This dimension uses Demographics as a folder for attributes Gender, Marital Status, House Owner Flag, Total Children and Yearly Income.

NOTE: A better way to include or exclude columns for a Dimension or Fact table is to create a view. The view can be used in the Data Source View of Multidimensional Cubes or Data Import for Tabular Model. The only caution is when using views, the Data Source does not reveal foreign key relationships between the source dimension table and fact table. So, the relationship will have to be added after the view is added. Other benefits of using a view is a database administrator (DBA) can performance tuning the source table(s) of the view without impacting the structure of the dimension using the view. Also, if the source table does change structurally, then the view can be adopted to hide the changes like a column that is renamed.
Previous articles in this series:
- SQL Server Data Warehouse design best practice for Analysis Services (SSAS)
- Connecting to Data Source(s) with SQL Server Analysis Services
- Initial Attributes and Measures in SSAS Multidimensional Cubes
Useful links
- Modifying a Cube
- Dimensions
- Analysis Services (SSAS) Multidimensional Design Tips – Data Source View and Cubes

Starting as a developer in COBOL while at LSU, he has been a developer, tester, project manager, team lead as well as a software trainer writing documentation. Involvement in the SQL Server community includes speaking at SQLPASS.org Summits and SQLSaturday since 2011 and has been a speaker at IT/Dev Connections and Live! 360.
Currently, he is the Chair of the PASS Excel Business Intelligence Virtual Chapter and worked on the Nomination Committee for PASS Board of Directors for 2016.
View all posts by Thomas LeBlanc
- Performance tuning – Nested and Merge SQL Loop with Execution Plans - April 2, 2018
- Time Intelligence in Analysis Services (SSAS) Tabular Models - March 20, 2018
- How to create Intermediate Measures in Analysis Services (SSAS) - February 19, 2018