
Introduction
In our last two chats, we discussed enterprises that have had financial years that began in July and ended at the end of June. One of our clients works with this fiscal calendar and their financial folks are Excel “Fundi’s” (Fundisa is a Nguni word for “expert”). Many of their reports contain the current month’s sales, in addition, carrying running totals from the beginning of the fiscal year to date. An example may be seen in the screen dump below:
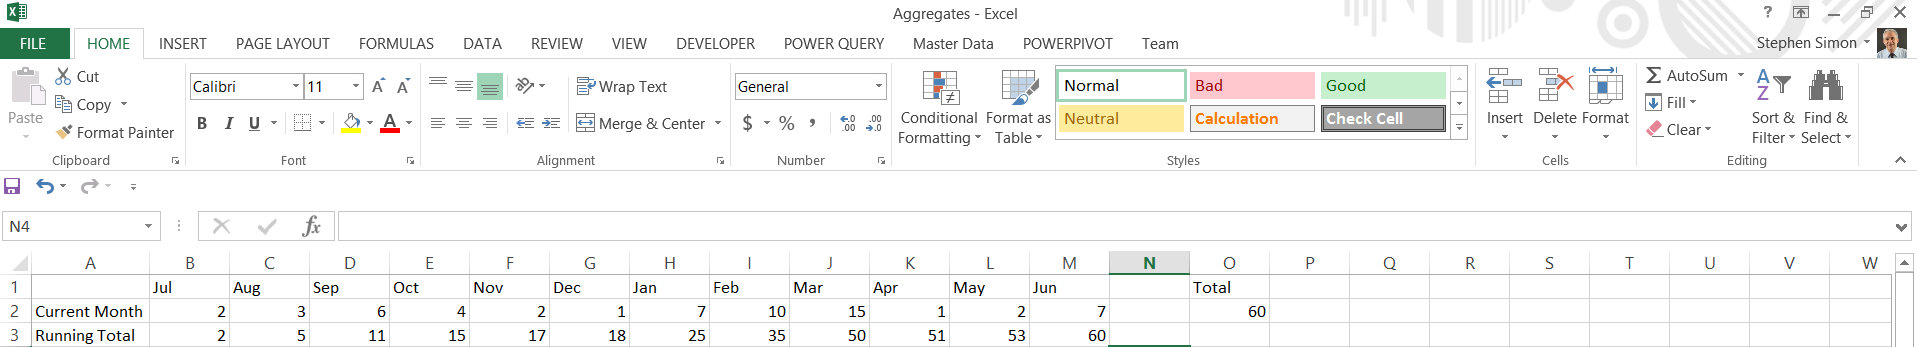
In today’s chat, we shall be concentrating on creating the necessary stored procedure to extract the data so that it may be placed in a Reporting Services matrix (similar to the Excel spreadsheet shown above). In doing so we are going to commit a SQL Server cardinal sin and utilize a small cursor. But then again, we are all adults and as such do not always do what we should. Not so?
Without further ado, let’s get started!
Getting started
SQL Shack financial is an organization that sells widgets to the public. Their fiscal year begins July 1 and ends June 30. Our data table contains a list of their sales from July 1 to present. Our task is to calculate the monthly income (on a monthly basis) and to have an additional column showing the year to date earnings.
We begin by having a look at our working data.
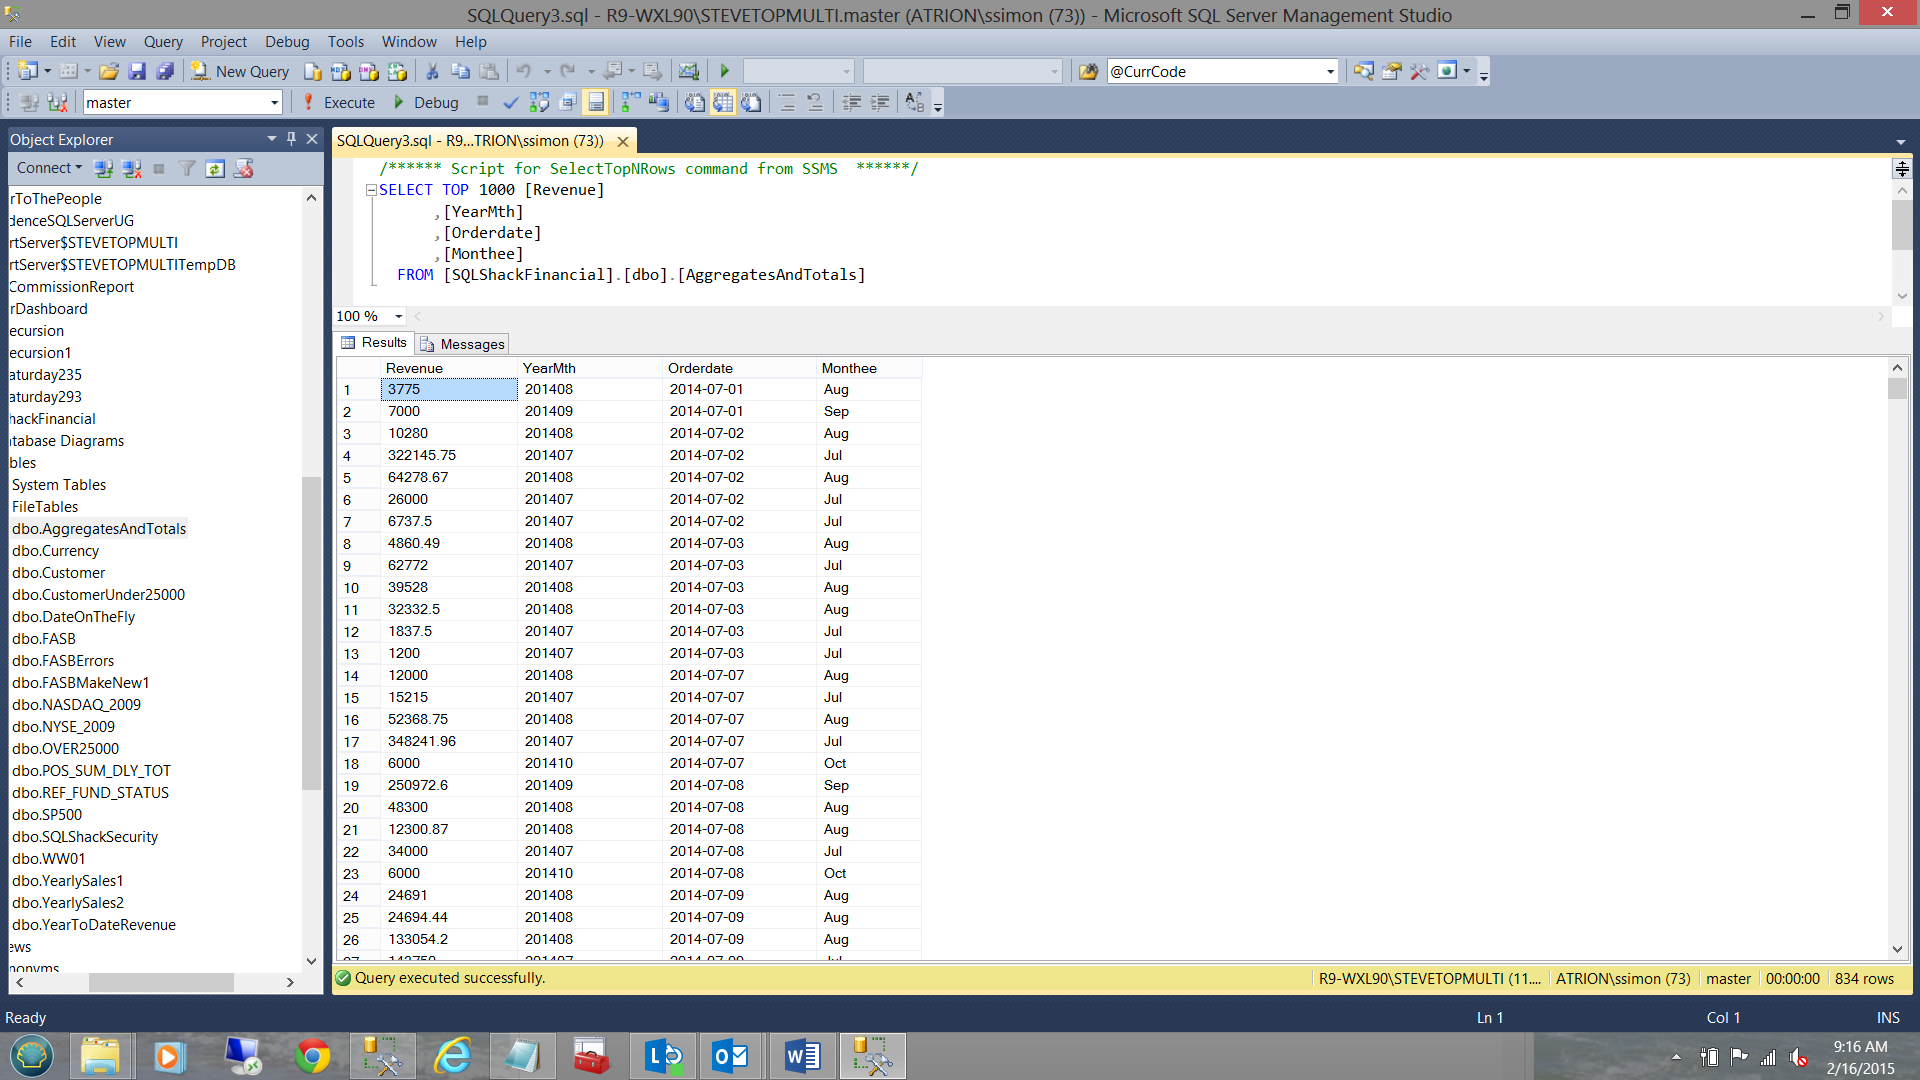
We note that within our data table there are four fields:
- Revenue
- Yearmth
- Orderdate
- Monthee
As our reporting is based on the concept of “a month”, the field “Orderdate” will only be utilized as a part of the predicate. “YearMth” however will be utilized as a grouping column.
Opening a new query window, we begin by declaring our stored procedure and a creating a few working variables (see below).
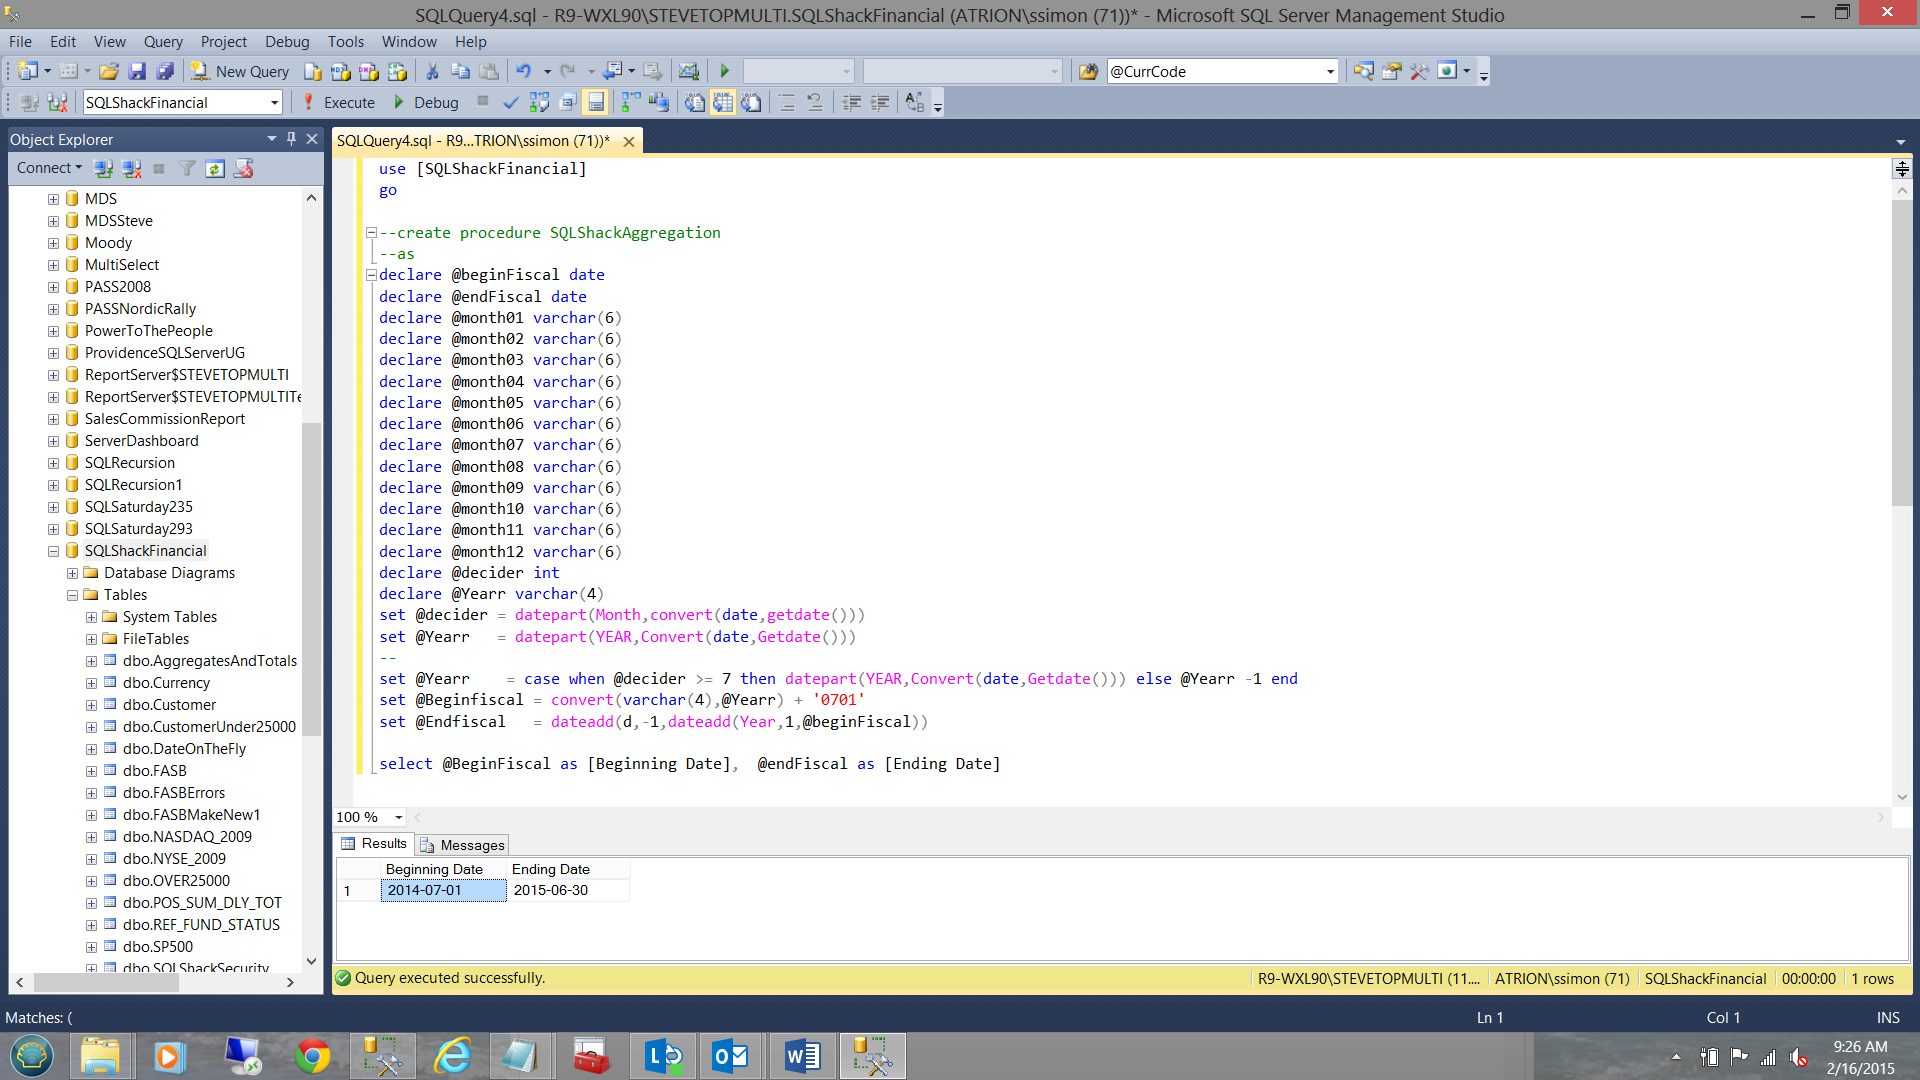
The reader will note that we declared two date variables (@BeginFiscal and @Endfiscal).
Additionally we declared twelve variables which will contain the values of “YearMth” for the twelve months of the current fiscal year. Finally we have a small start and end date routine that will ascertain the start and end date of the current fiscal year. See the code snippet below:
|
1 2 3 4 5 6 7 8 9 10 11 12 |
declare @decider int declare @Yearr varchar(4) set @decider = datepart(Month,convert(date,getdate())) set @Yearr = datepart(YEAR,Convert(date,Getdate())) -- set @Yearr = case when @decider >= 7 then datepart(YEAR,Convert(date,Getdate())) else @Yearr -1 end set @Beginfiscal = convert(varchar(4),@Yearr) + '0701' set @Endfiscal = dateadd(d,-1,dateadd(Year,1,@beginFiscal)) select @BeginFiscal as [Beginning Date], @endFiscal as [Ending Date] |
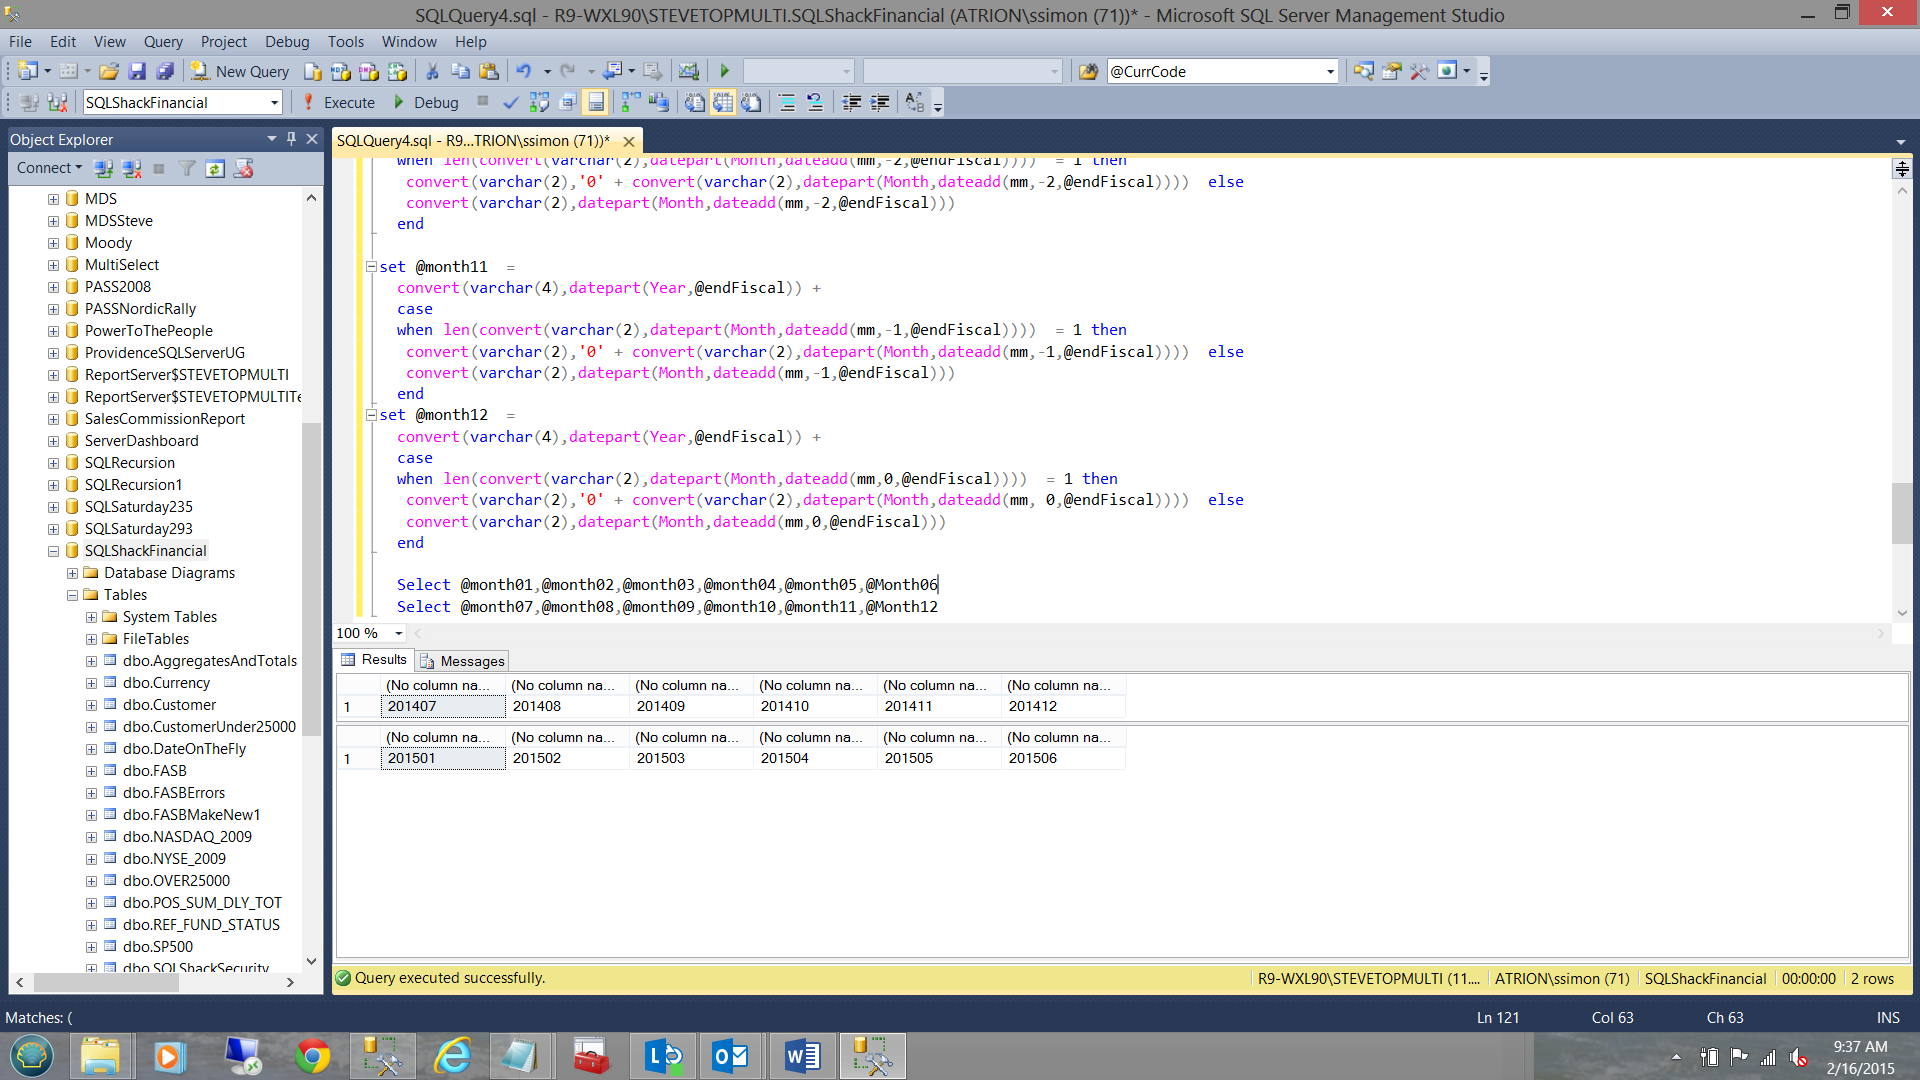
Now that with the necessary infrastructure in place, we shall calculate the values for our twelve monthly variables.
July is calculated as follows:
|
1 2 3 4 5 6 7 8 9 |
set @month01 = convert(varchar(4),datepart(Year,@beginFiscal)) + case when len(convert(varchar(2),datepart(Month,@beginFiscal))) = 1 then convert(varchar(2),'0' + convert(varchar(2),datepart(Month,@beginFiscal))) else convert(varchar(2),datepart(Month,@beginFiscal)) end |
If we were to parse this SQL statement, ‘201407’ would be rendered (in February 2015).
The values associated with these 12 variables may be seen in the screenshot below:
The complete code listing may be seen in ADDENDA 1.
We are now in a position to calculate the monthly earnings (see below).
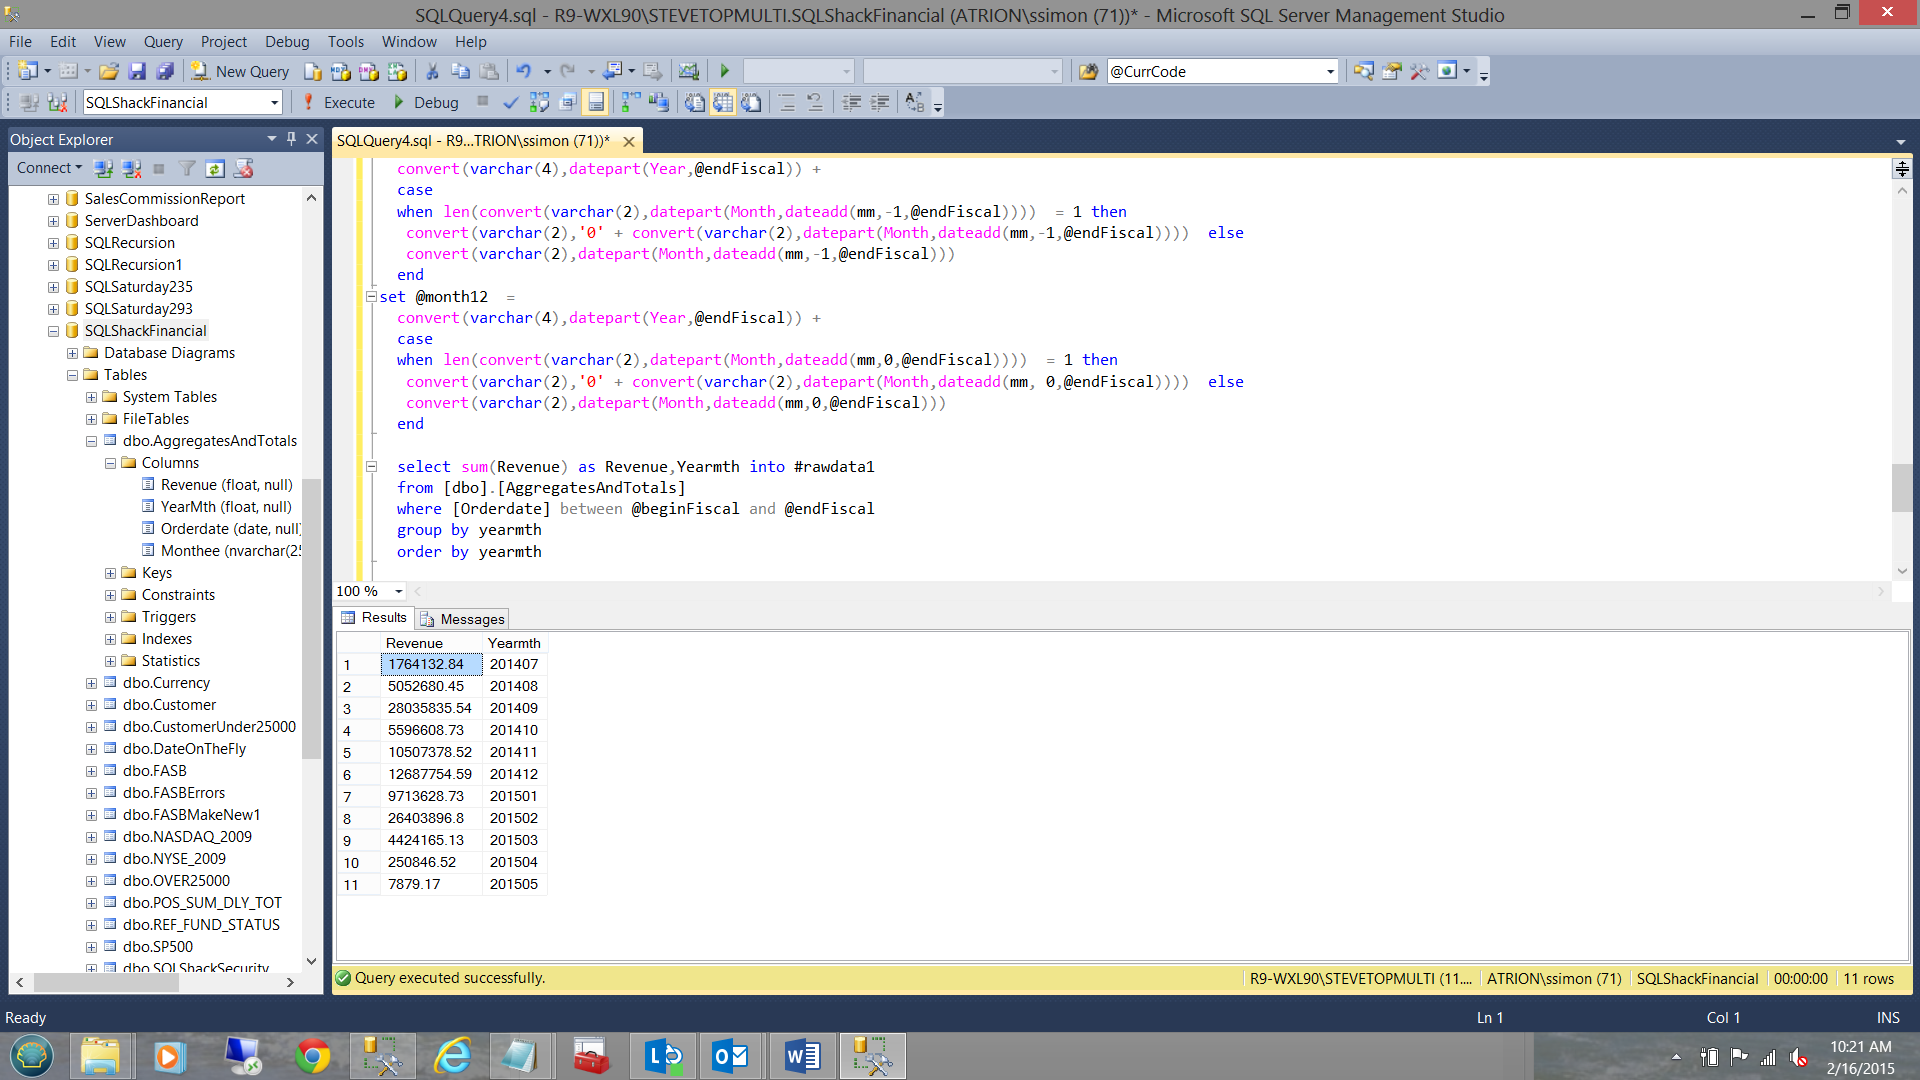
Looking at the screenshot above, we note the monthly sales PLUS some prepaid accounts for March through May (as seen in February 2015). The important point is that we have the monthly totals. The astute reader will note that I placed all the values into a temporary table called “#rawdata1”.
Coming from an Oracle world (cursor based), I am about to commit the most serious of SQL Server CRIMES. I am going to utilize a cursor upon the data within the temporary table (in order NOT to lock the proper database table). The reason being to calculate our running total.
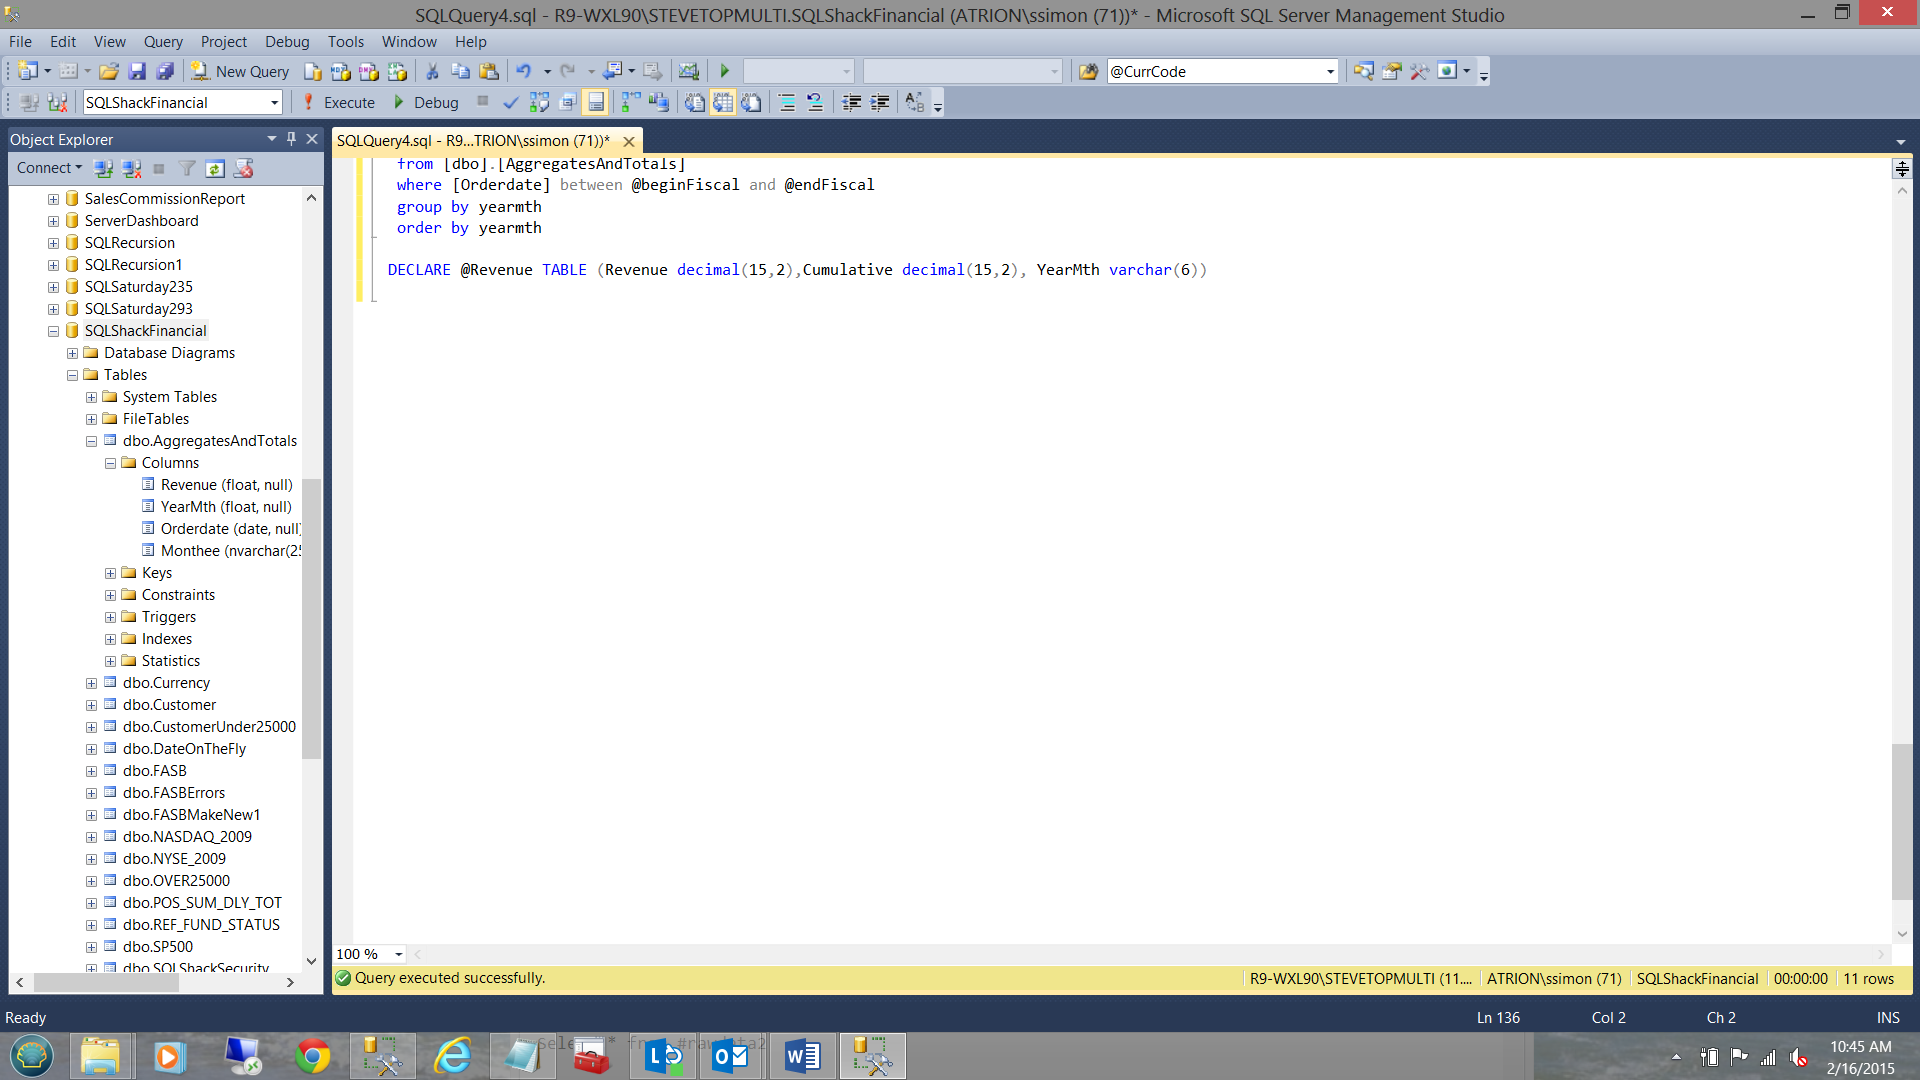
In the screen dump above, we declare a table variable called @Revenue. This table variable contains three fields “Revenue1”, “Cumulative” and “YearMth” (see above).
Declaring our cursor
We are now in a position to create our cursor (see below).
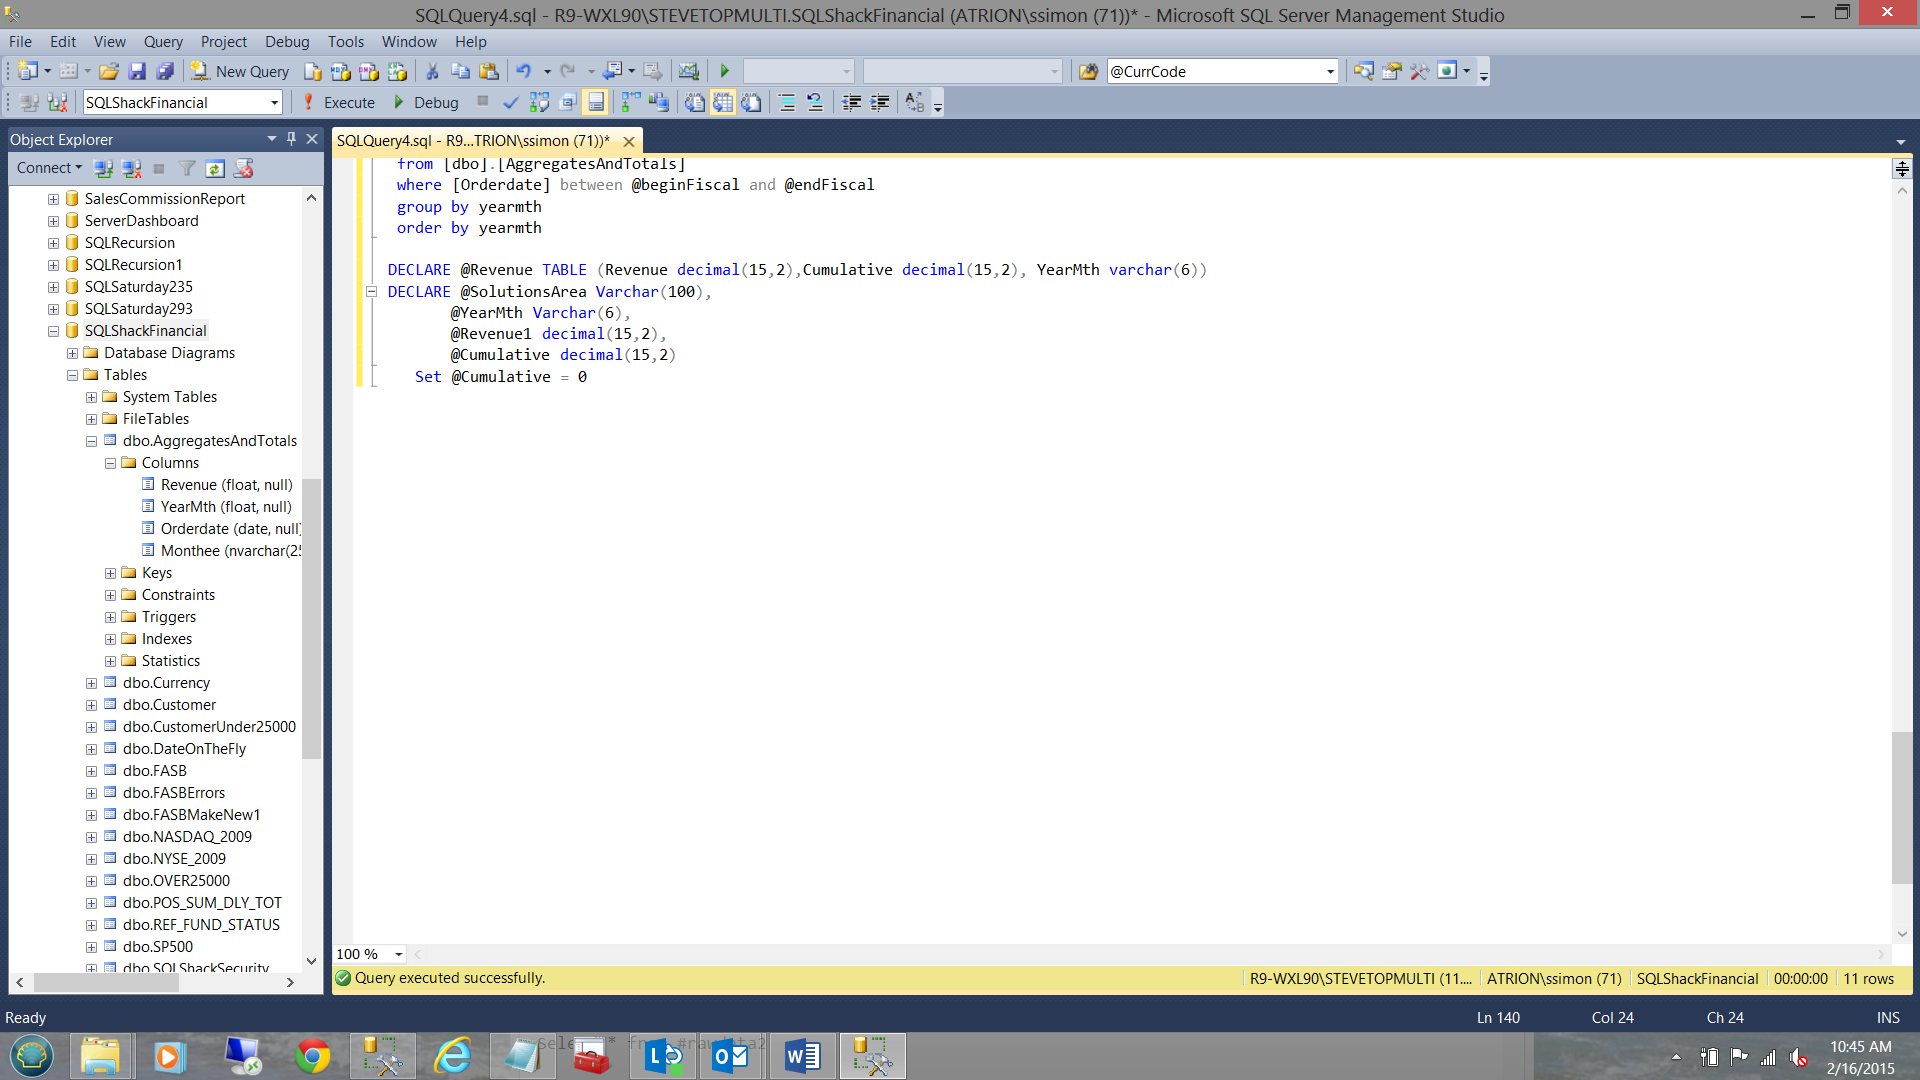
We first declare three variables: @YearMth which will contain the “YearMth” value from the data. @Revenue which will contain the current month’s revenue figures. @Cumulative will be utilized to contain the running total of revenue for the current year (see above). We initialize @Cumulative = 0.
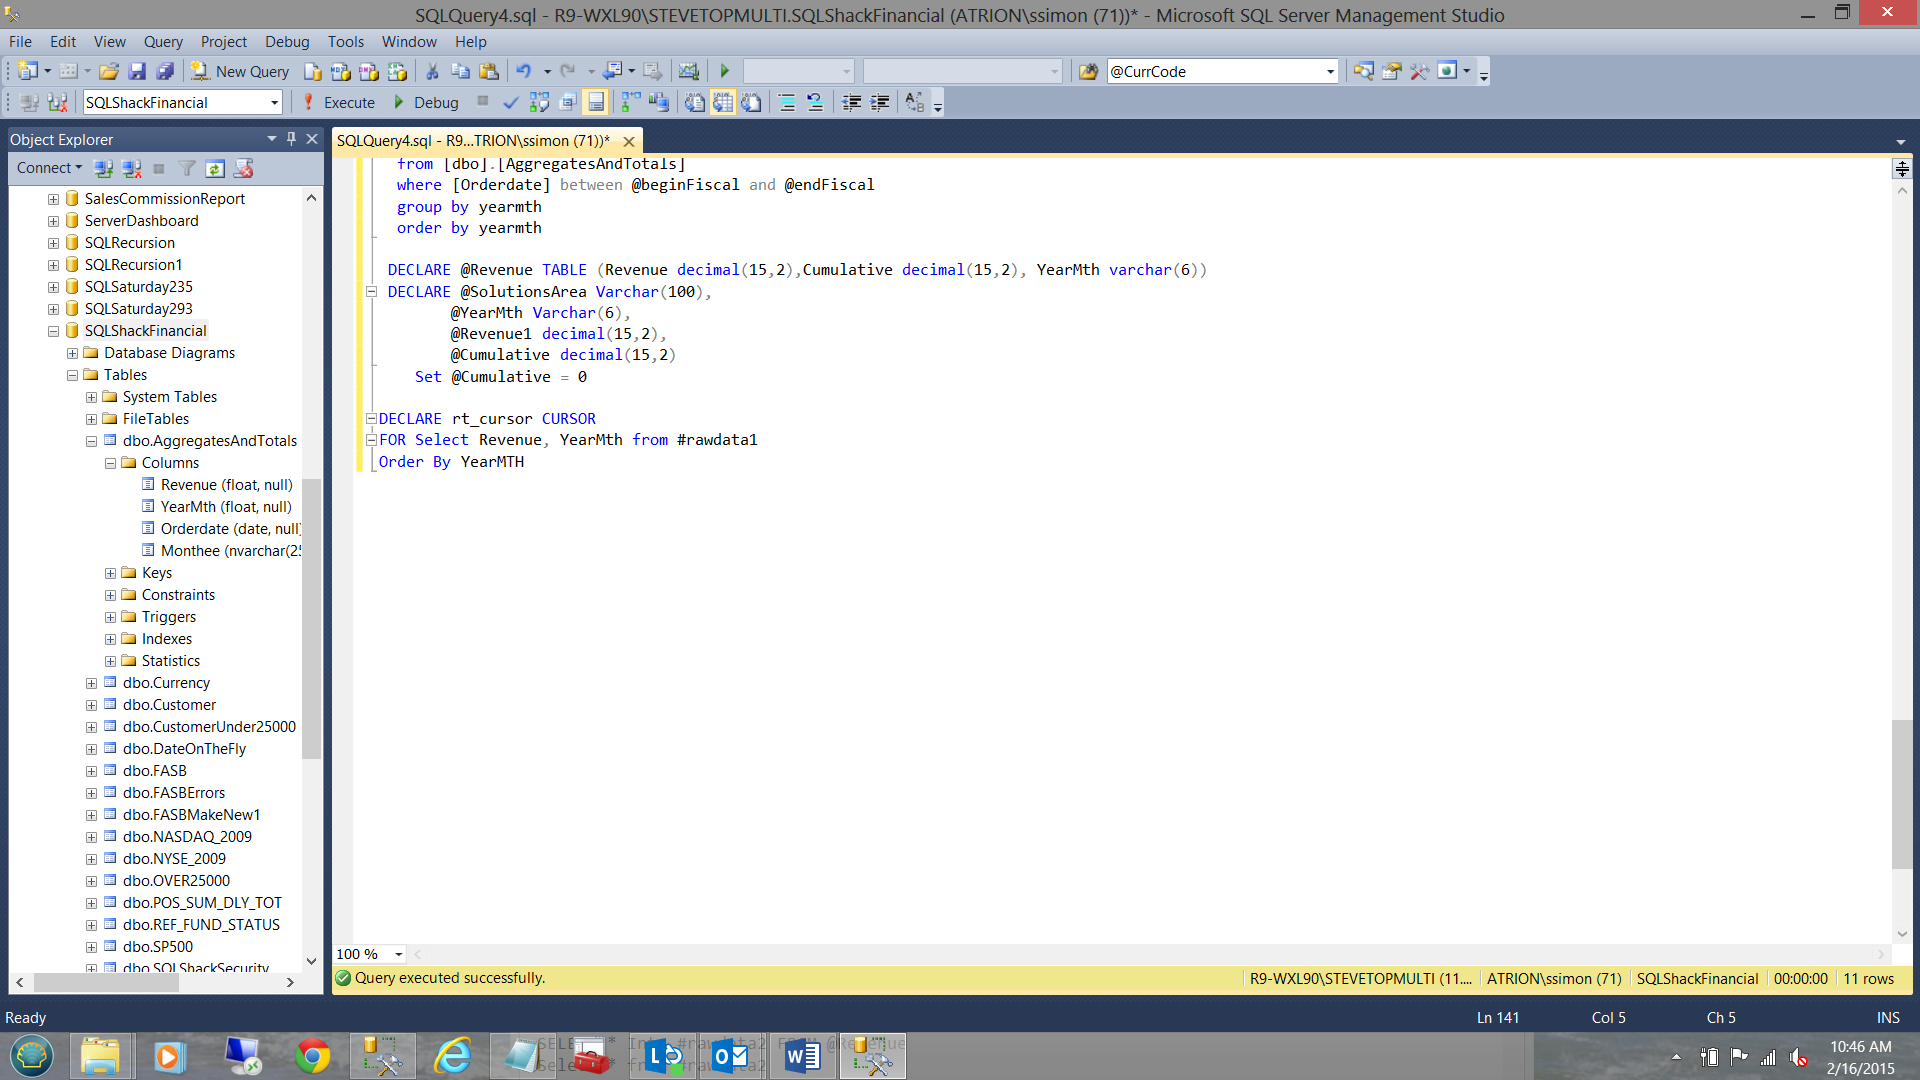
We are now in a position to declare our cursor (see above).
Creating our cursor body
|
1 2 3 4 5 6 7 8 9 10 11 12 13 14 15 16 |
OPEN rt_cursor FETCH NEXT FROM rt_cursor INTO @Revenue1,@YearMth WHILE @@FETCH_STATUS = 0 BEGIN begin Set @Cumulative = @Cumulative + @Revenue1 INSERT @Revenue VALUES (@Revenue1,@Cumulative,@YearMTH) end FETCH NEXT FROM rt_cursor INTO @Revenue1,@YearMth END CLOSE rt_cursor DEALLOCATE rt_cursor SELECT * Into #rawdata2 FROM @Revenue |
We note from the code snippet above, that with each iteration through the body of the cursor, @Cumulative is incremented by the current value of @Revenue1. The current YearMth, the current month’s revenue, and the cumulative revenue are all then inserted into our table variable.
After that last row is retrieved @@FETCH_STATUS will no longer return a “0”, thus on the next pass, we break out of the loop.
We then close the cursor and deallocate it and place all the data from the table variable into a temp table called #rawdata2. Why? Hint: Persistence, especially with any “Go” statement which may be executed somewhere “further down” the code.
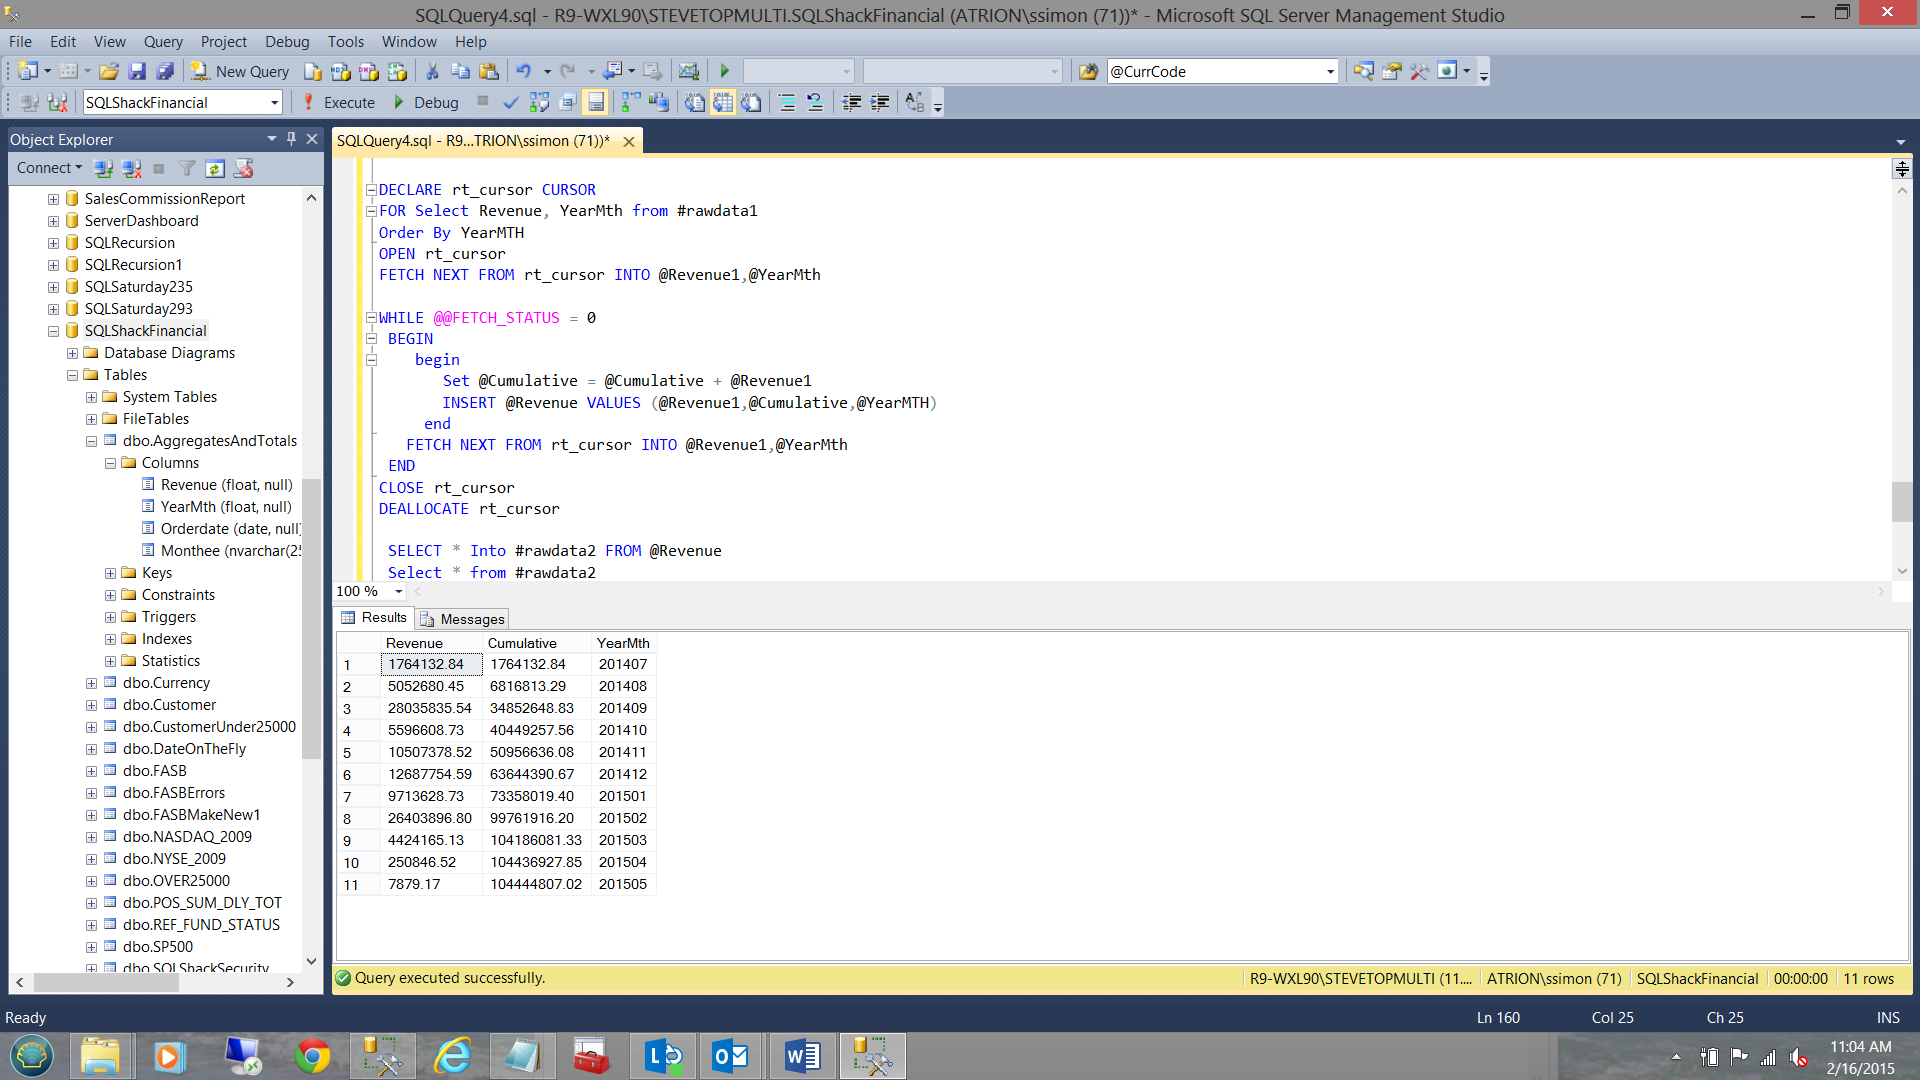
Running our query we obtain the desired results (see above).
Our current dilemma
The format in which the data has been rendered (see above), whilst conducive to a chart or graph, is not conducive to populating a Reporting Services matrix. This said we must massage the data utilizing a pivot construct (see below).
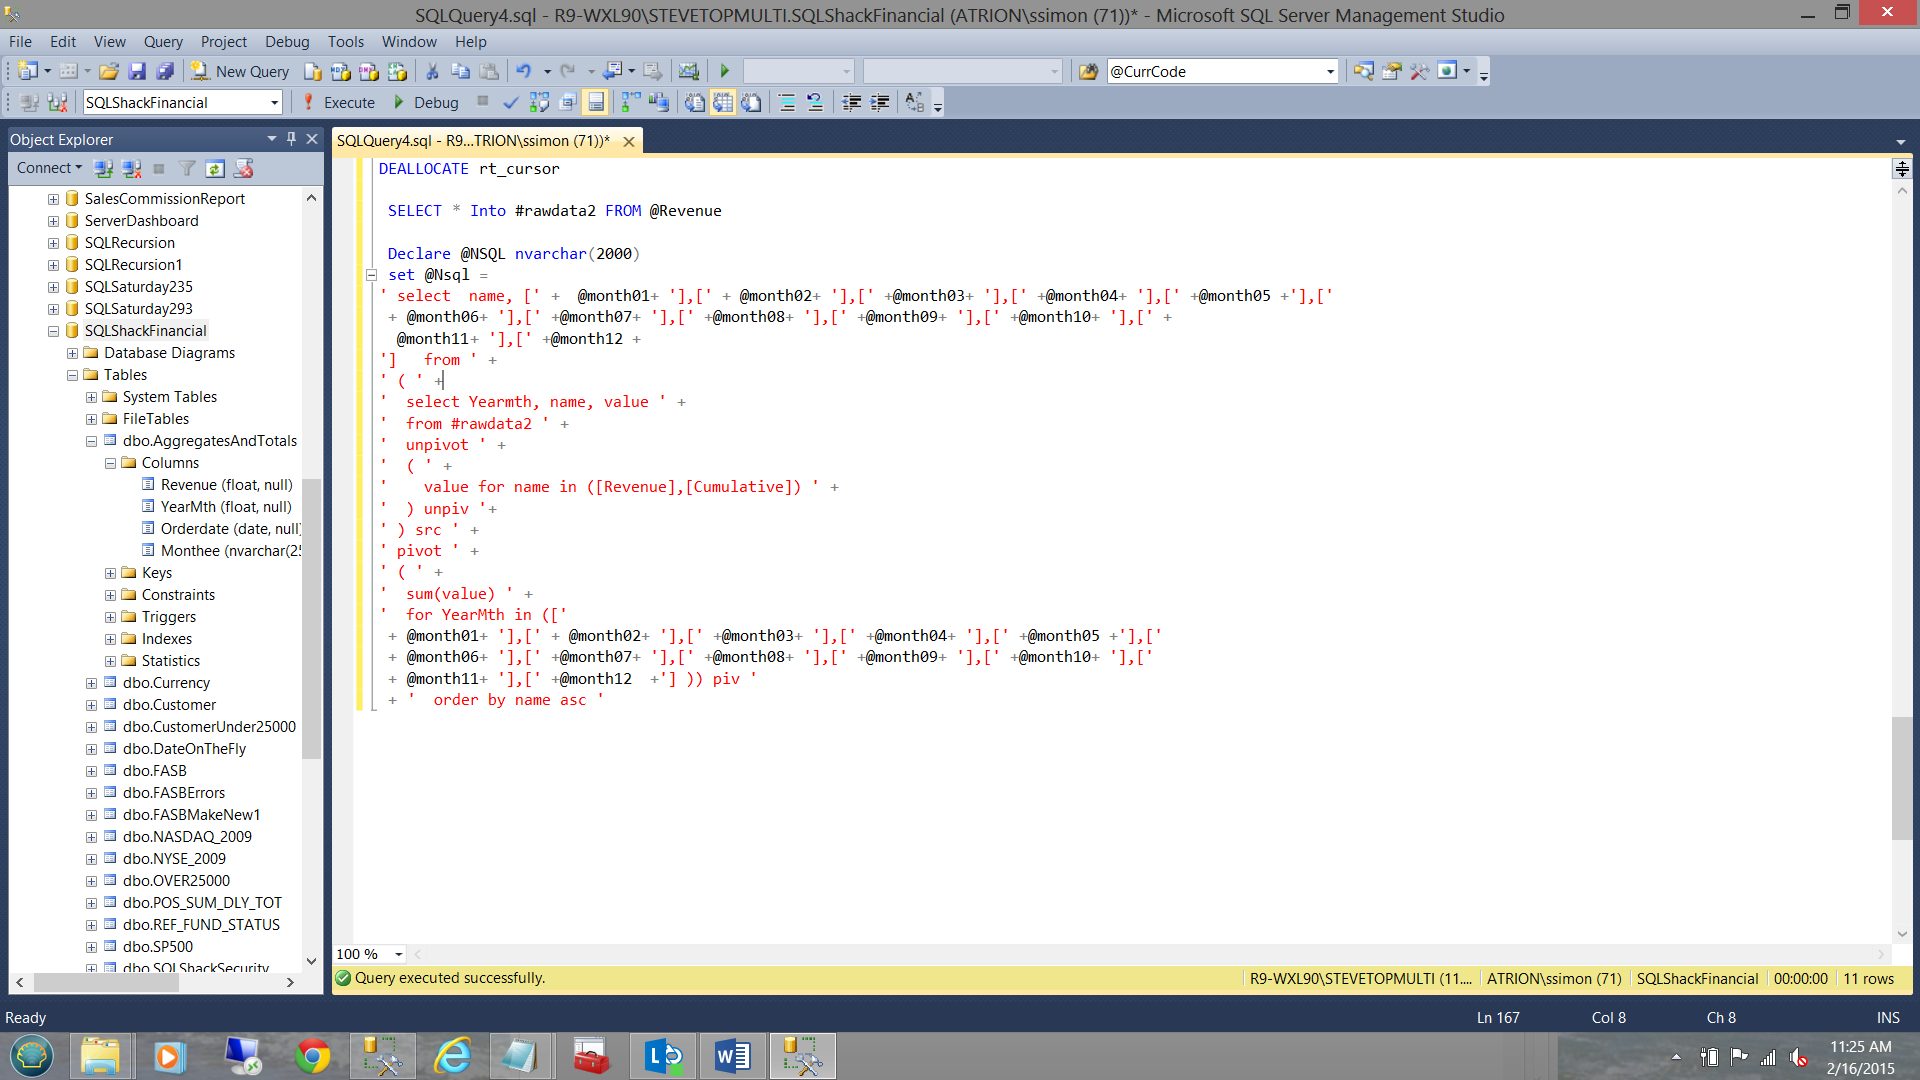
We begin by declaring an additional variable @NSQL nvarchar(2000). We shall want to execute a T-SQL statement within our code utilizing “exec sp_executesql” and for this to work, the statement must be in NVARCHAR format.
This said the reader will note that we construct a PIVOT SQL statement and assign this to the variable “NSQL”. Within the statement, we utilize the “YearMth” variables that we created above, in addition to utilizing the “YearMth” values from the table.
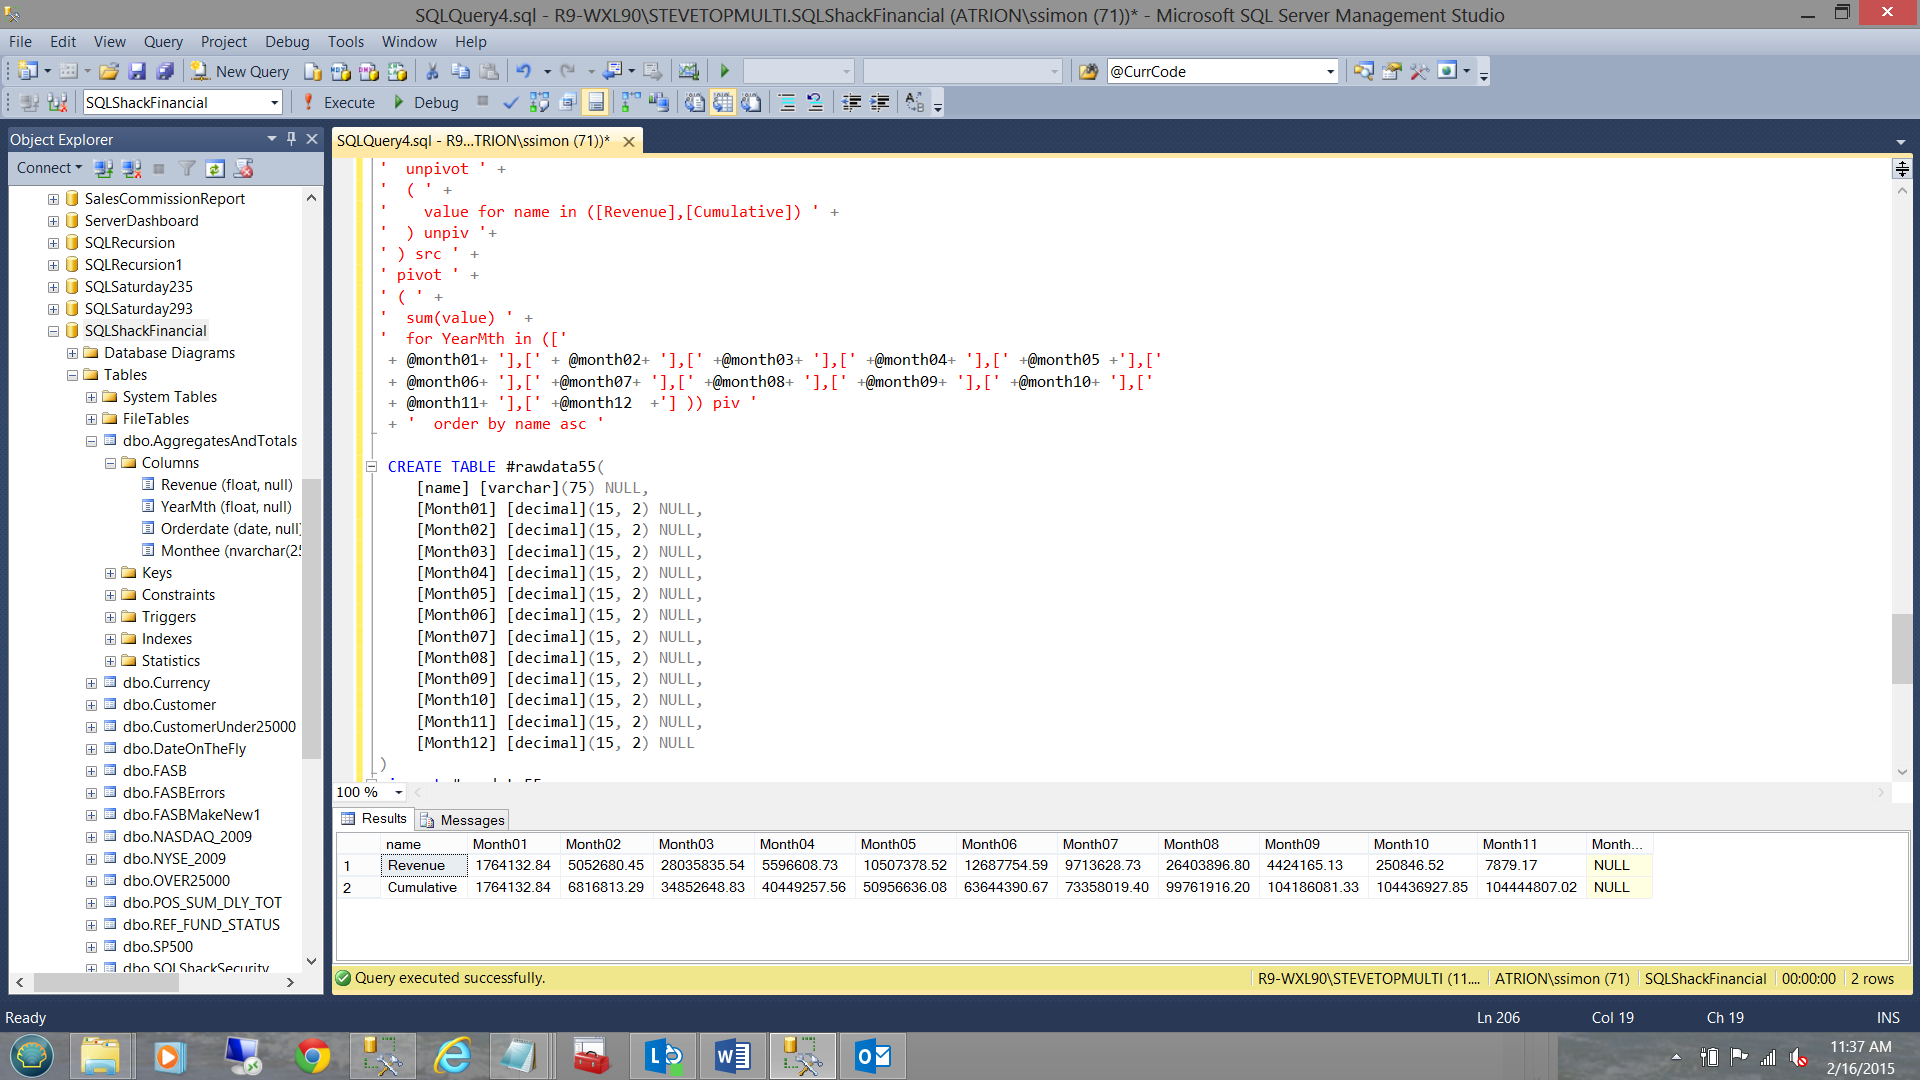
This done, we create an additional temporary table which we call #rawdata55.
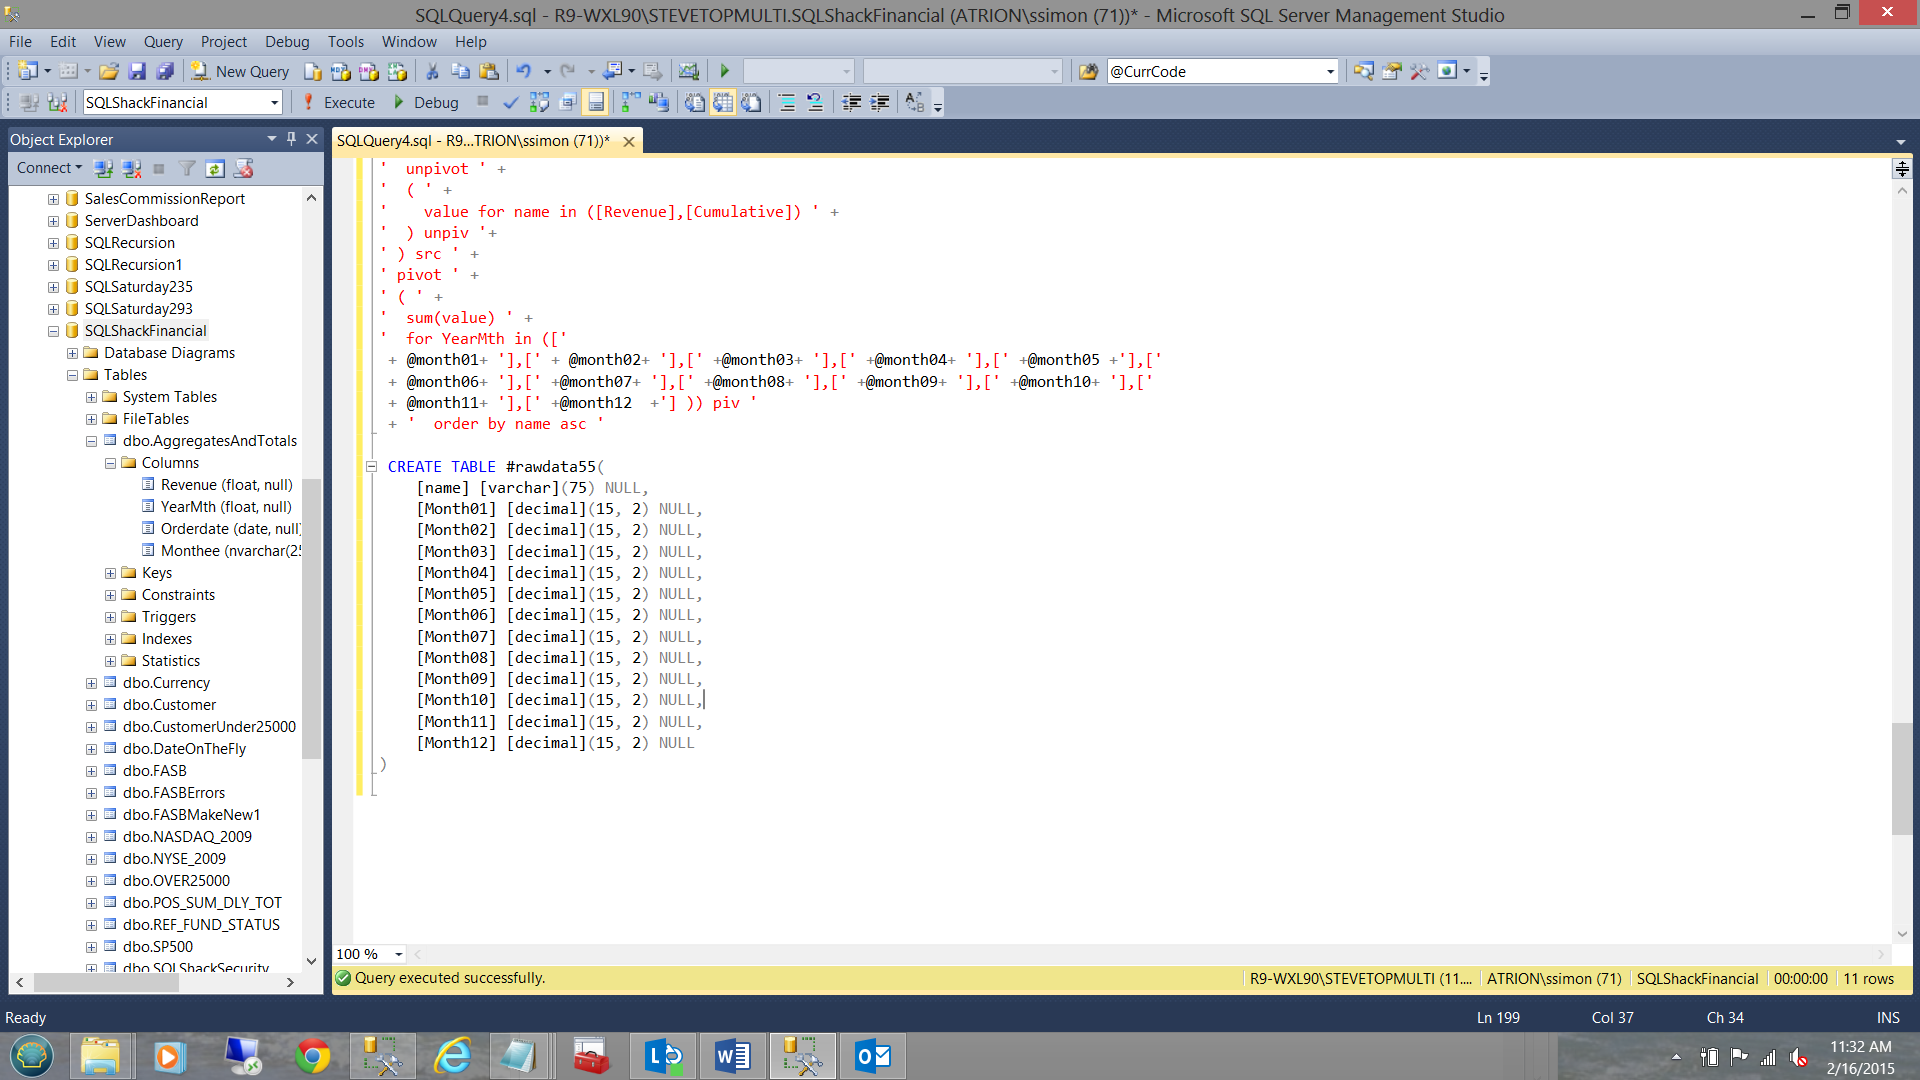
Temporary table #rawdata55 will hold the pivoted data which will eventually feed our report matrix.
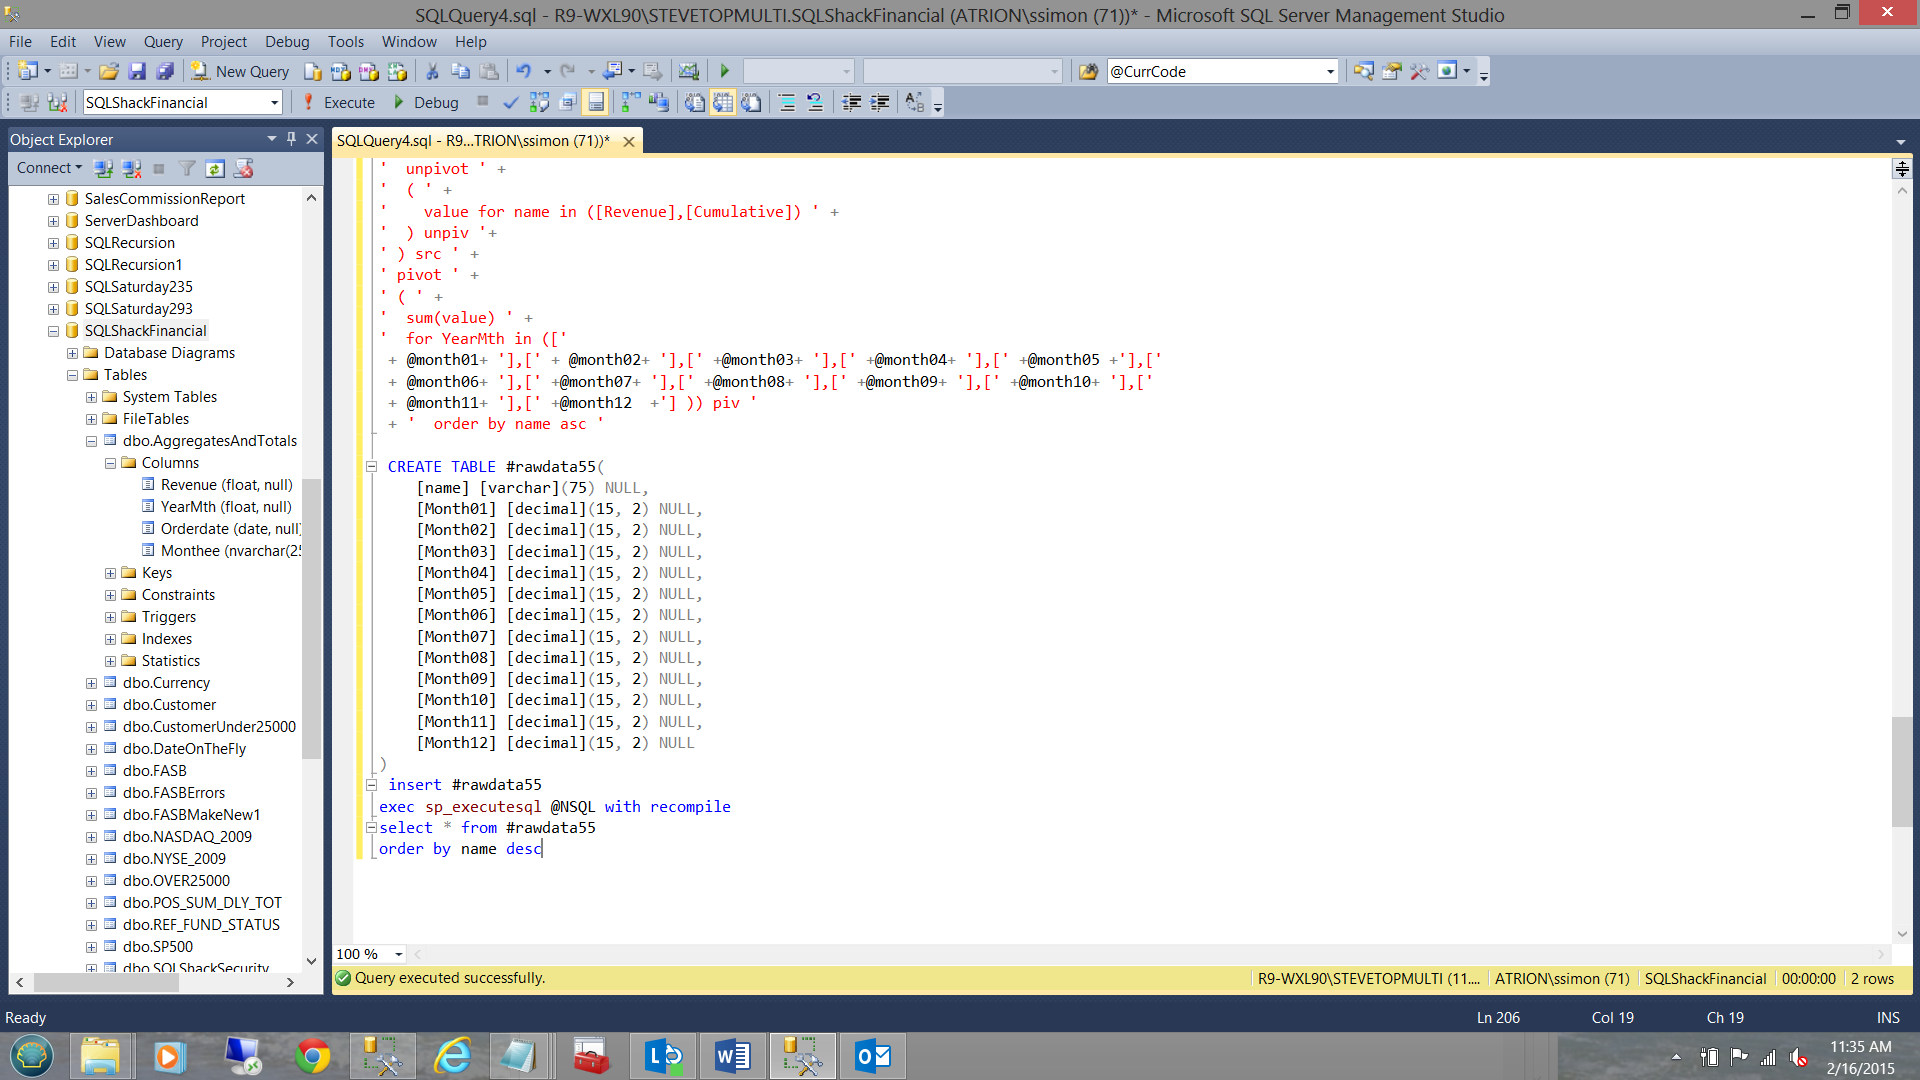
With this achieved, we are in a position to execute the SQL statement (contained within our “NSQL” variable) and load the data into our temporary table “#rawdata55”.
Executing the query (as is) renders the following data (see below).
Utilizing our query for reporting purposes
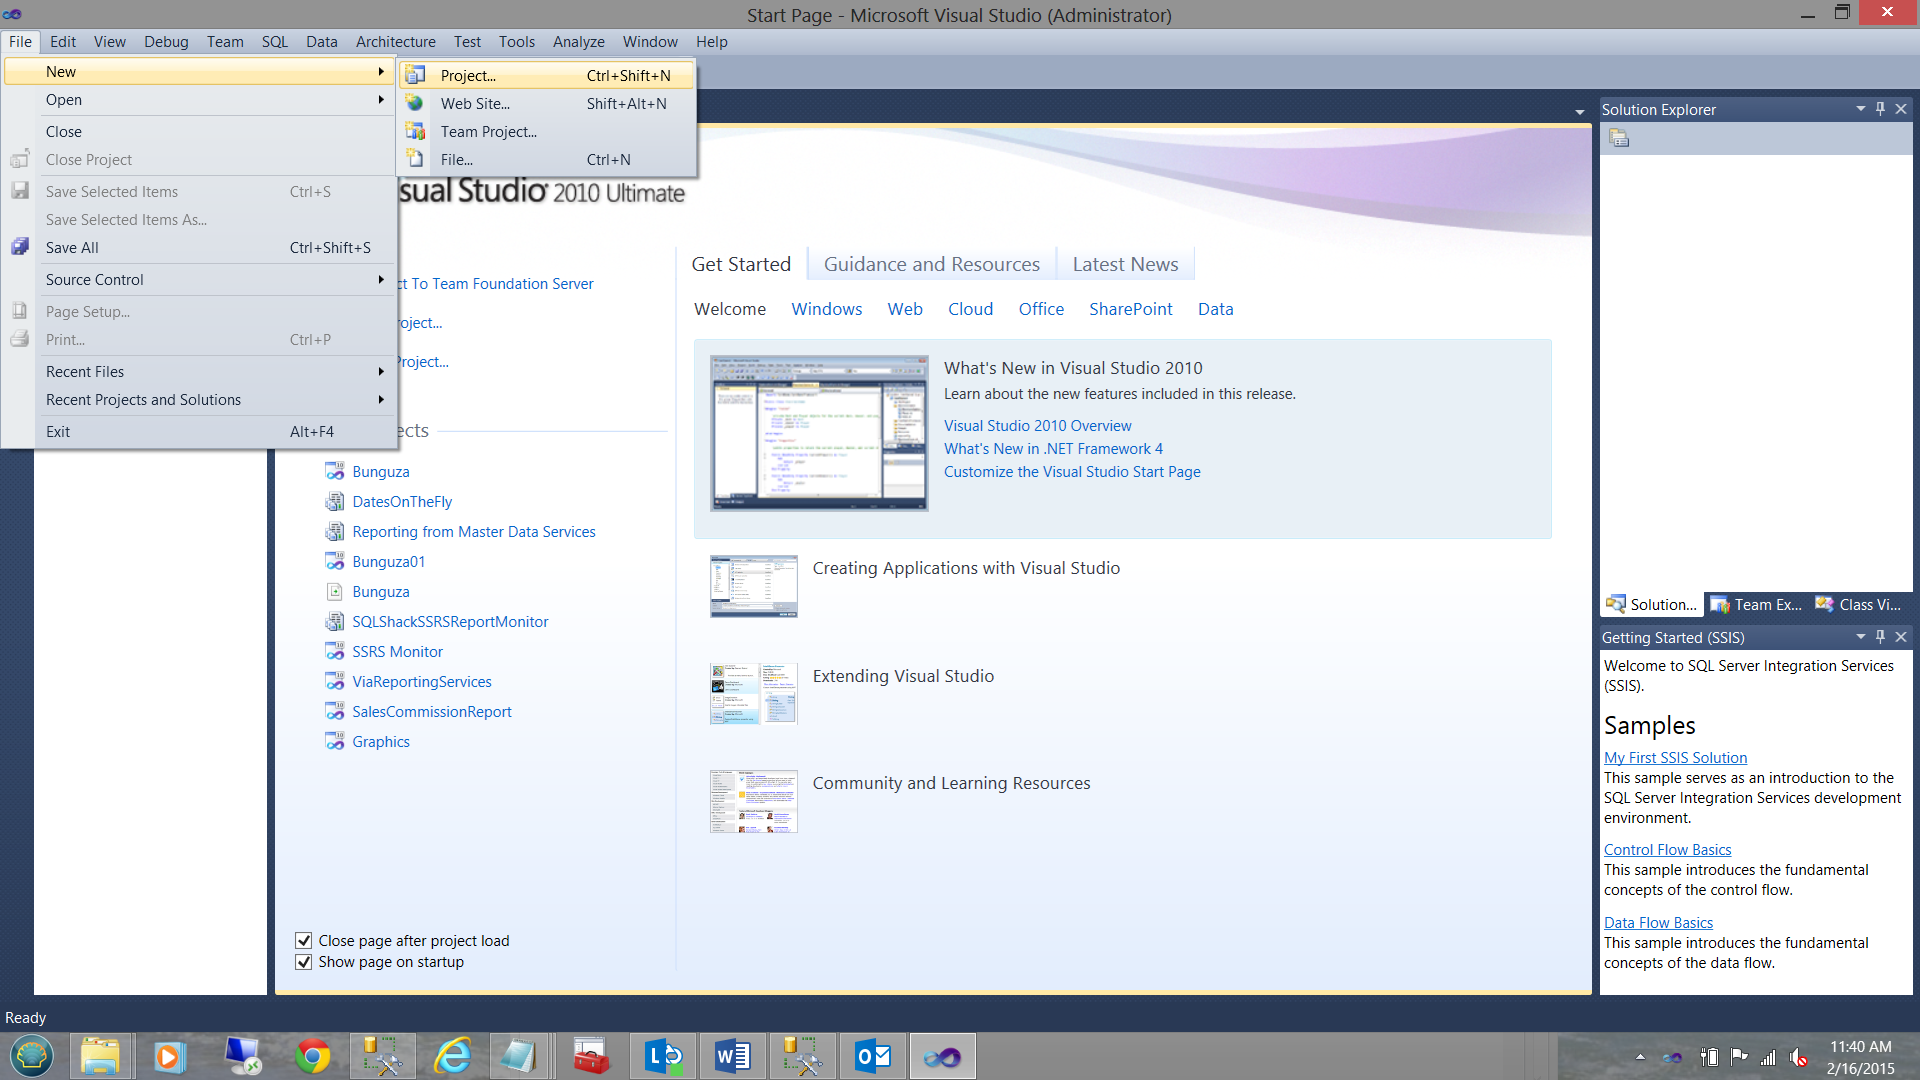
Bringing up SQL Server Data Tools, we are going to create a new Reporting Services project to display our data in a matrix format.
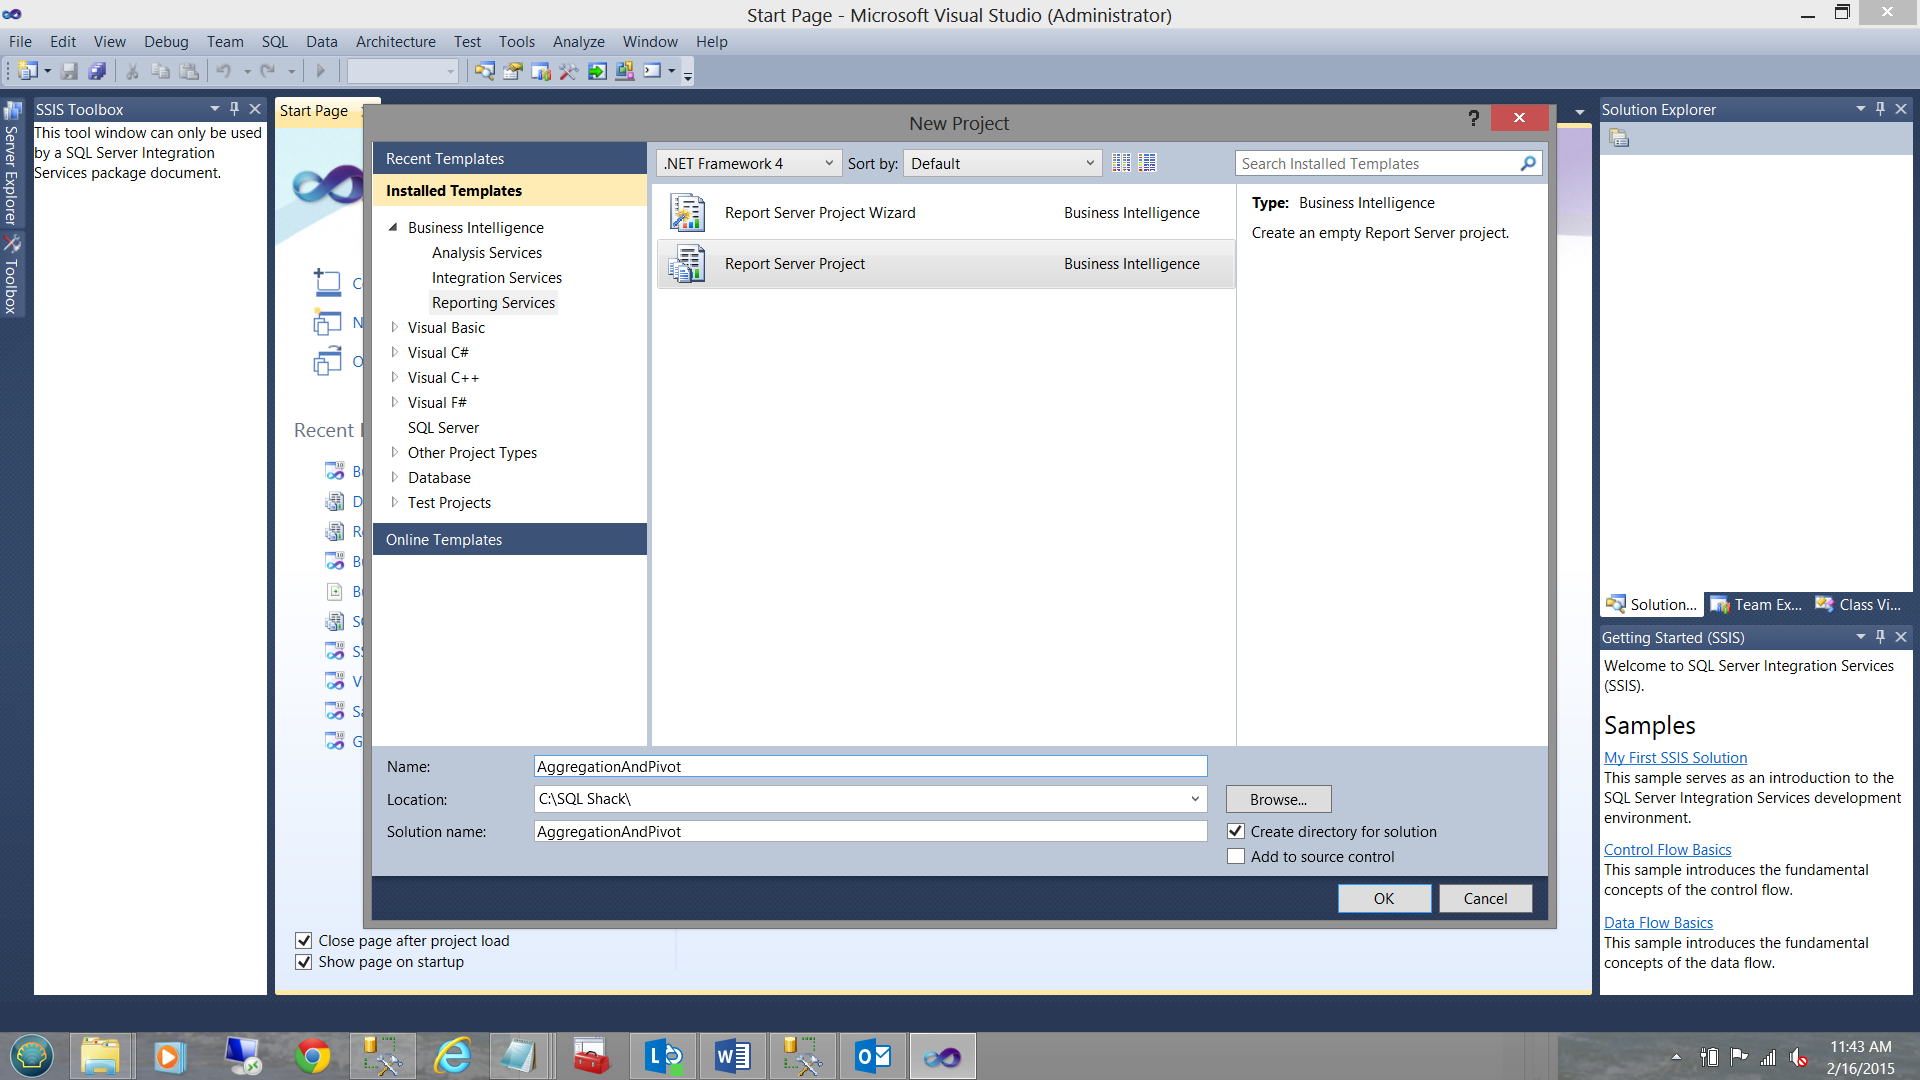
We give our “Report Server Project” the name “AggregationAndPivot” (see above). We click OK to continue.
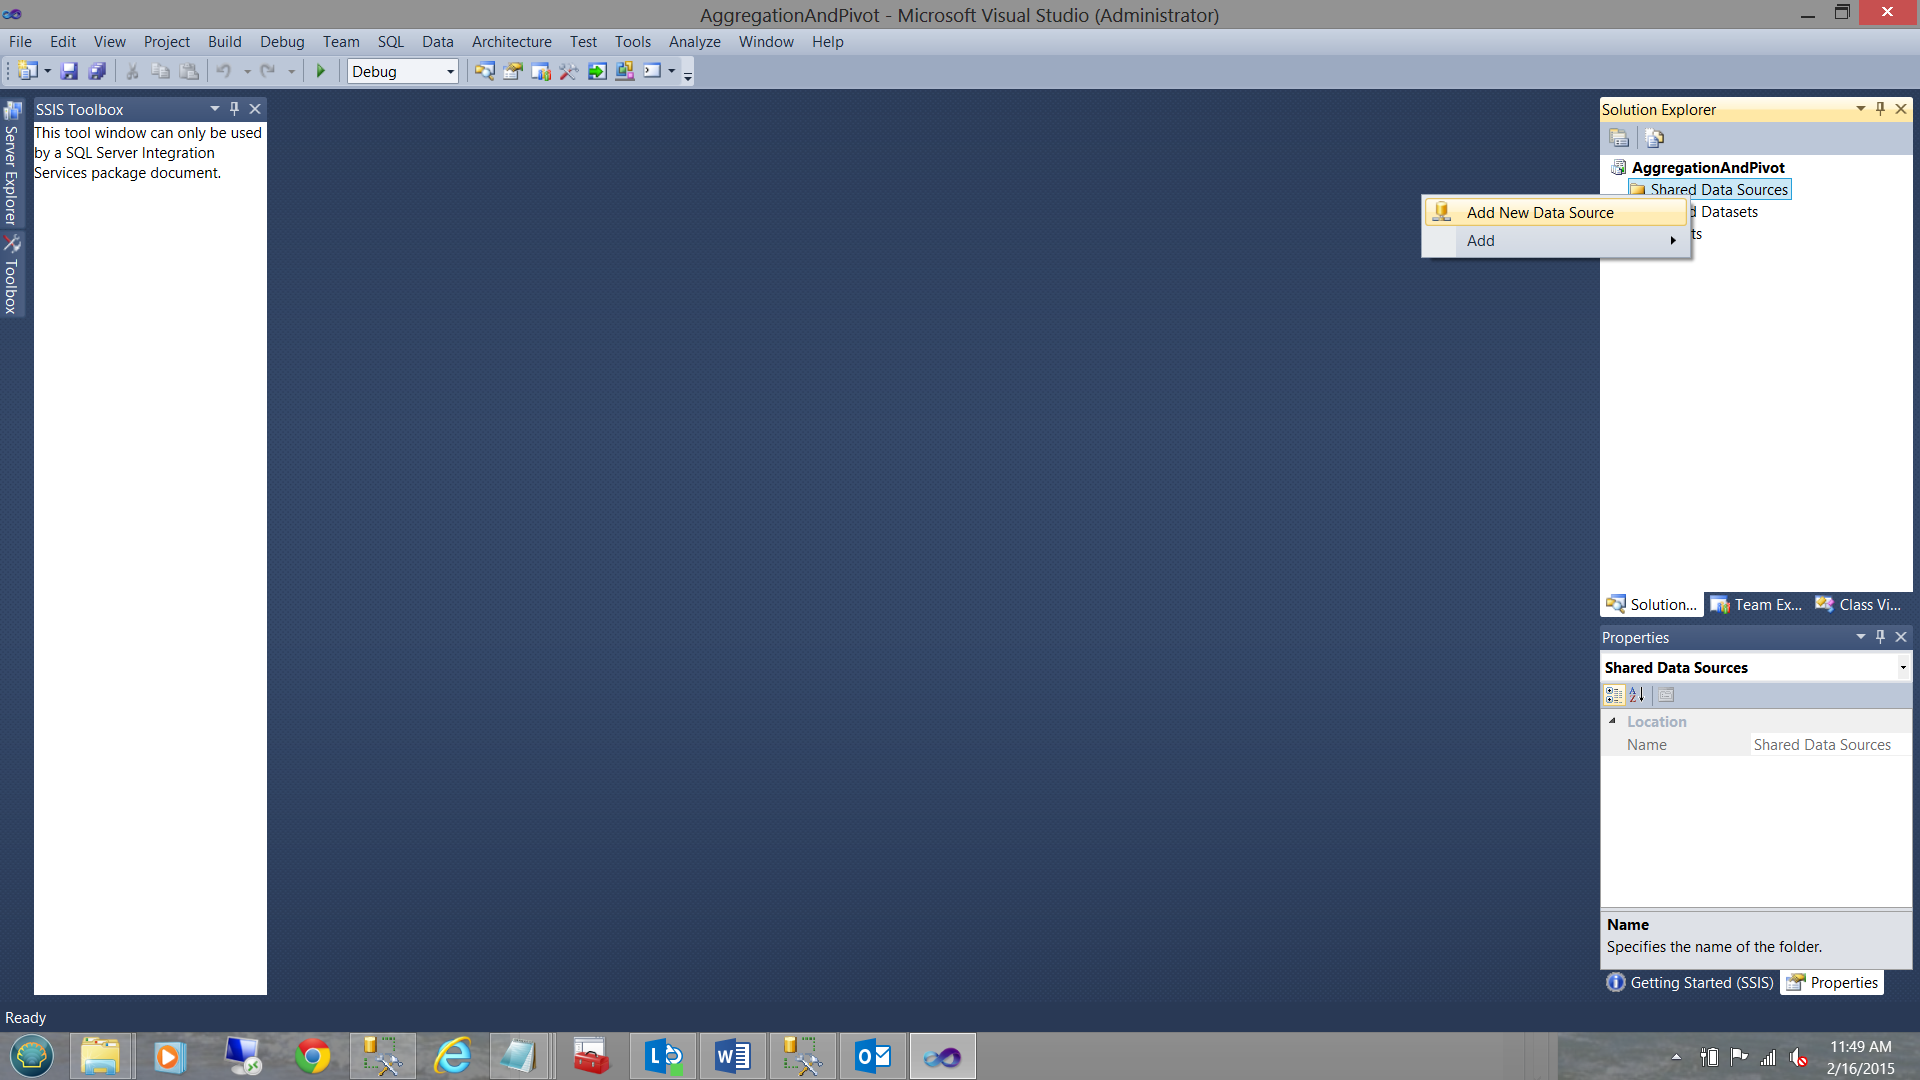
Our first task is to create a “Shared Data Source”. Right-clicking on the “Shared Data Sources” folder, we select “Add” and then “Add New Data Source” from the context menu.
The “Shared Data Source Properties” dialog box is brought into view.
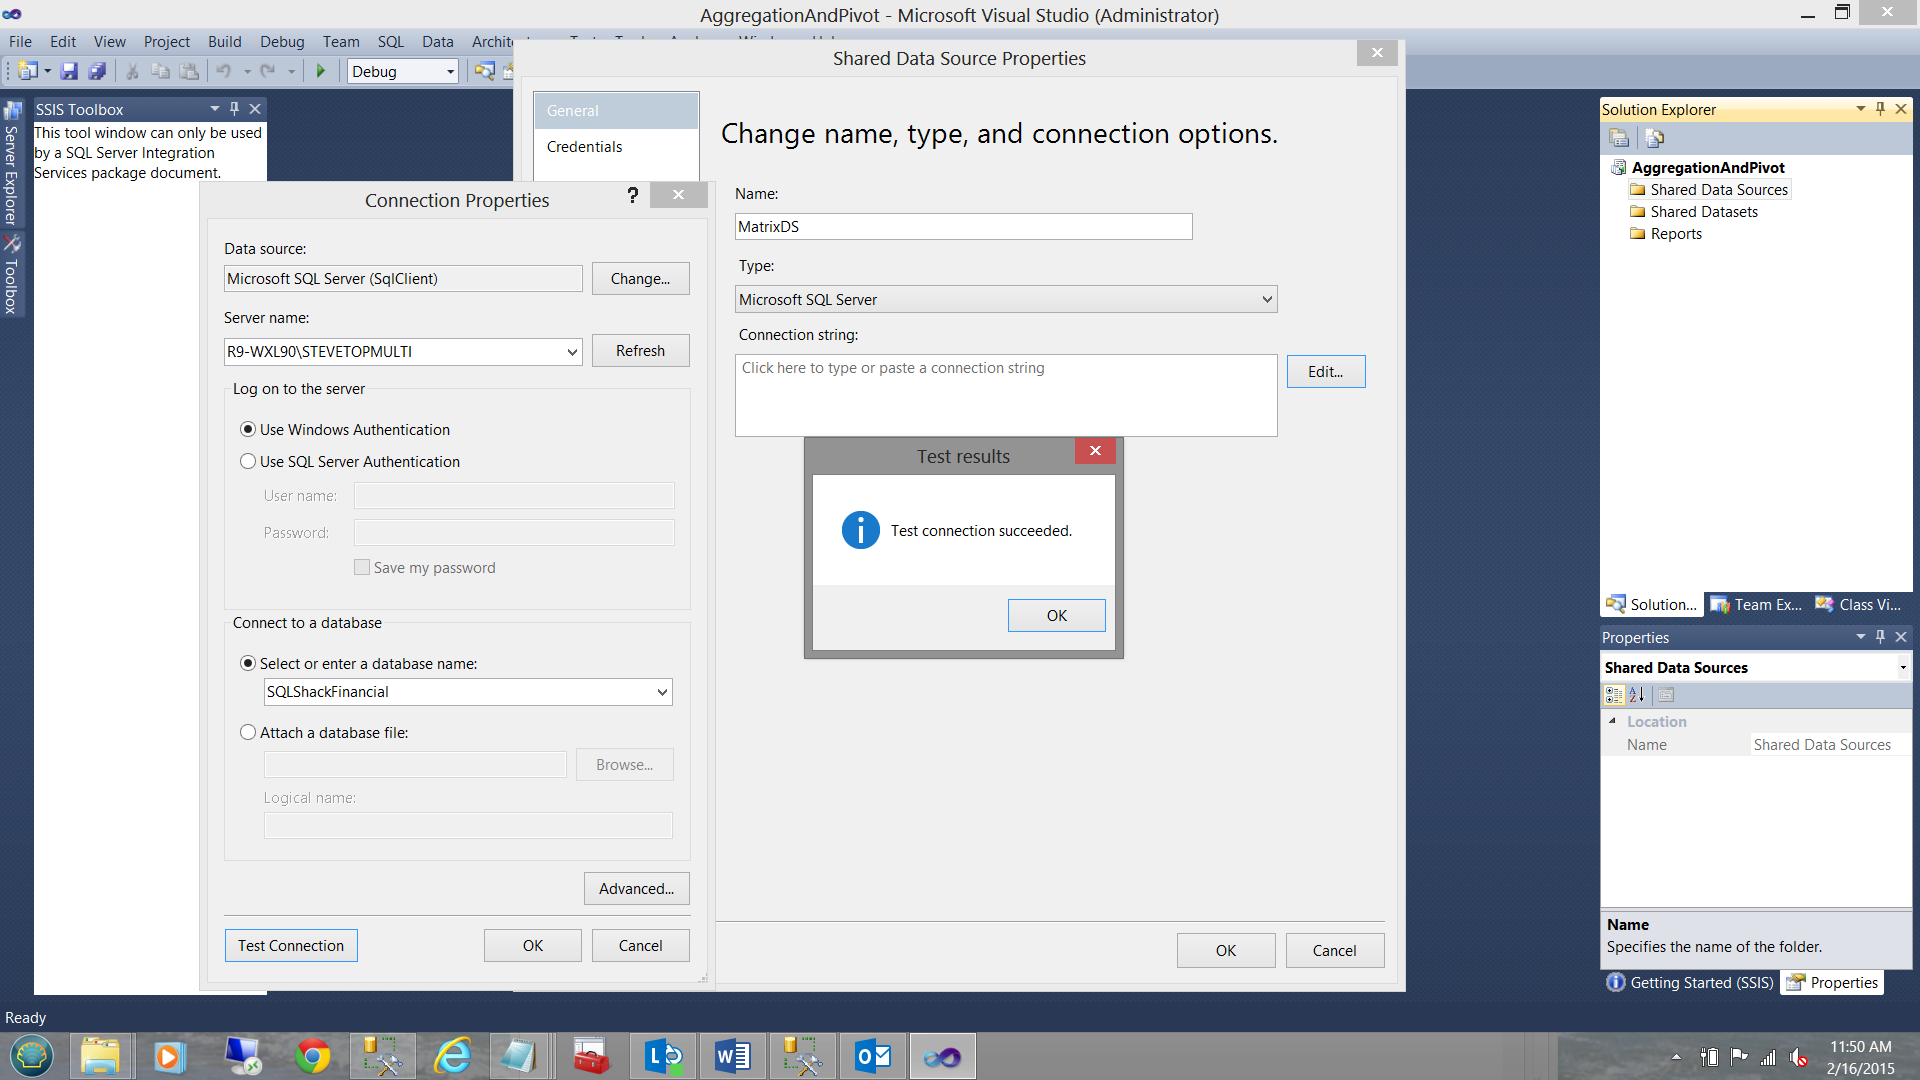
We give our “Shared Data Source” a name and point it to our “SQLShackFinancial” database. We then test the connection and find that all is in order (see above). We click “OK” to create our shared dataset.
As always, should you not be certain on how to create data sources, datasets and reports, please do have a look at my SQL Shack article entitled:
“Now you see it, now you don’t”.
/now-see-now-dont/
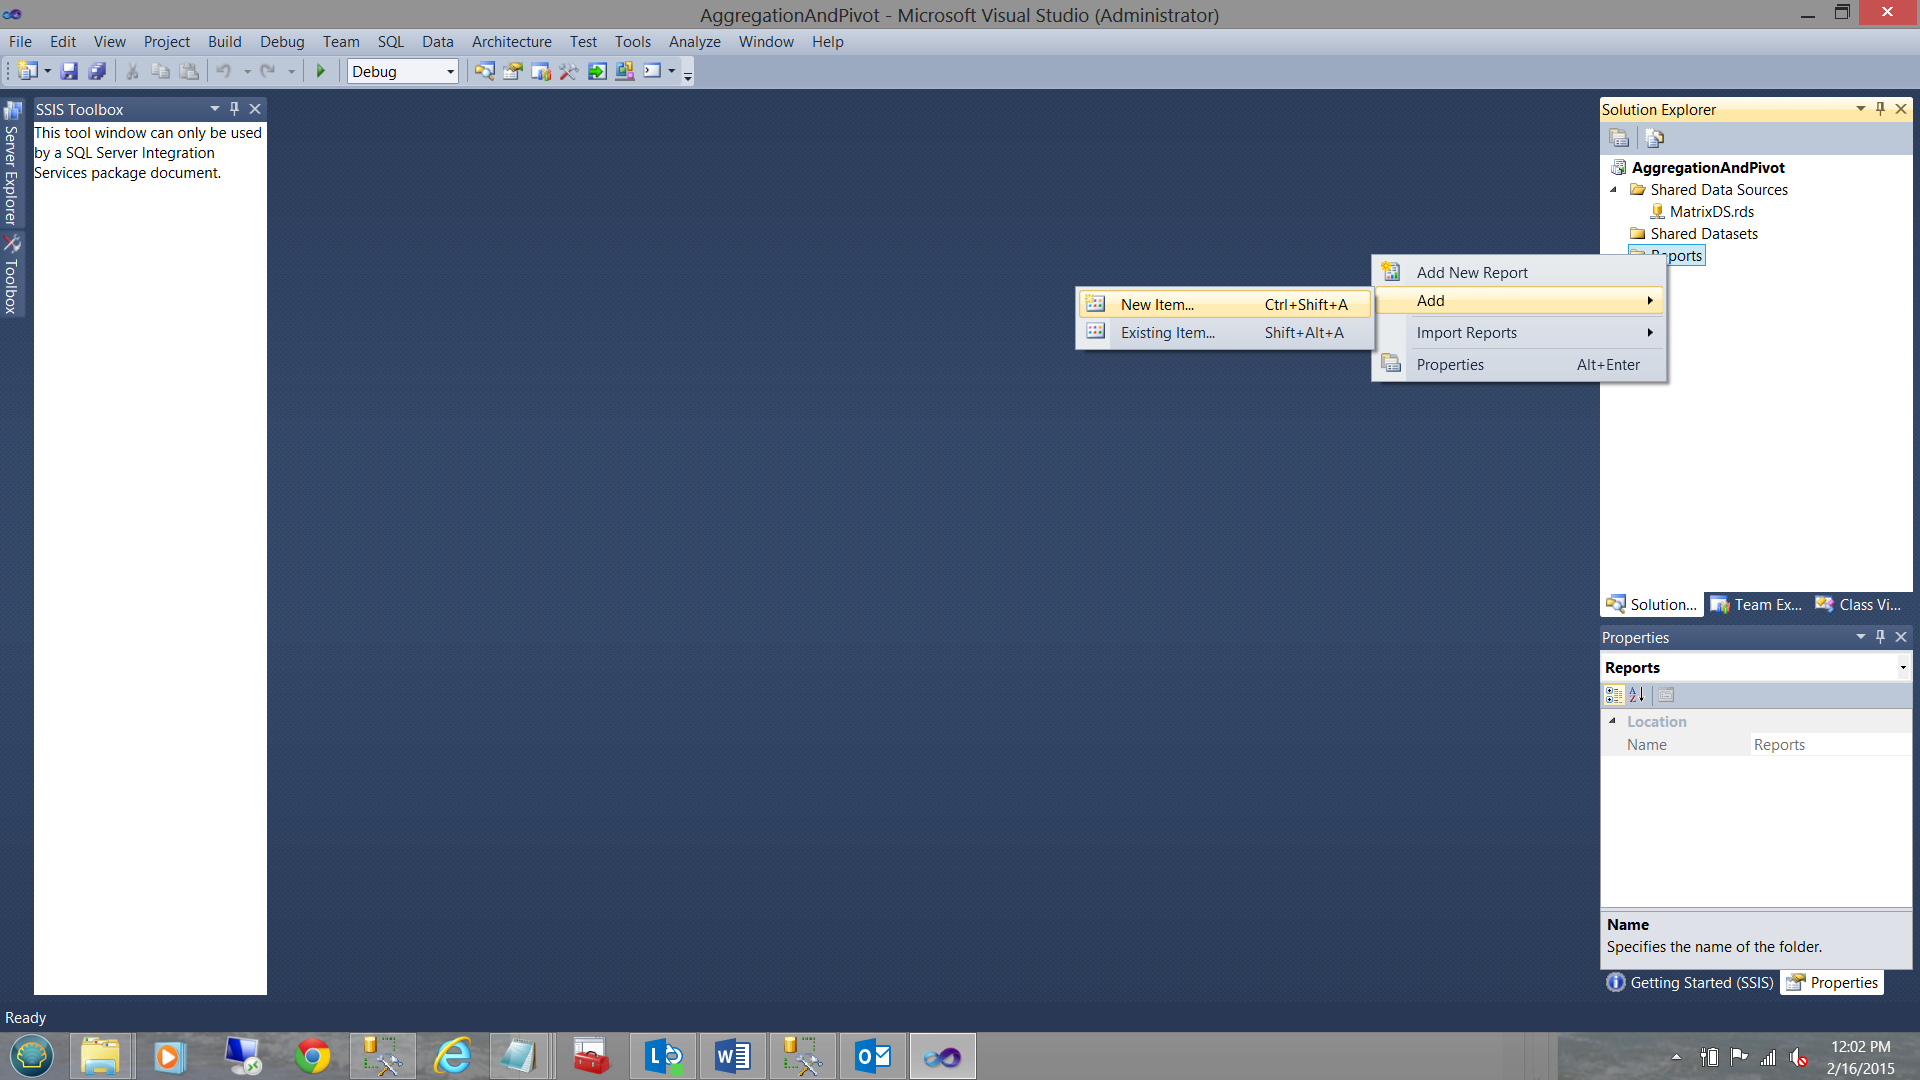
We are now in a position to create our one and only report for this “get together”. By right-clicking on the “Reports” folder. We select “Add” and “New Item” from the context menu.
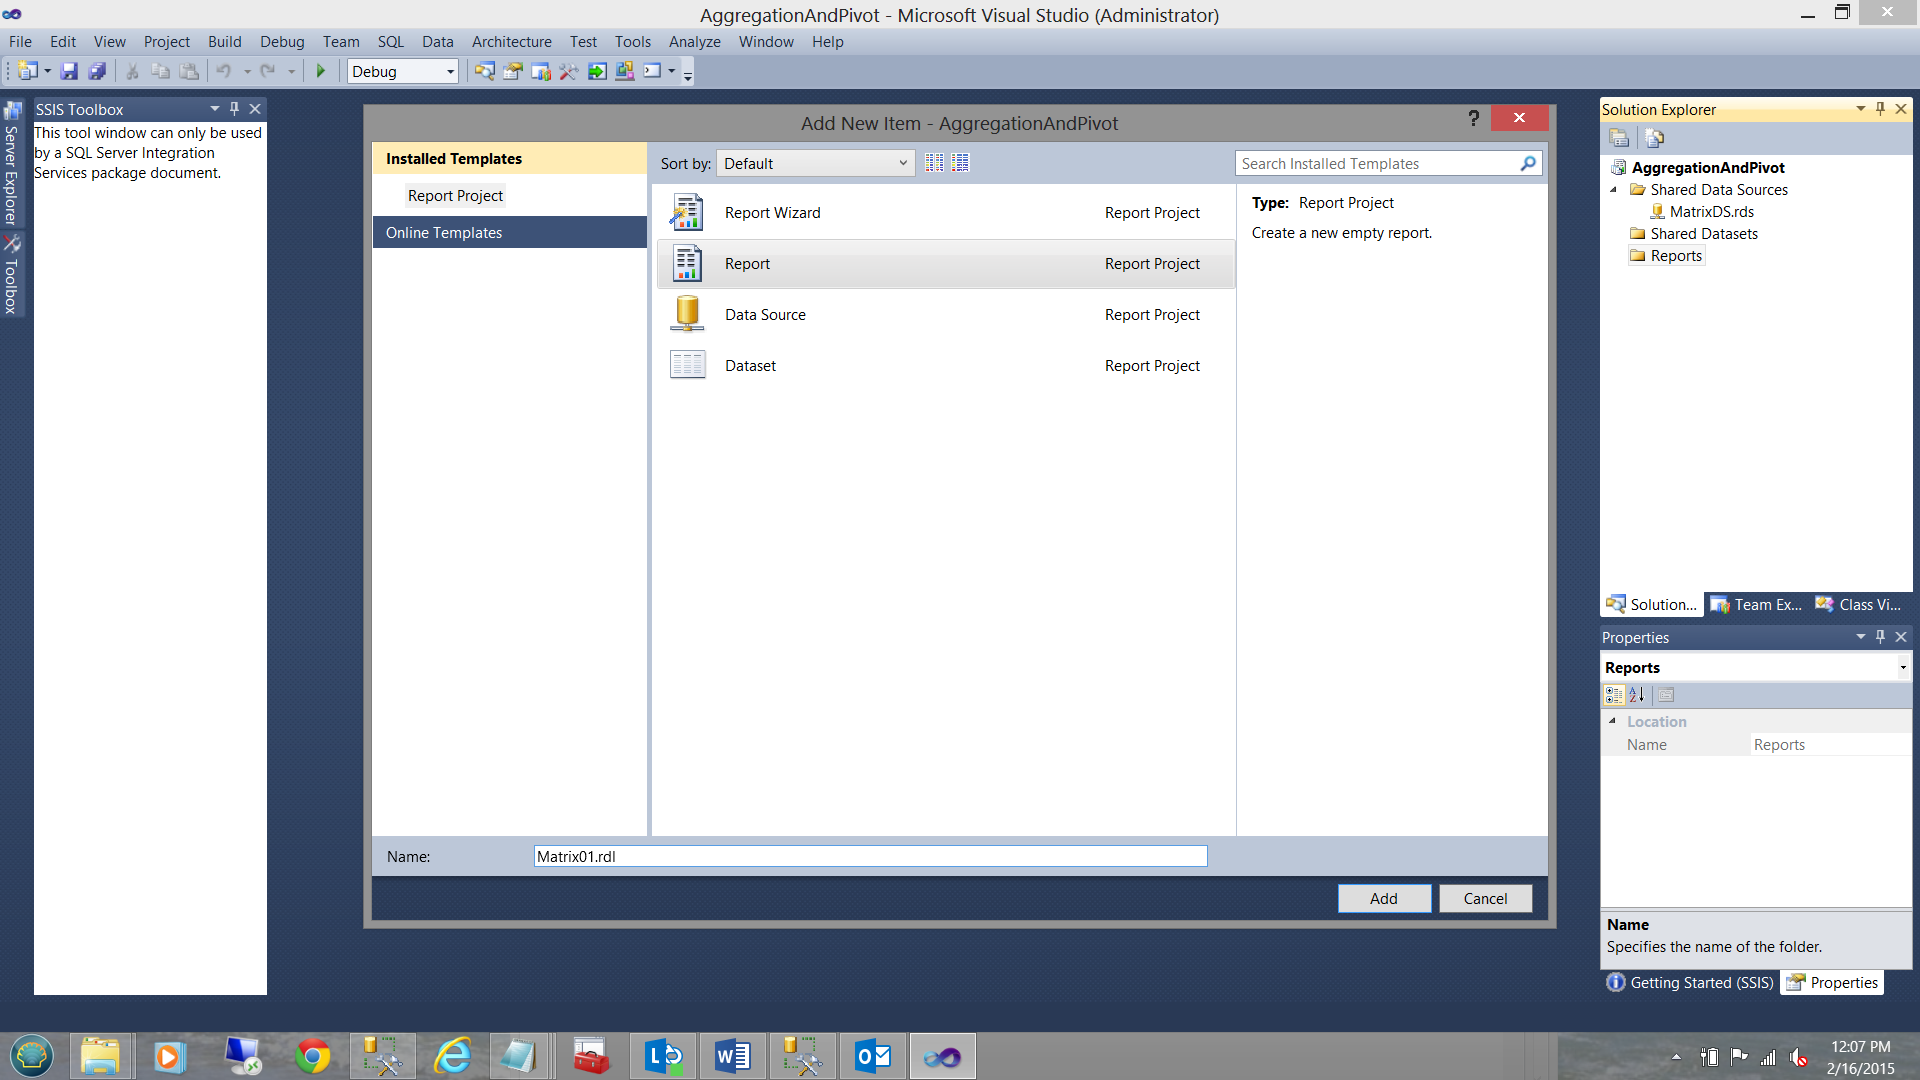
We create a new report which we call “Matrix01”. We then click “Add”.
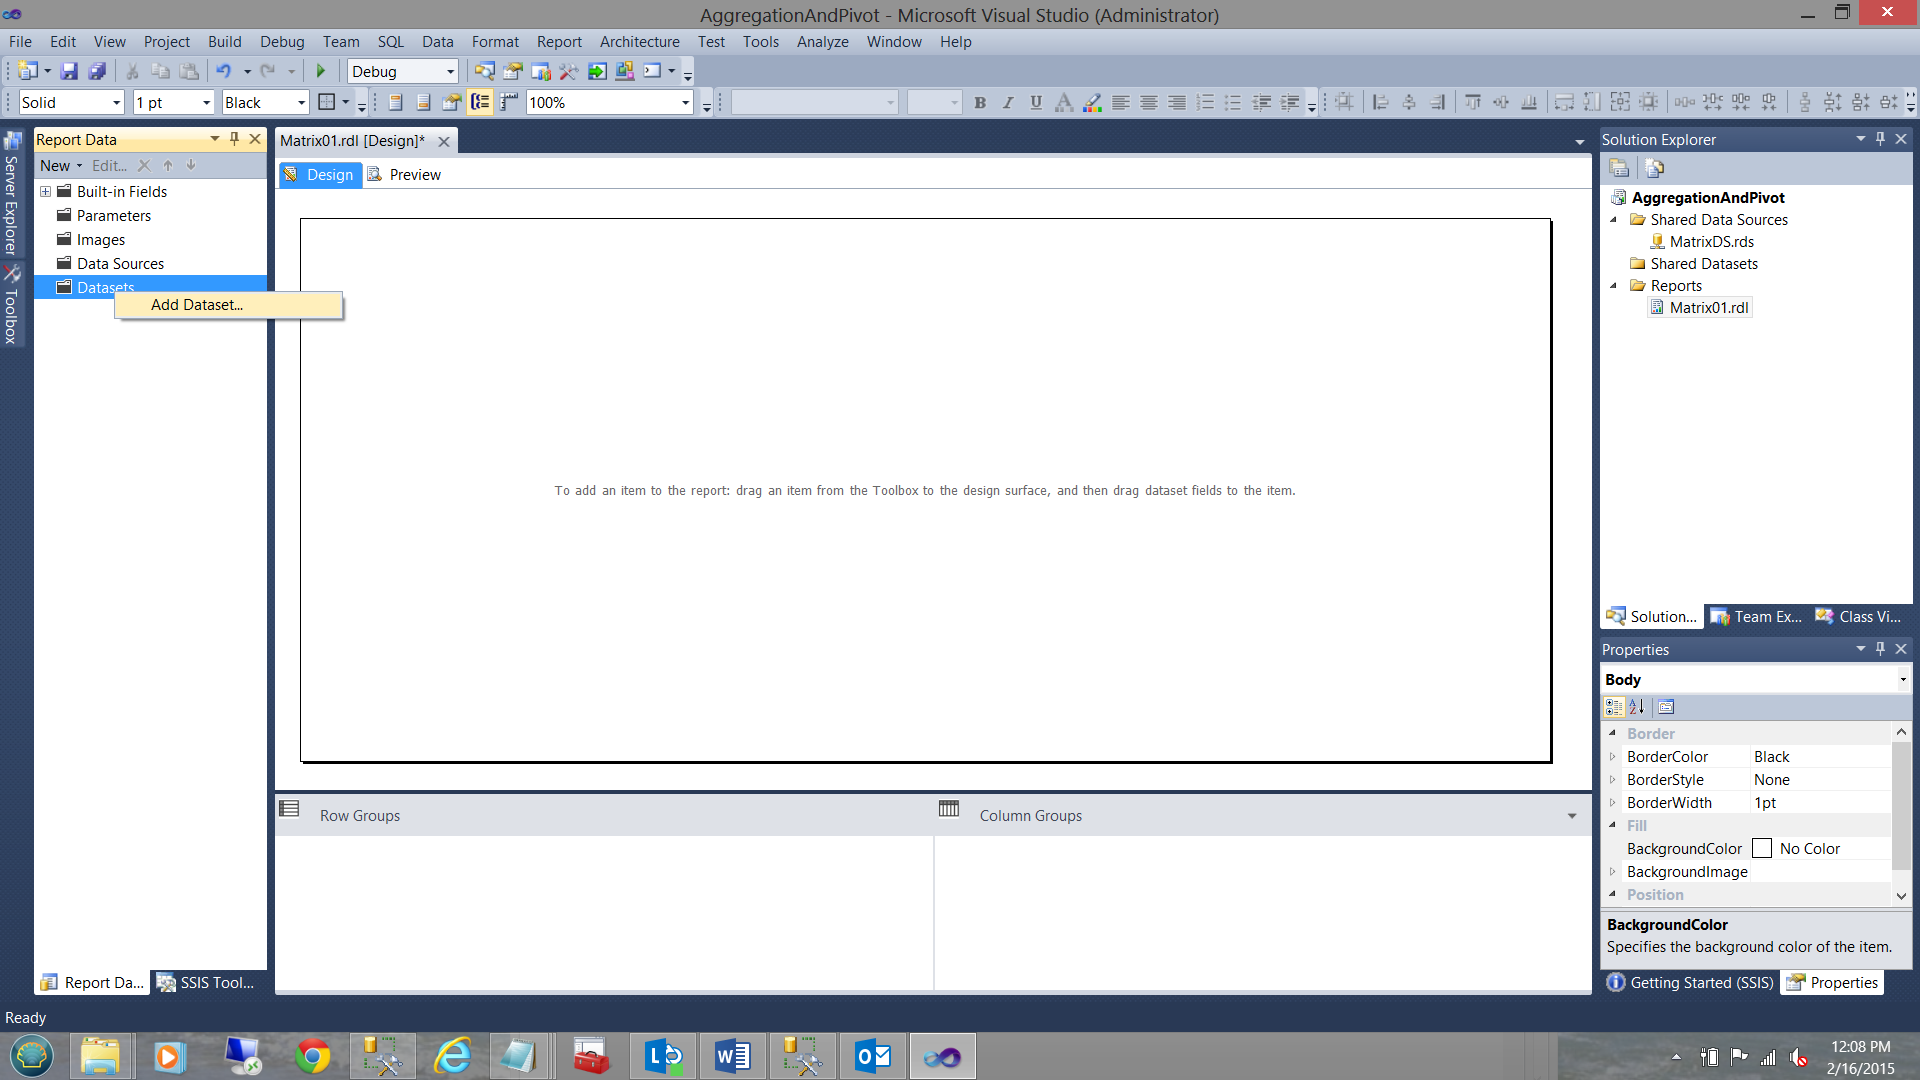
Once on our report drawing surface (see above), we right click upon the “Datasets” folder and select “Add Dataset” from the context menu (see above).
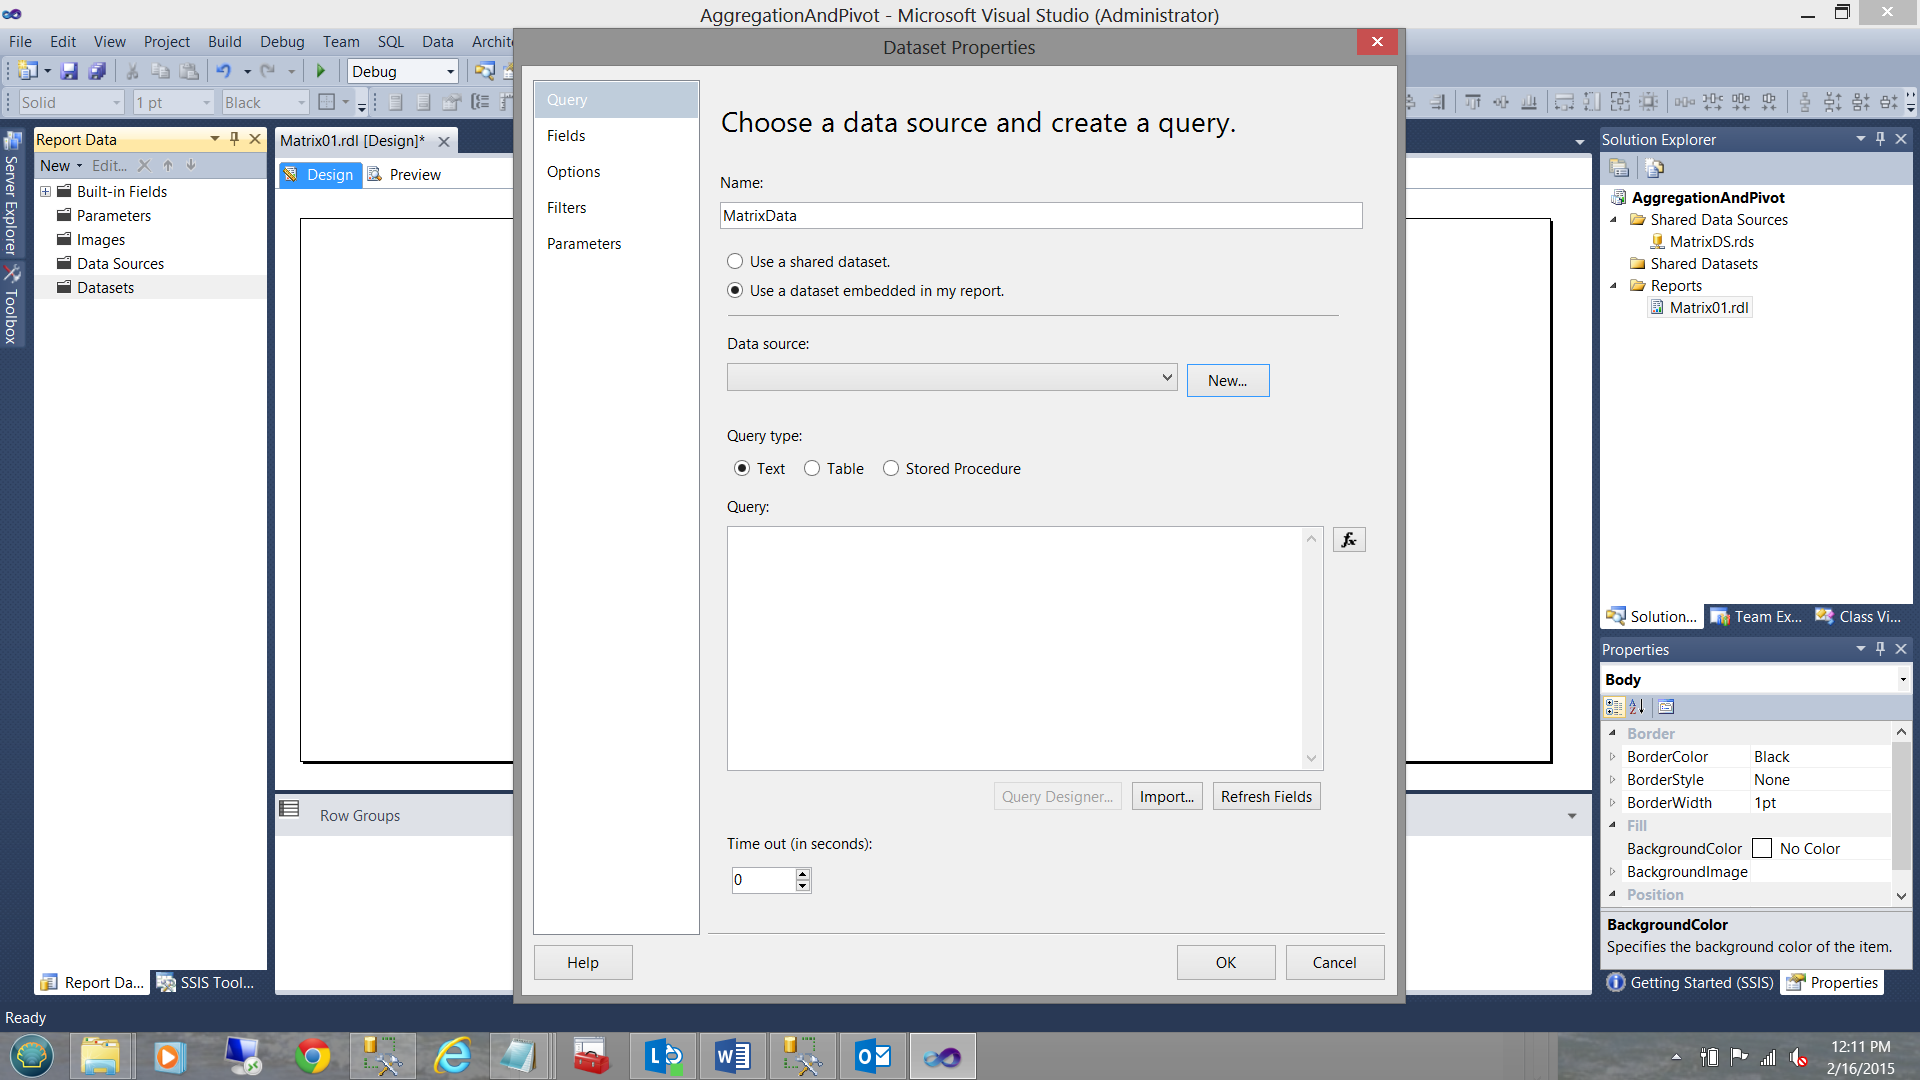
The “Dataset Properties” dialog is brought up and we give our new dataset the name “MatrixData”. We must now define a local data source. We click on the “New” button (see above and to the right).
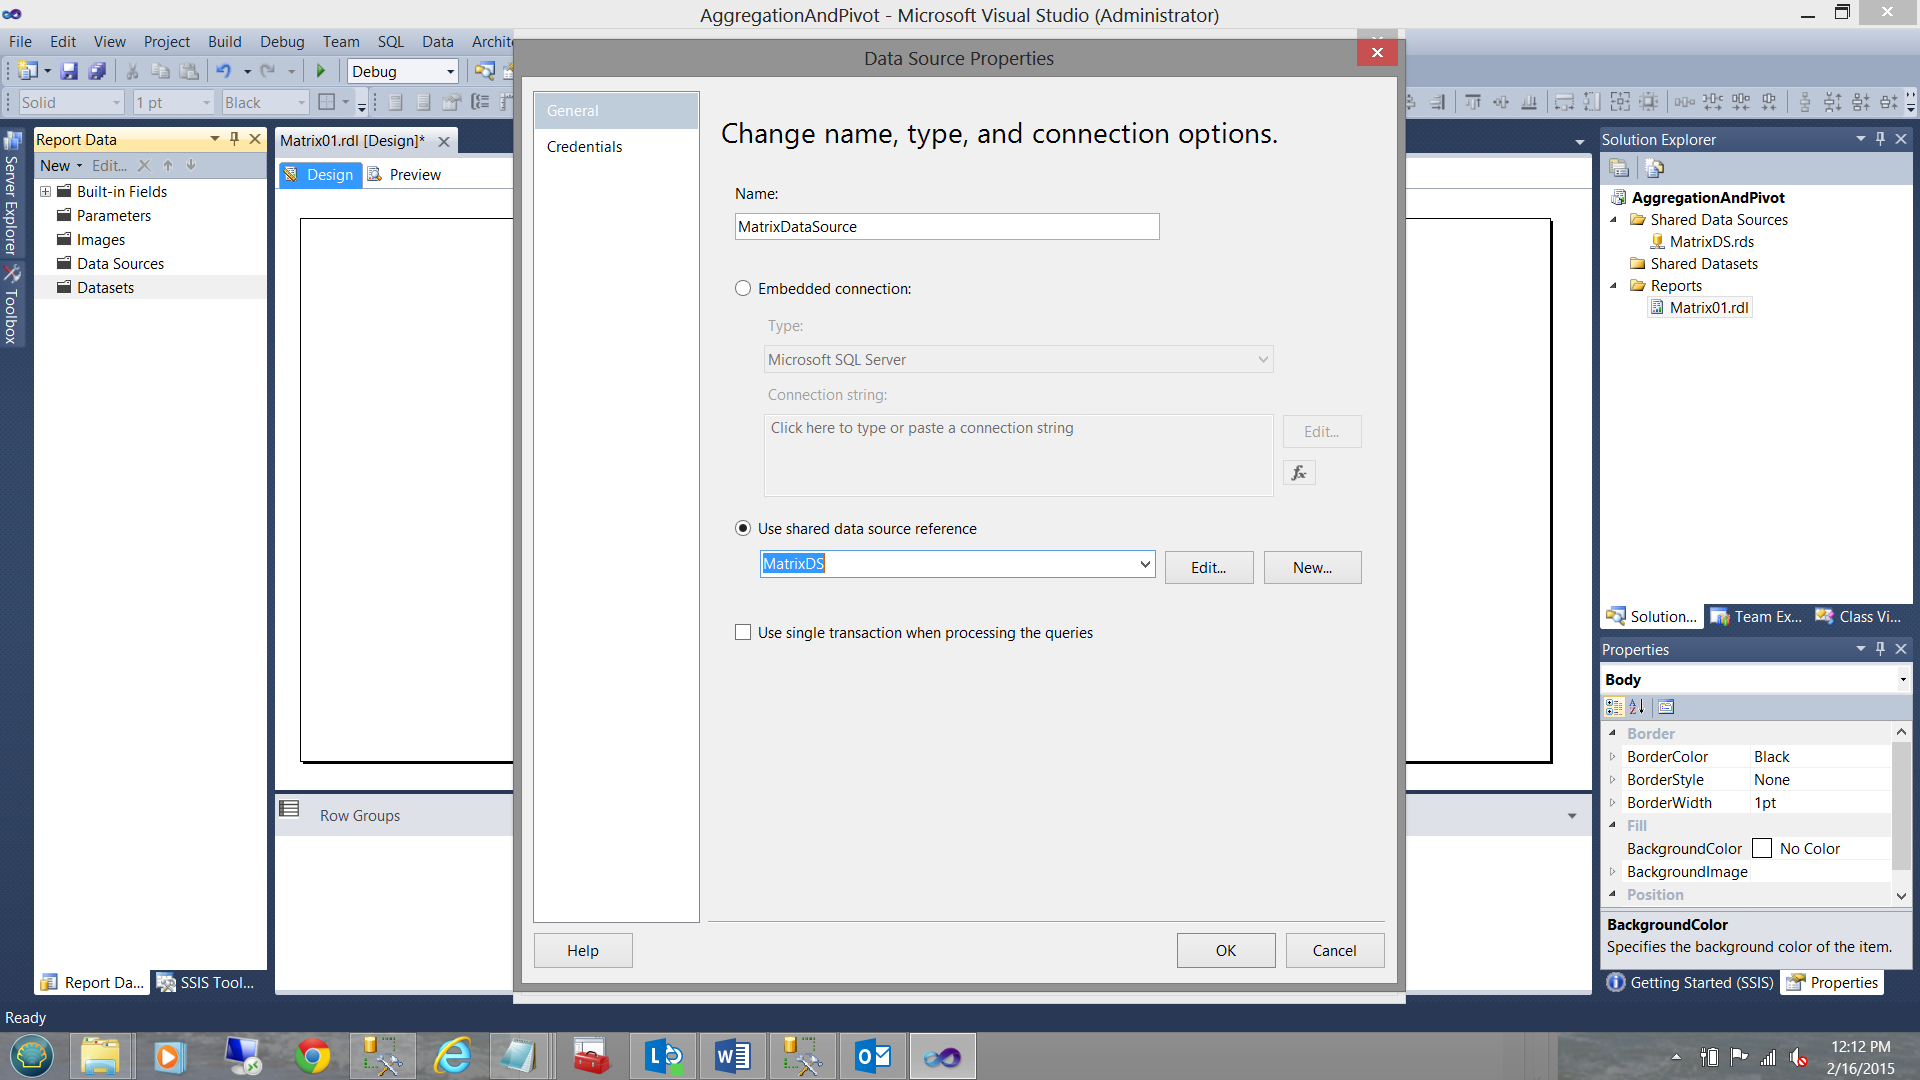
The “Data Source Properties” dialogue box is brought up. We give our local data source the name “MatrixDataSource” and link it to our shared data source “MatrixDS” (see above). We click OK to leave the “Data Source Properties” box and find ourselves back on the “Dataset Properties” page.
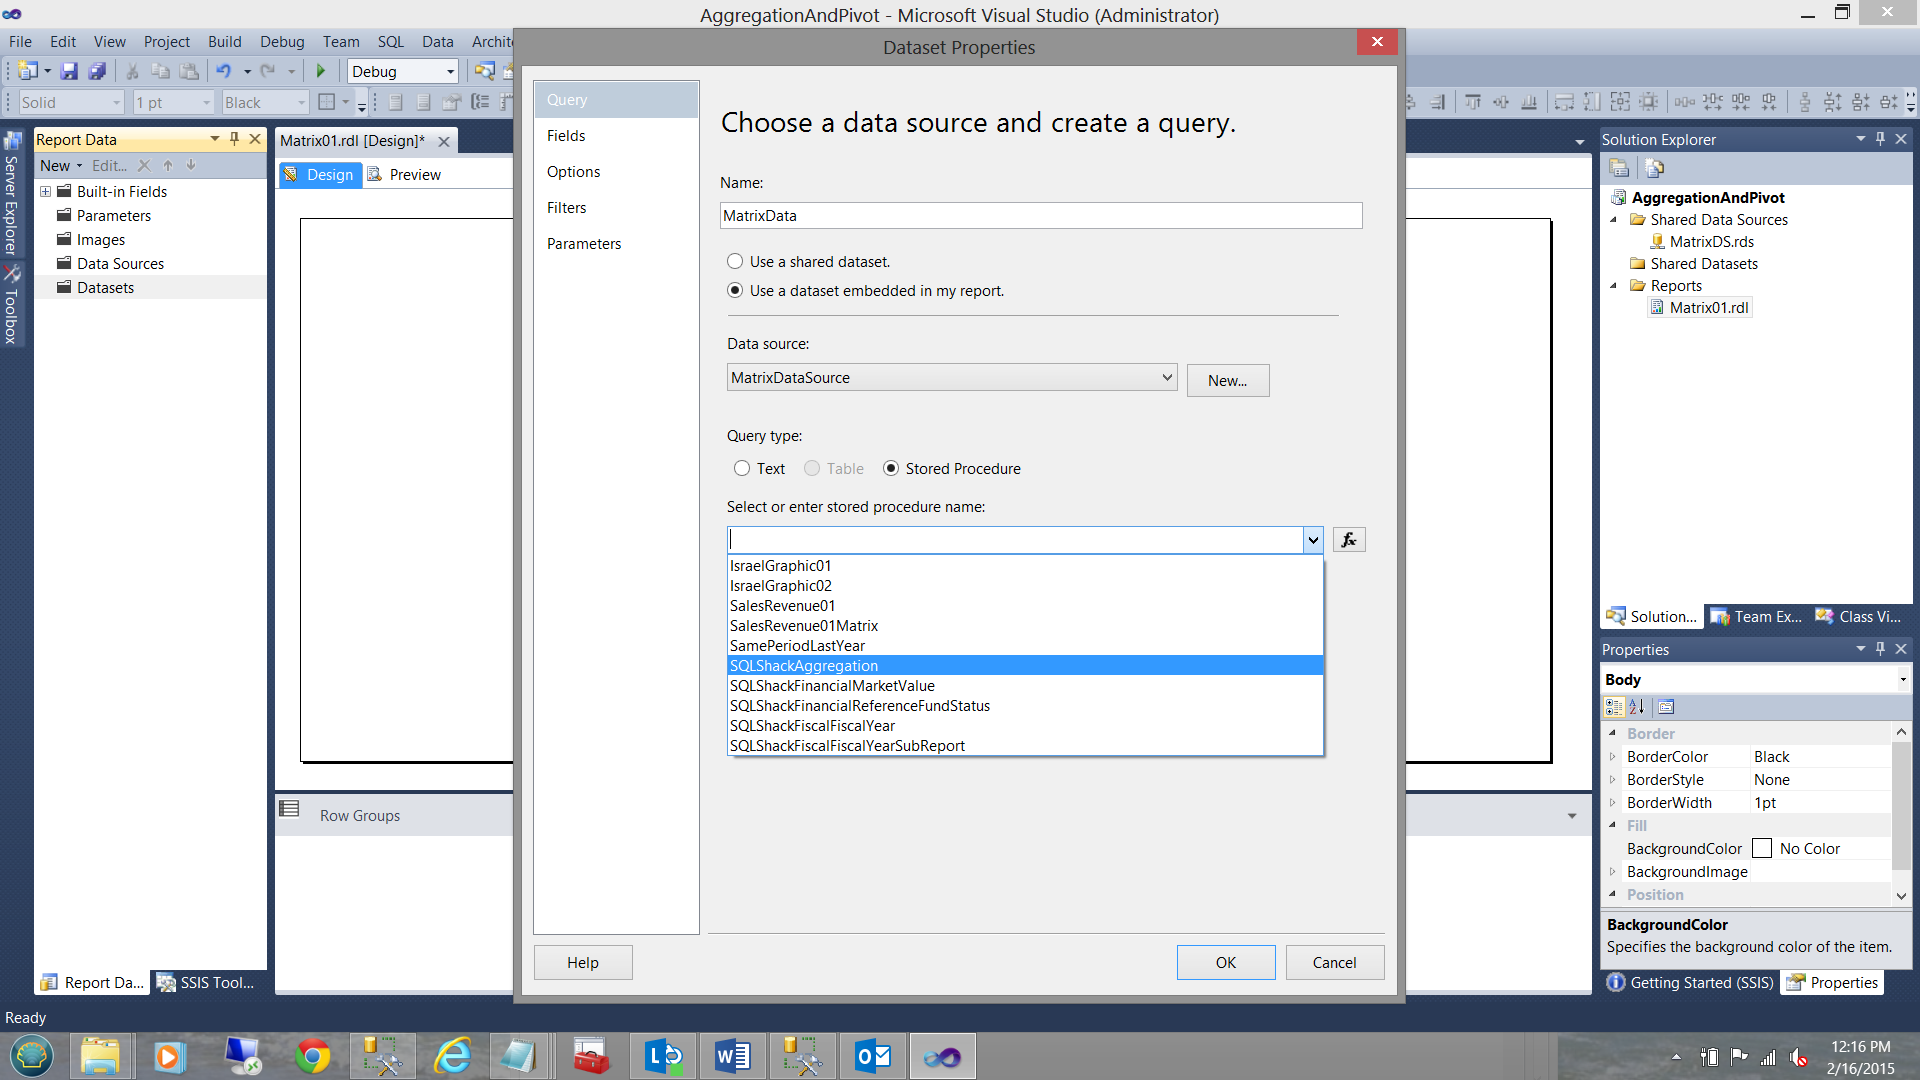
We set our “Query type” to “Stored Procedure” and select the “SQLShackAggregation” procedure from the drop-down list (see above). This is the query that we just created, which is now being utilized as a stored procedure.
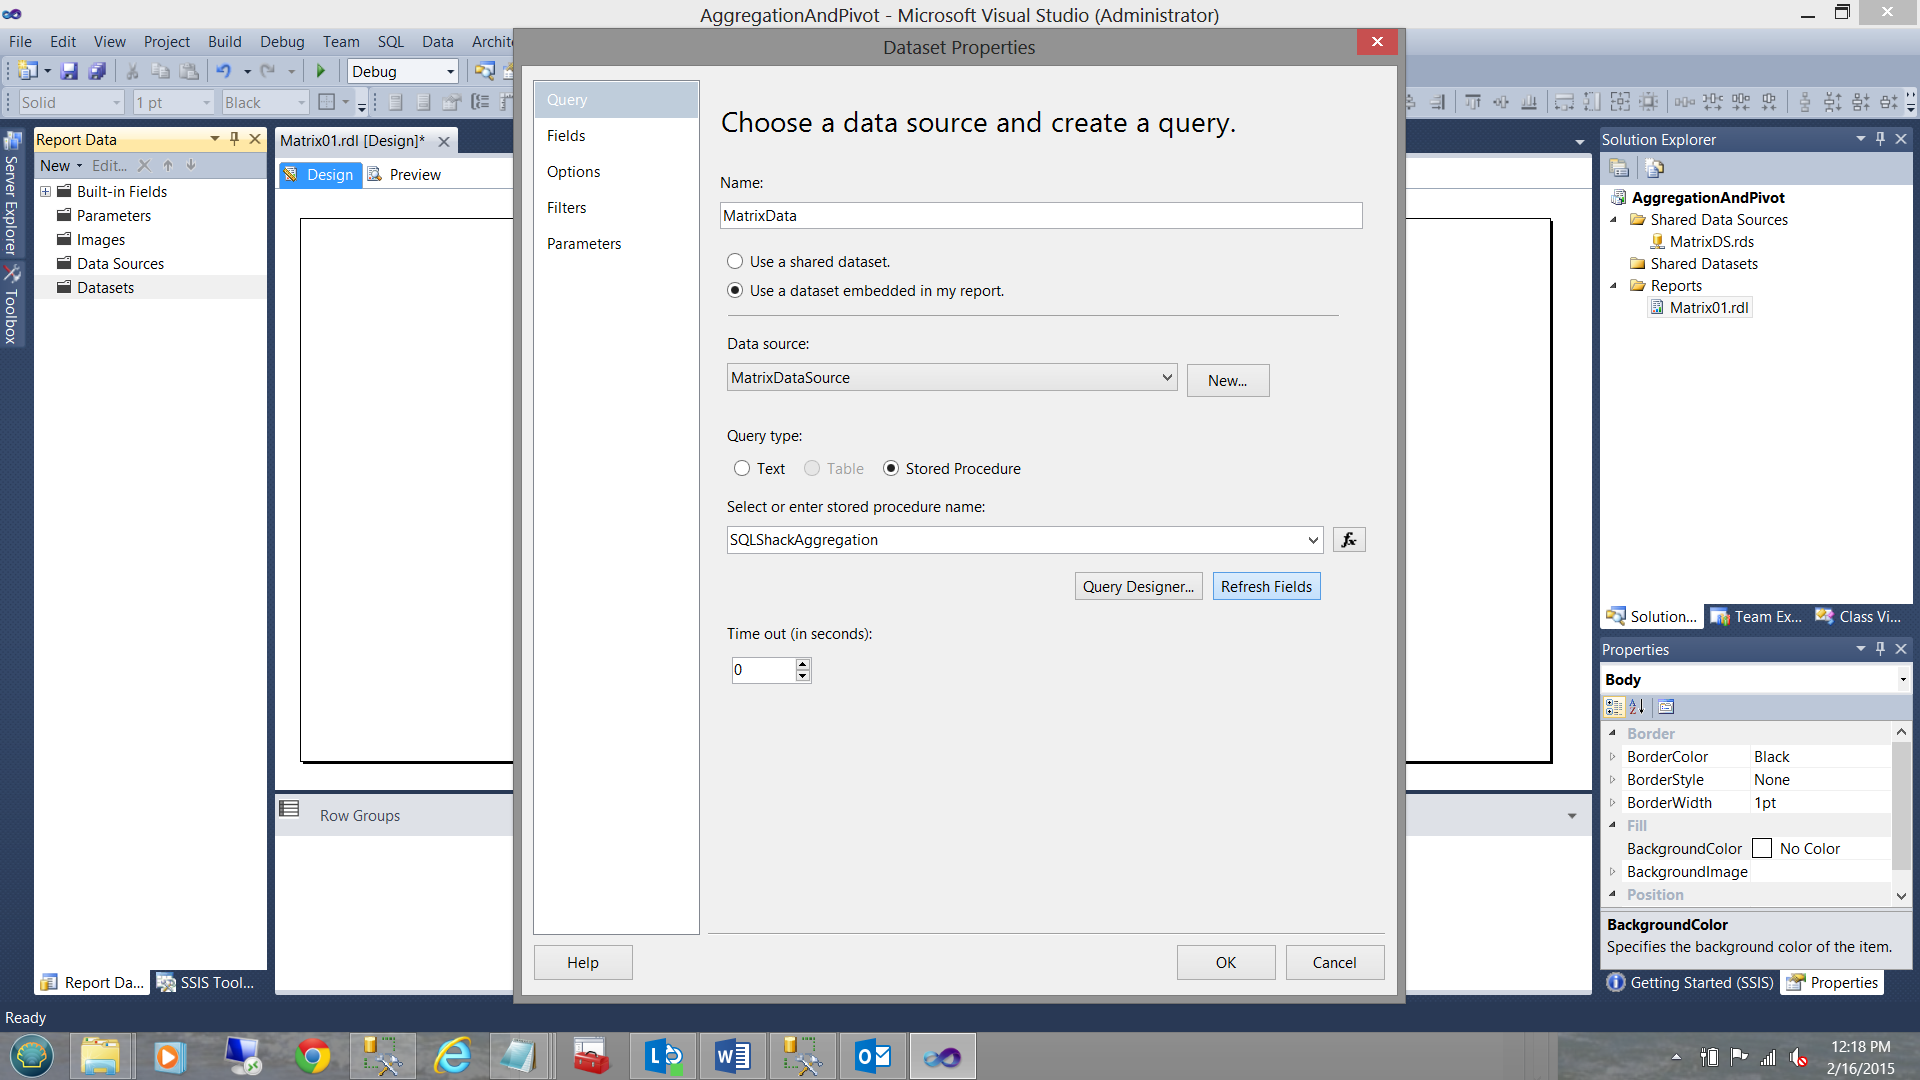
Having accepted our “SQLShackAggregation” stored procedure as our source of data, we click the “Refresh Fields” button (see above). We then click on the “Fields” tab.
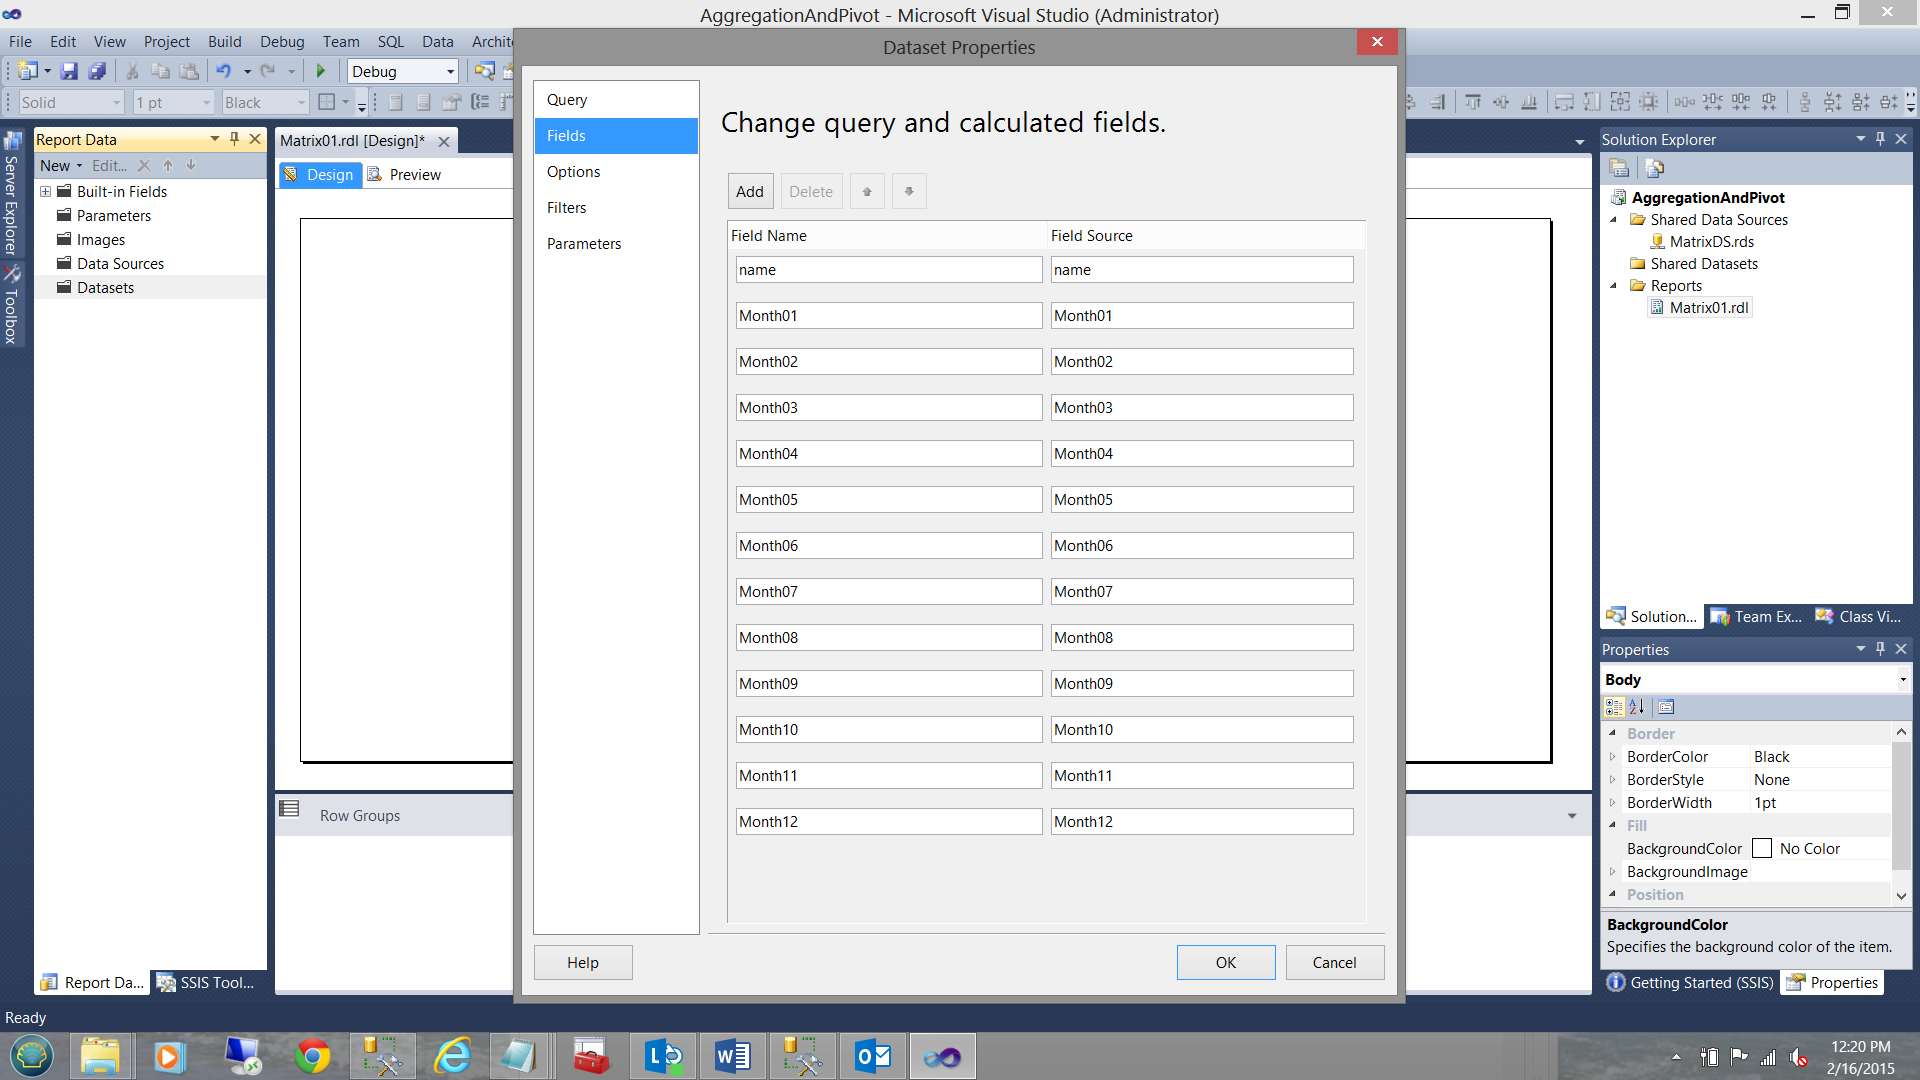
We note that all of the fields that we added to our SQL query are now present in our dataset (see above). We click OK to leave the “Dataset Properties” dialogue box.
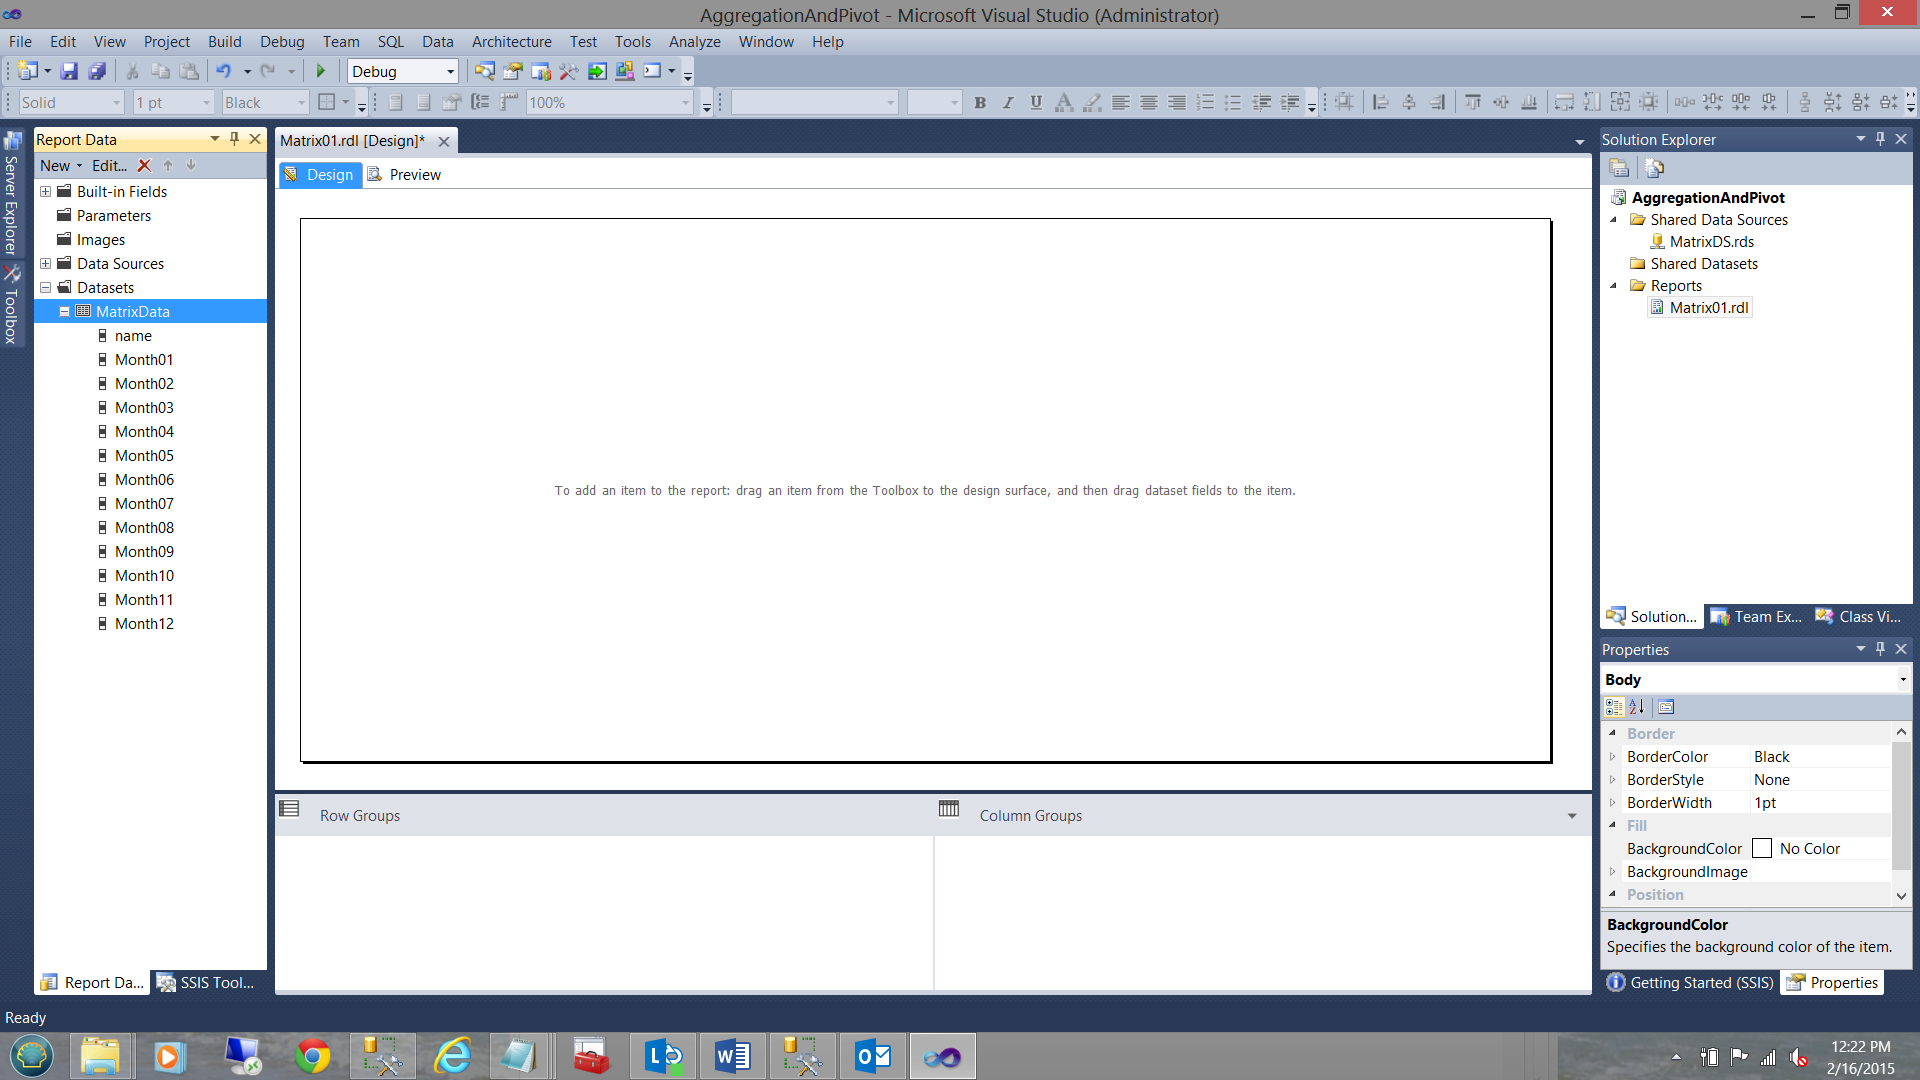
Our completed dataset may be seen on the left of the screenshot above.
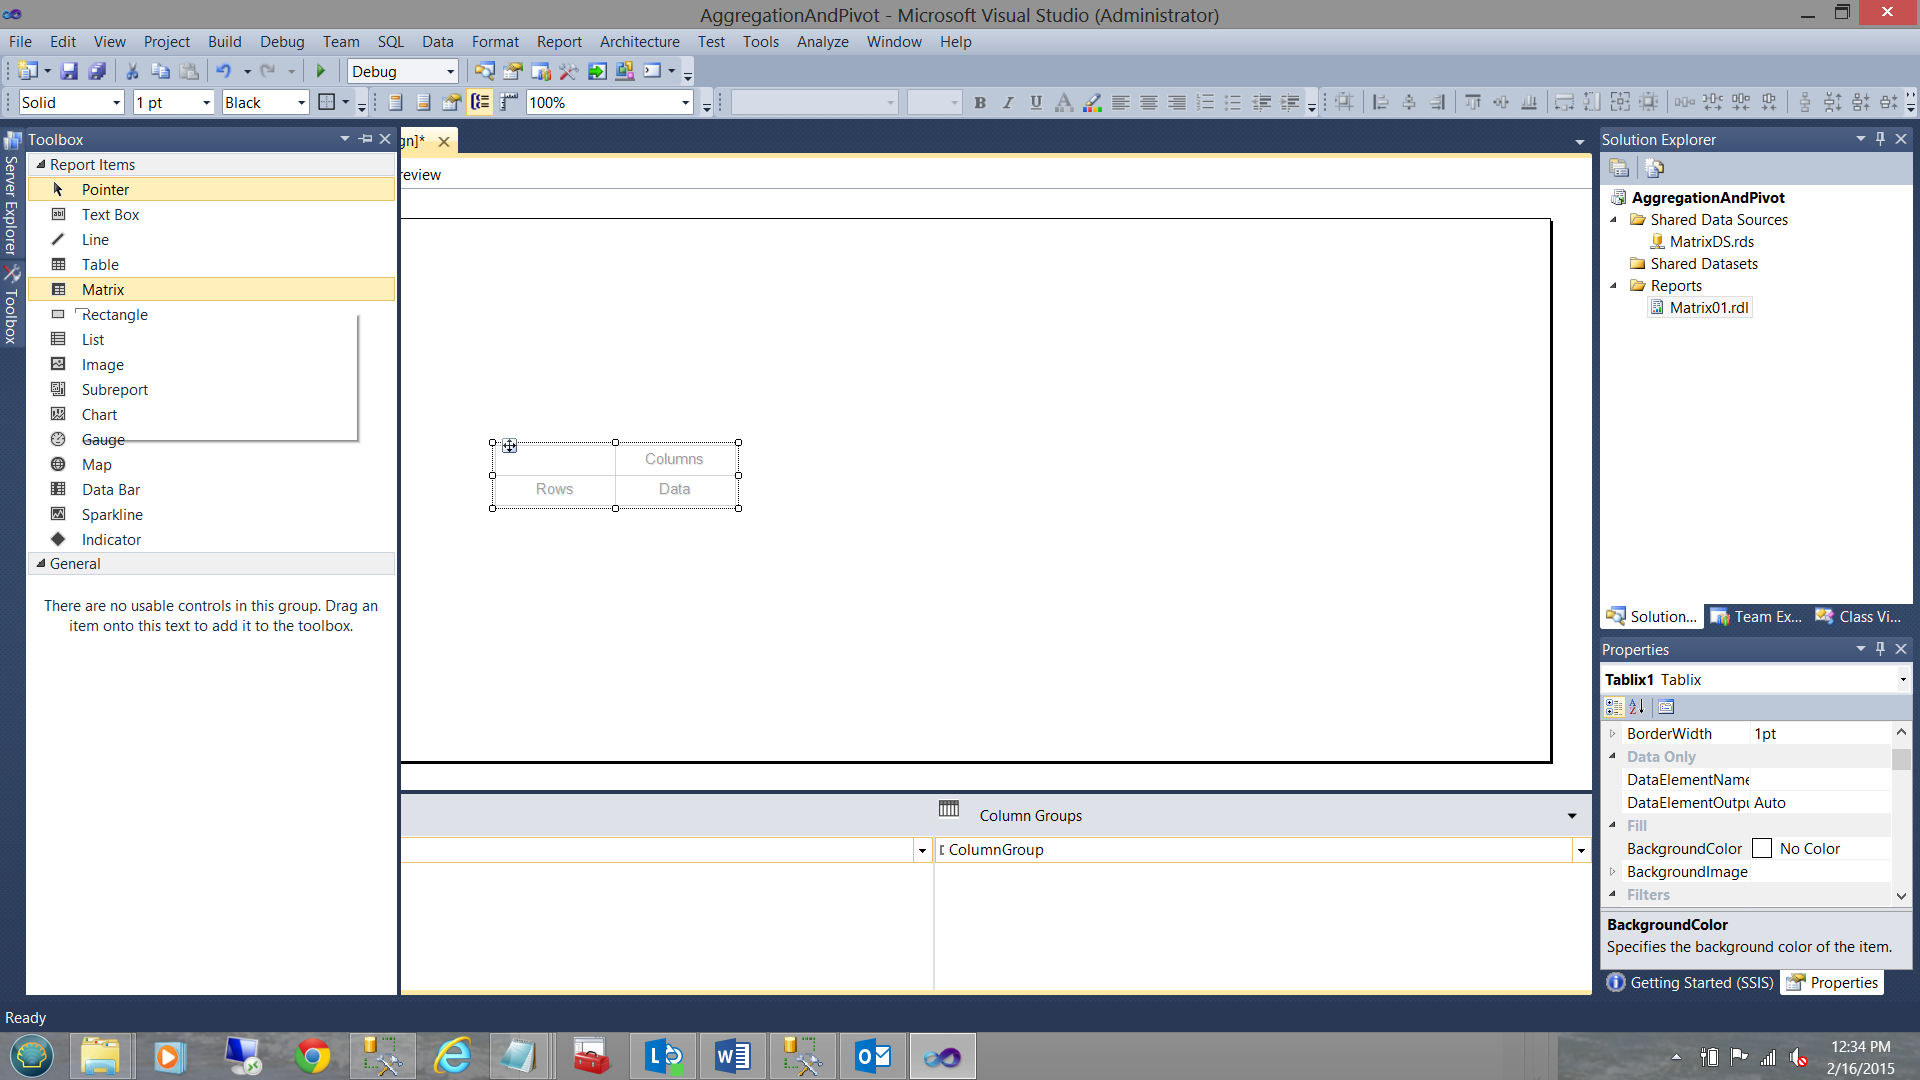
We place a “Matrix Report Item” onto our report surface (see above).
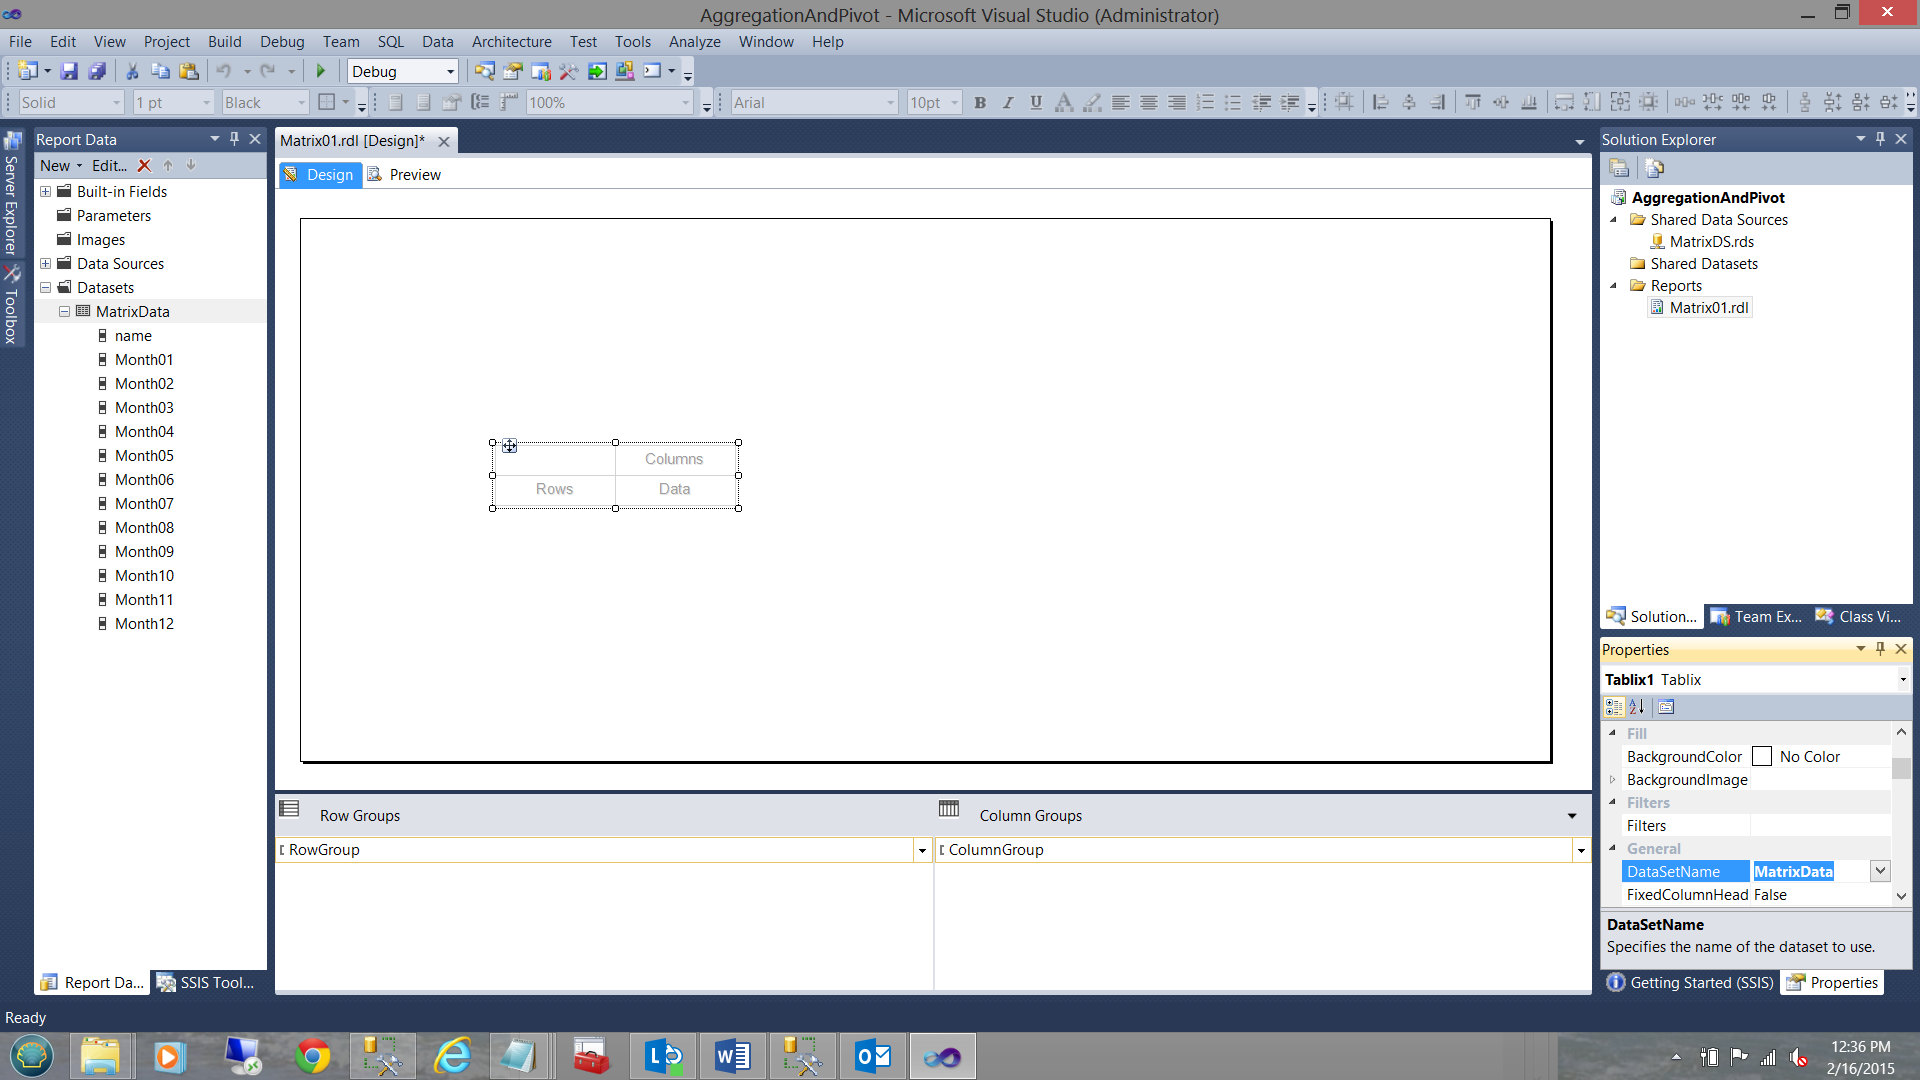
and set its “DataSetName” property ( see above and to the bottom right).
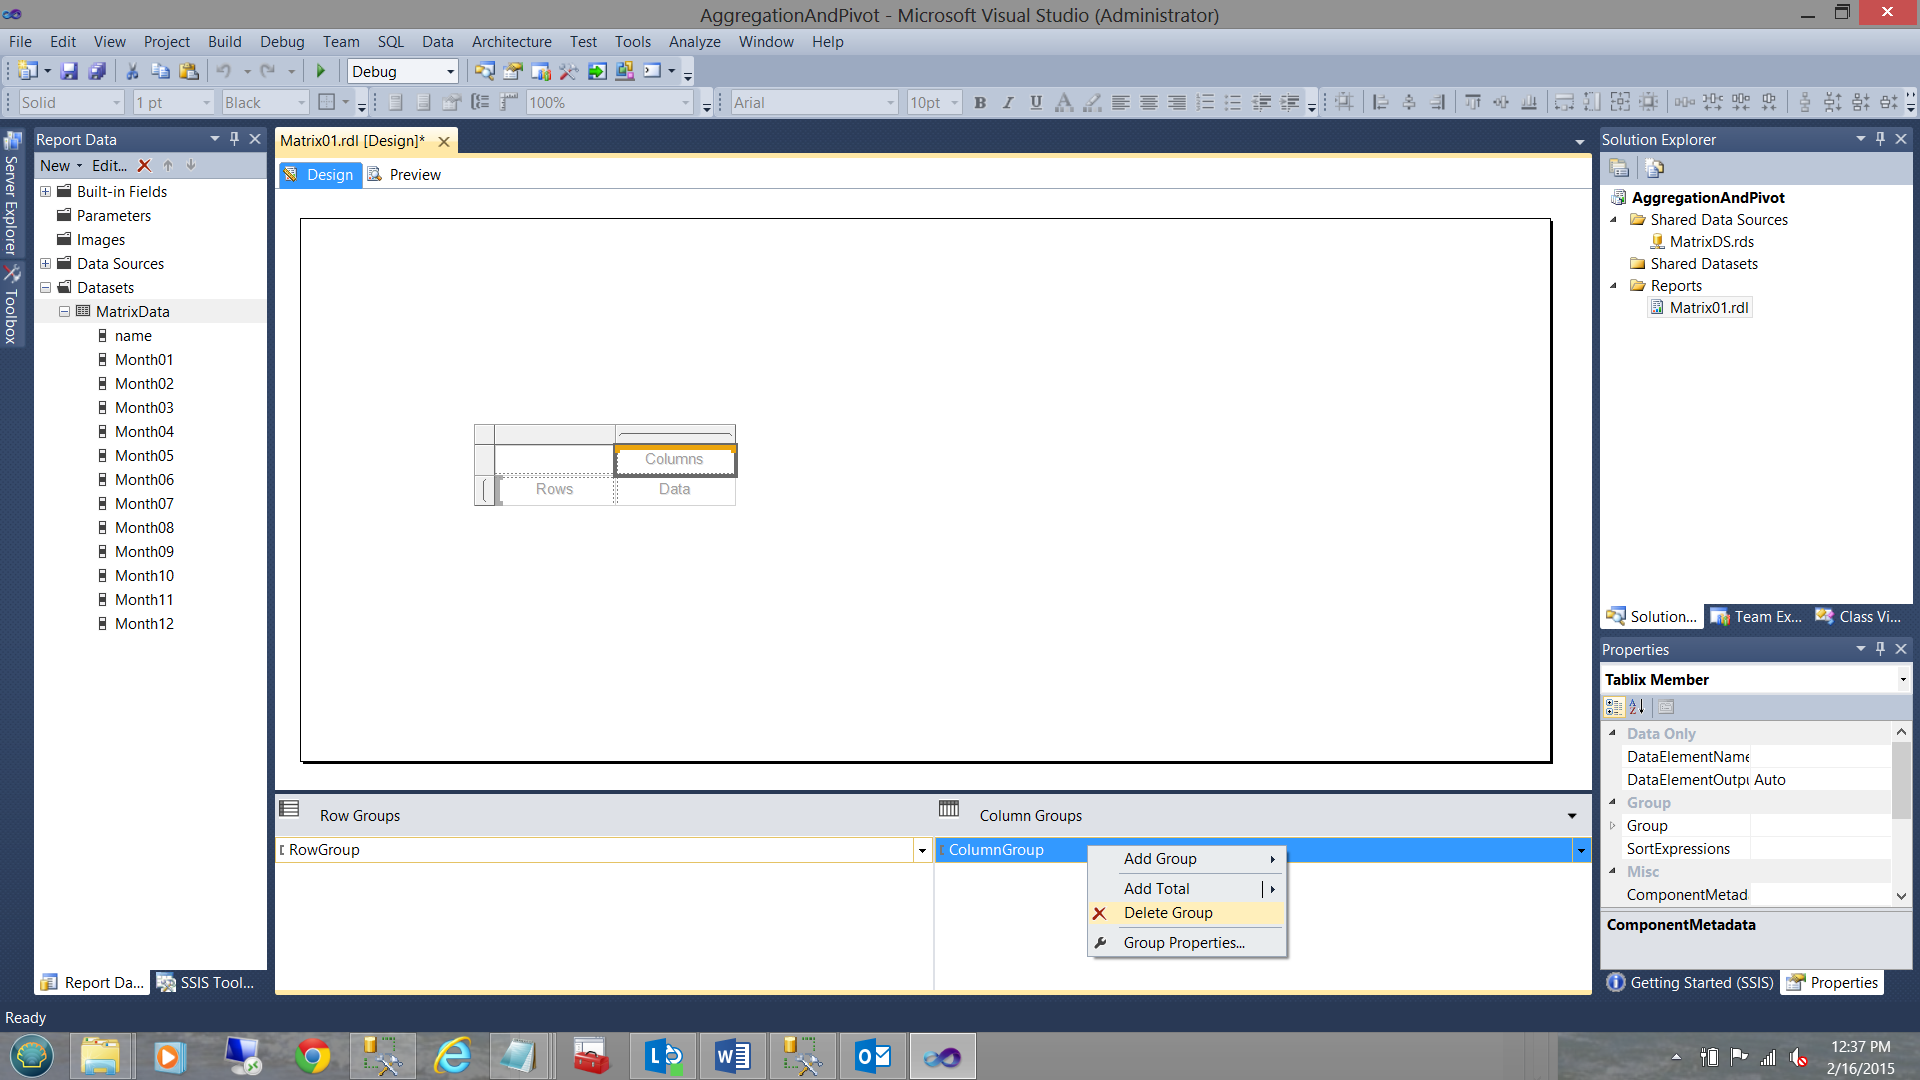
We must now remove the column grouping which is achieved by right-clicking on the “ColumnGroup” and selecting “Delete Group” (see above).
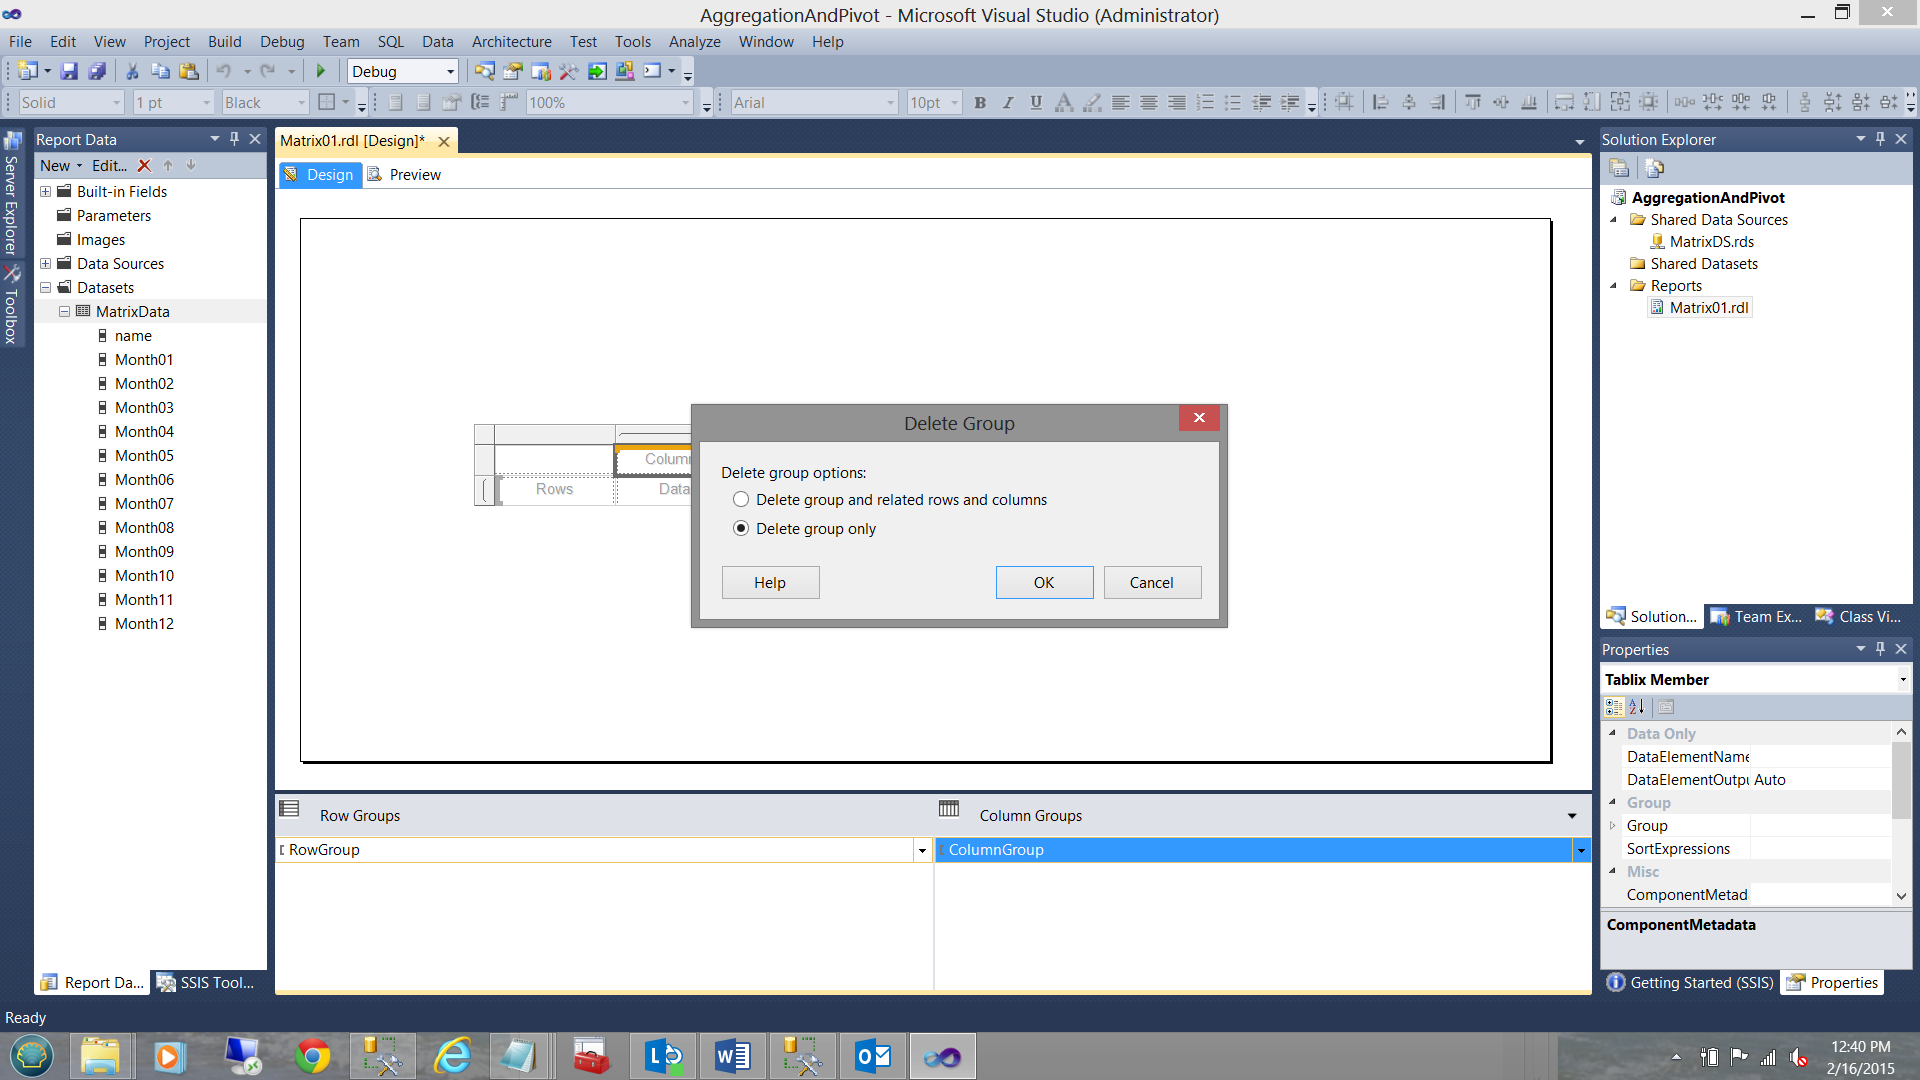
As always, we are asked if we wish to “Delete group and related rows and columns” OR “Delete group only”. We select “Delete group only” (see above).
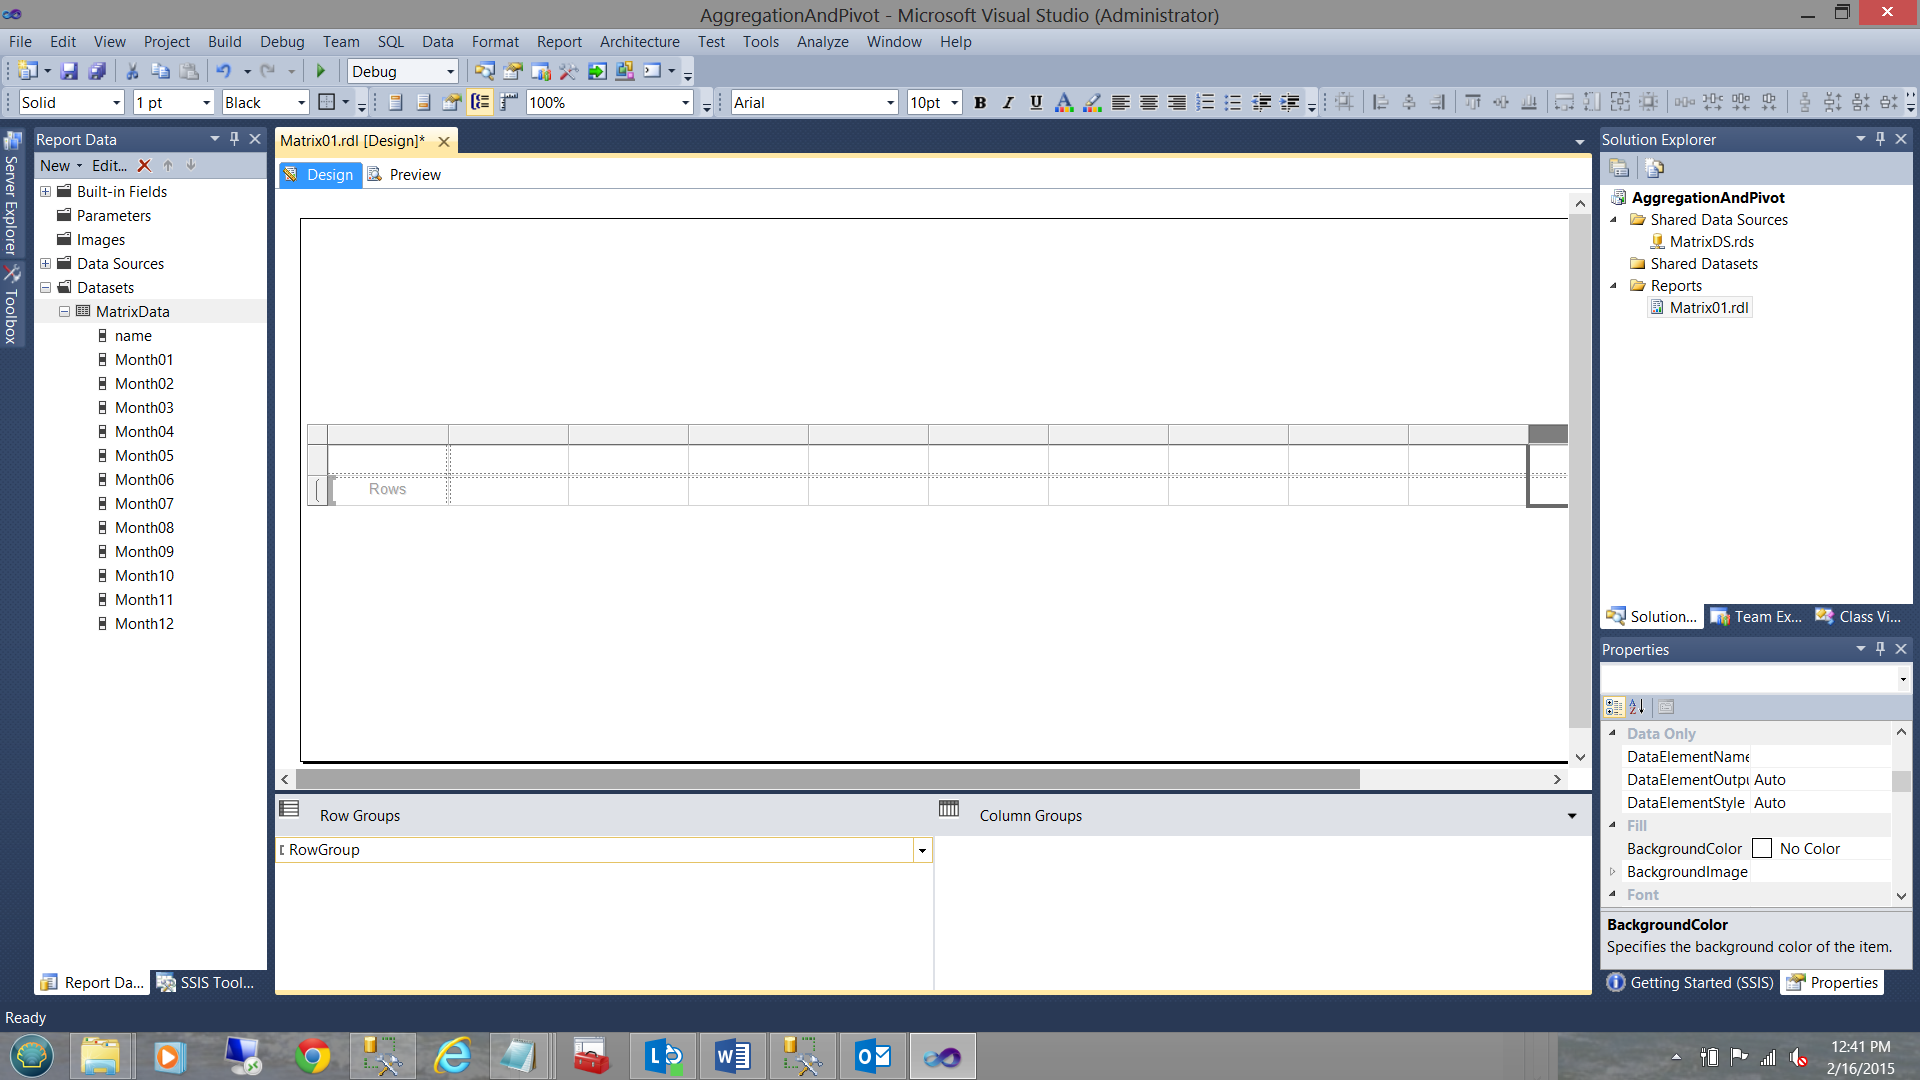
Arriving back on our report surface we add eleven additional columns to our matrix (see above).

We add the “Name” column (from our query, which is either the monthly or cumulative value) to the first column and then each month’s values to the ensuing columns (see above).
Tidying things up a bit and adding a bit of color, our report should be similar to the one shown below:
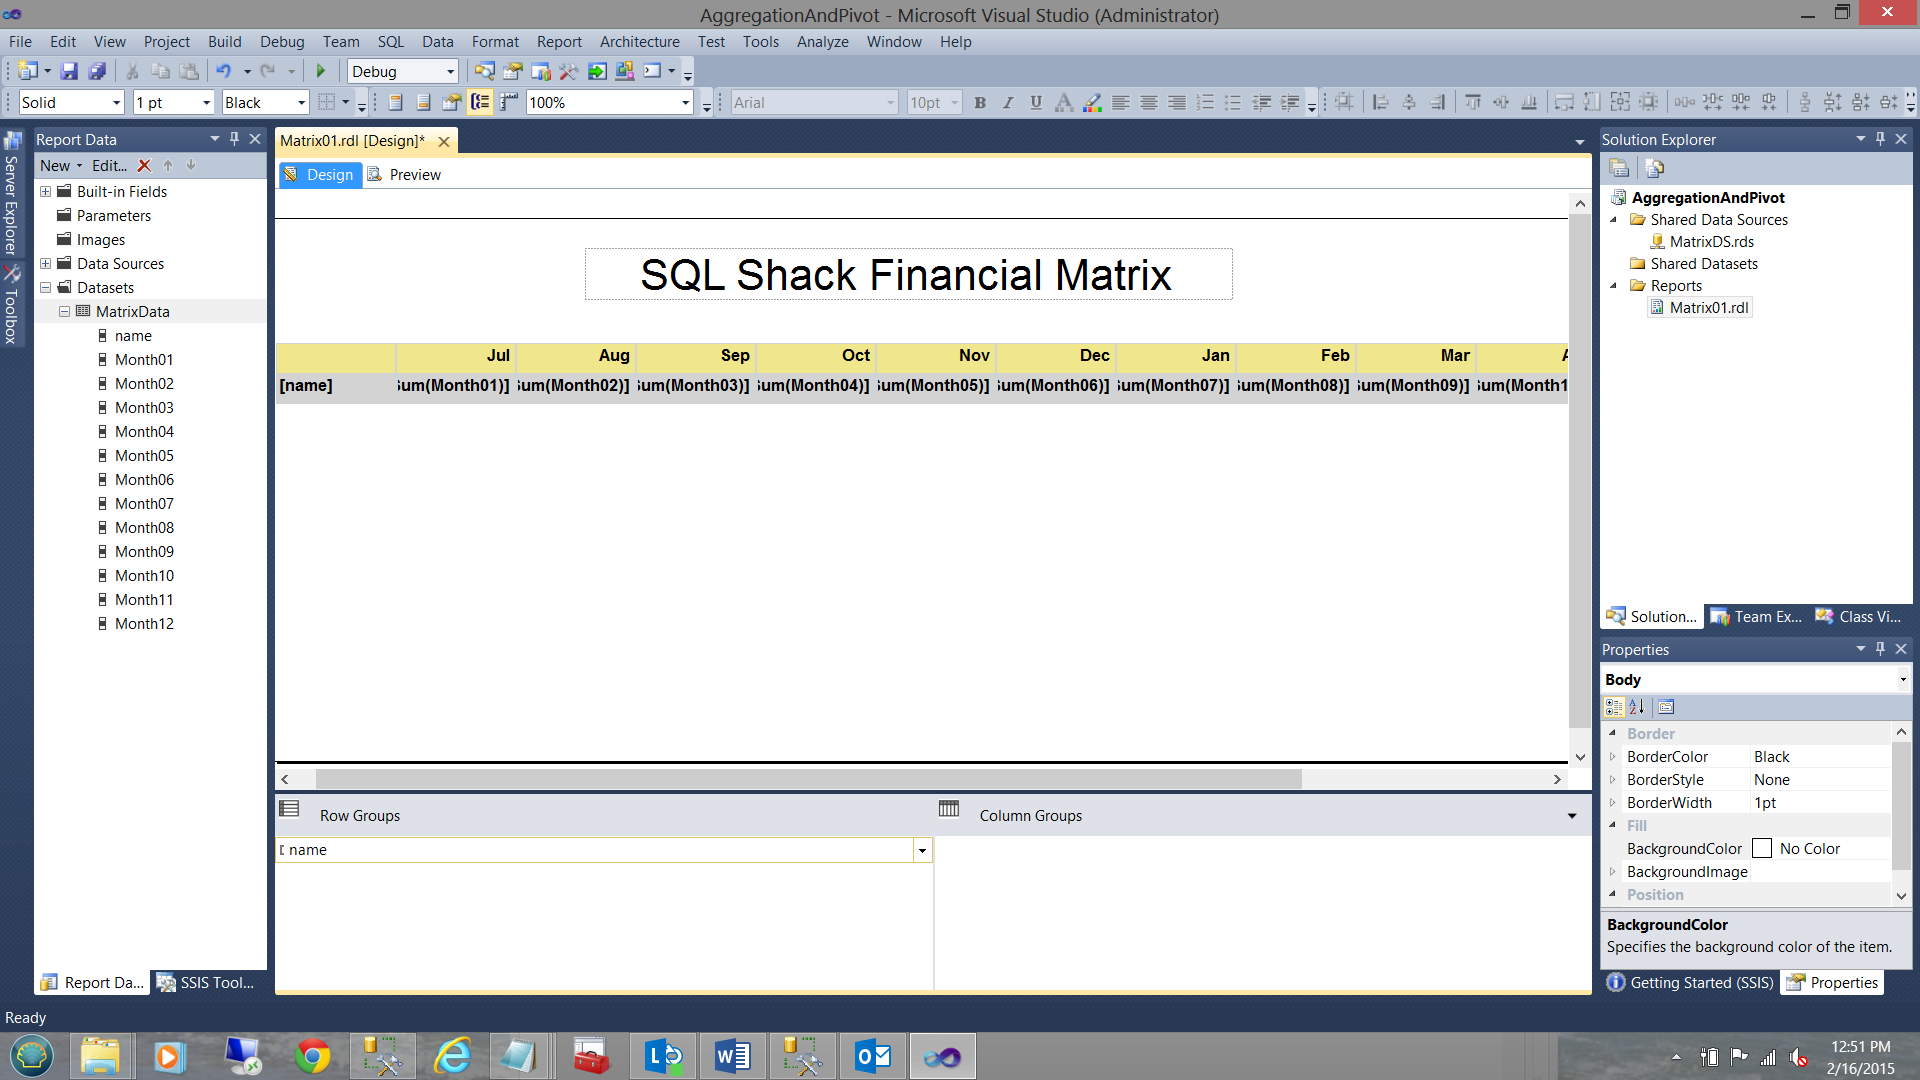
All numeric figures have been changed to currency and right oriented (see above).
We now double click upon the “Row Group” [name] as we must set the sorting of the rows.
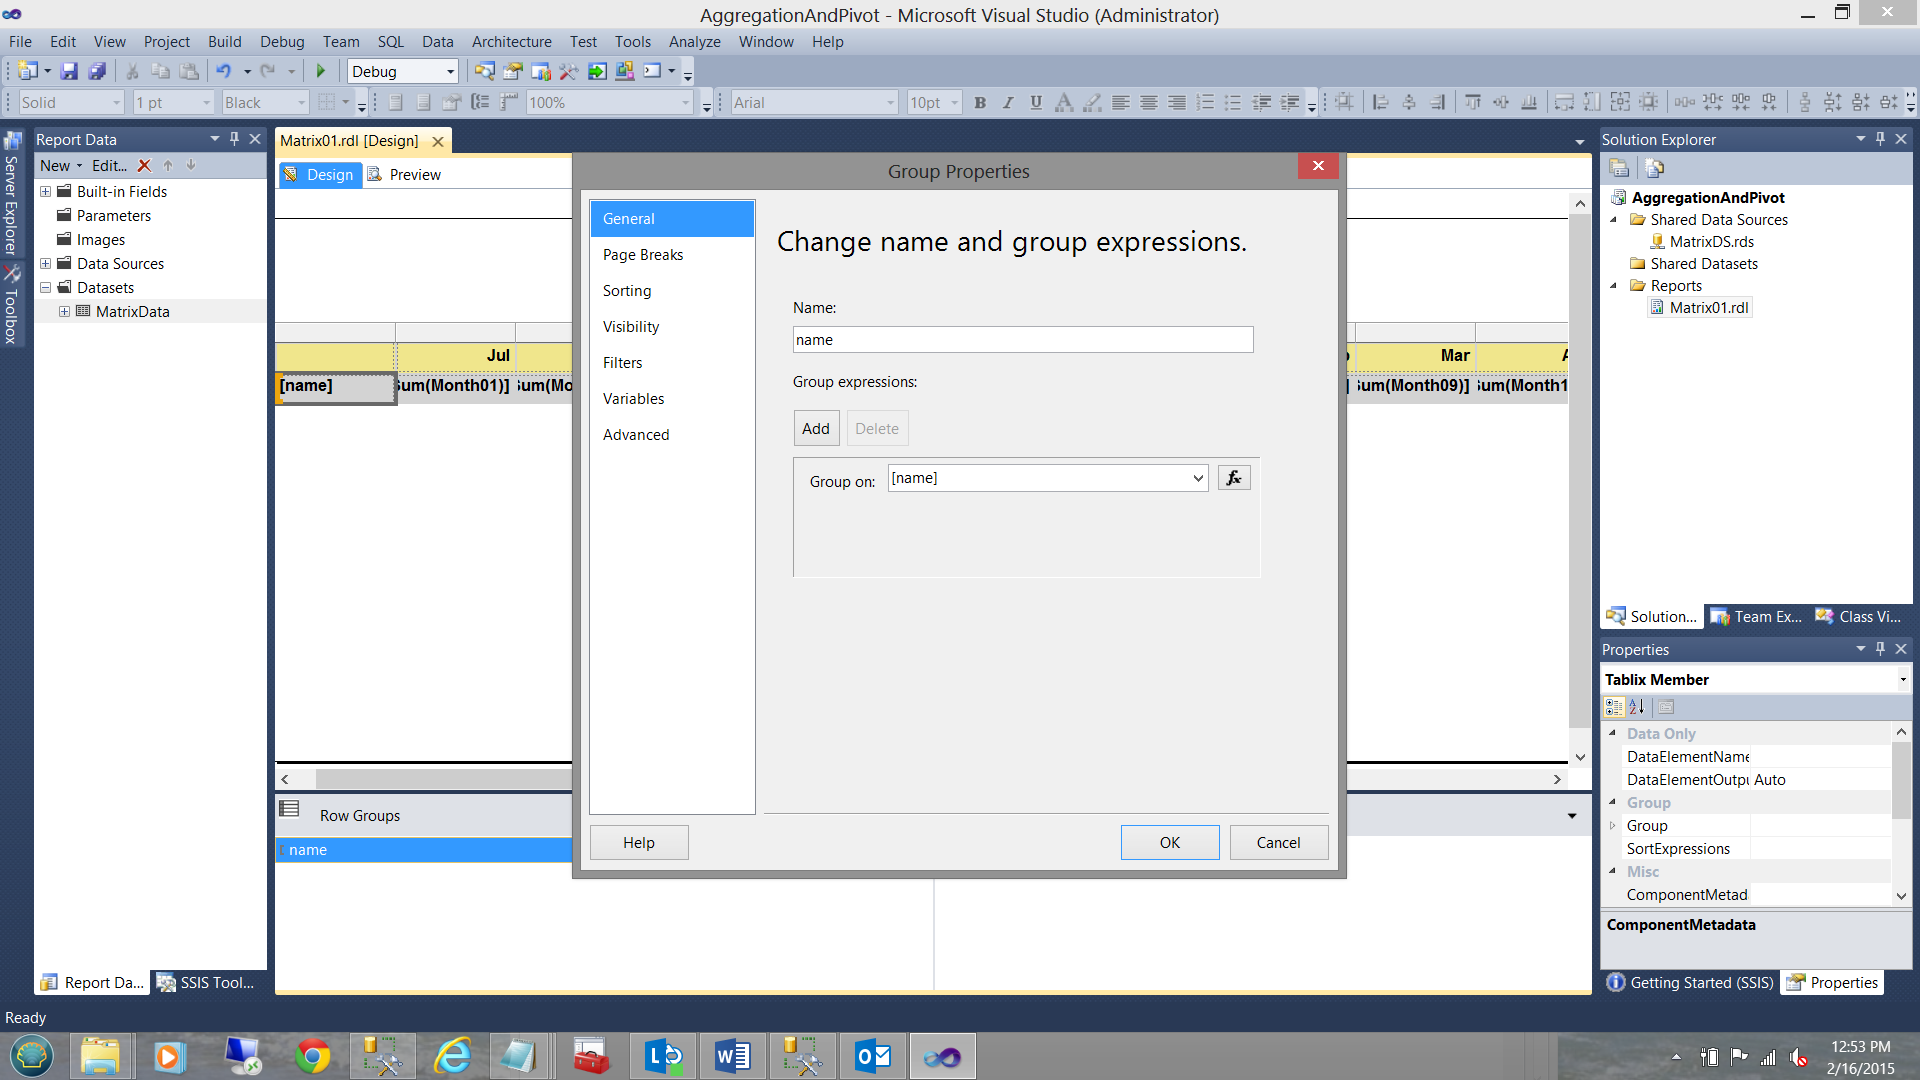
The “Group Properties” dialog box is brought up (see above). We click the “Sorting” tab.
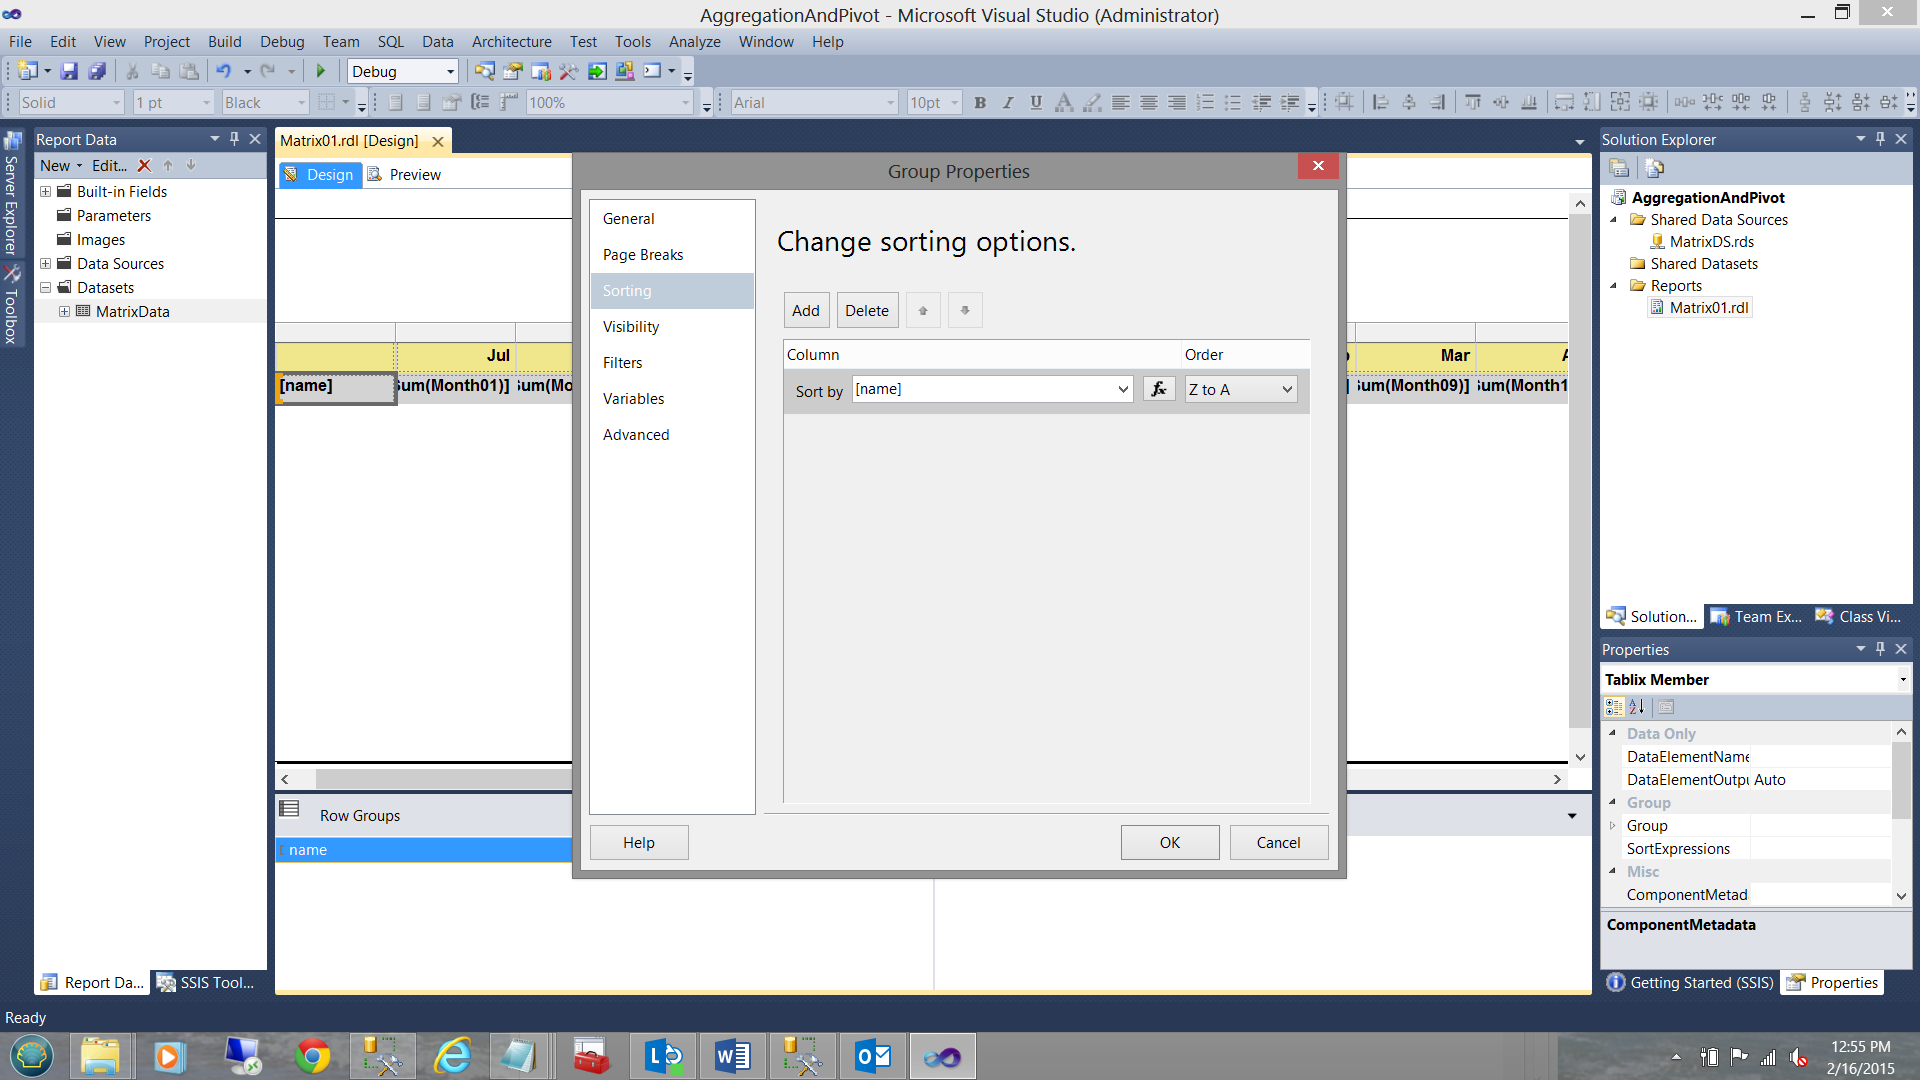
We set the sorting on the column “name” to be from “Z to A”. In other words “descending” (see above). We click “OK” to close the dialogue box.
Let us give it a run
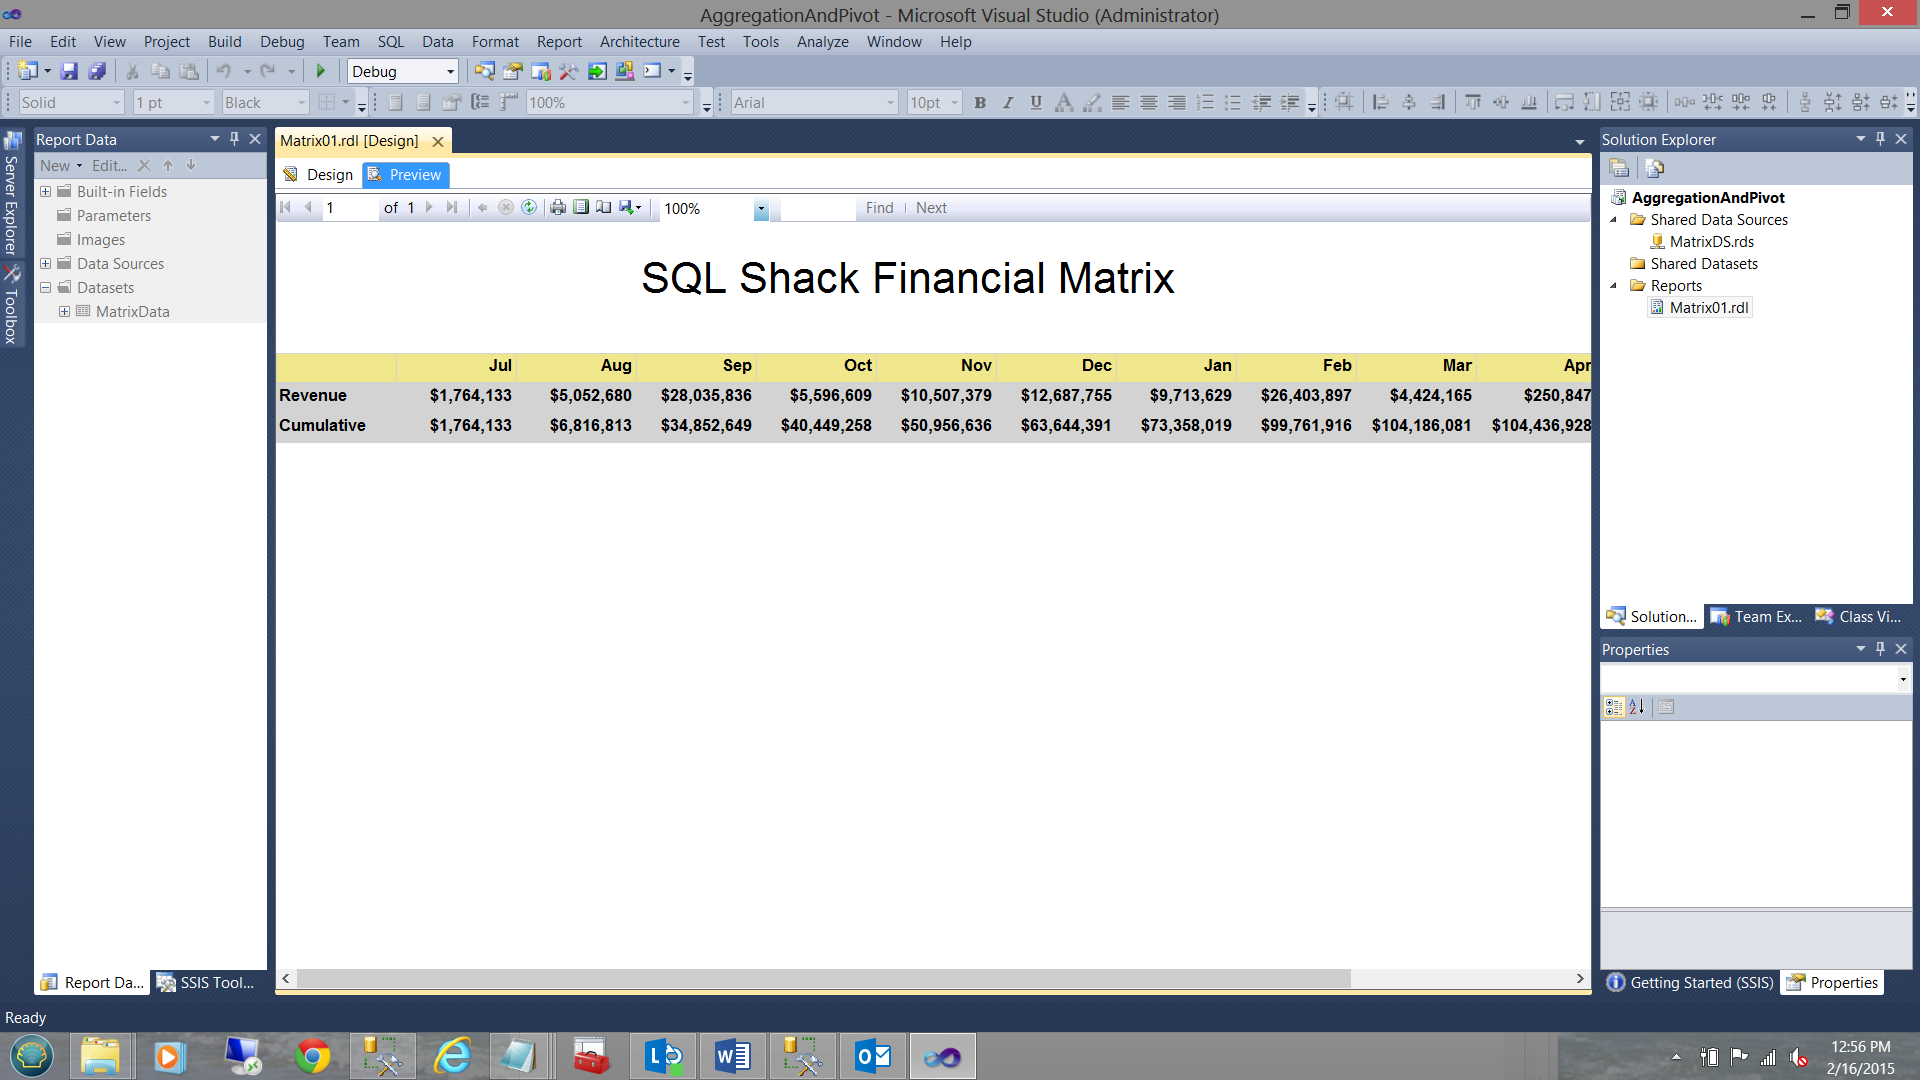
Clicking the “Preview” button, we render our report. Note that two rows are rendered. The first, the monthly revenue and the second row, the year to date. This is exactly what we planned to achieve.
Conclusions
In today’s “Get together” we saw that extracting data in the correct format is not always that easy. Running totals are often required in reports and they are easy to achieve via looping or by utilizing a “SQL Server dirty word”, a cursor.
No matter which technique is utilized the data may still be in an in appropriate format and oft times to get our data into the correct format we must “pivot” of data.
This said we have seen how easily our data may be pivoted.
This brings us to the end of today’s “get together”. I hope that I have generated more questions than answers.
As always, should you have any questions or concerns OR wish to obtain a copy of the code and applications, please do feel free to contact me.
In the interim, happy programming!
ADDENDA 1 (Stored Procedure listing)
|
1 2 3 4 5 6 7 8 9 10 11 12 13 14 15 16 17 18 19 20 21 22 23 24 25 26 27 28 29 30 31 32 33 34 35 36 37 38 39 40 41 42 43 44 45 46 47 48 49 50 51 52 53 54 55 56 57 58 59 60 61 62 63 64 65 66 67 68 69 70 71 72 73 74 75 76 77 78 79 80 81 82 83 84 85 86 87 88 89 90 91 92 93 94 95 96 97 98 99 100 101 102 103 104 105 106 107 108 109 110 111 112 113 114 115 116 117 118 119 120 121 122 123 124 125 126 127 128 129 130 131 132 133 134 135 136 137 138 139 140 141 142 143 144 145 146 147 148 149 150 151 152 153 154 155 156 157 158 159 160 161 162 163 164 165 166 167 168 169 170 171 172 173 174 175 176 177 178 179 180 181 182 183 184 185 186 187 188 189 190 191 192 193 194 195 196 197 198 199 200 201 202 203 204 205 206 207 208 209 |
use [SQLShackFinancial] go --IF OBJECT_ID(N'tempdb..#rawdata1') IS NOT NULL --BEGIN -- DROP TABLE #rawdata1 --END --IF OBJECT_ID(N'tempdb..#rawdata2') IS NOT NULL --BEGIN -- DROP TABLE #rawdata2 --END --IF OBJECT_ID(N'tempdb..#rawdata55') IS NOT NULL --BEGIN -- DROP TABLE #rawdata55 --END create procedure SQLShackAggregation as declare @beginFiscal date declare @endFiscal date declare @month01 varchar(6) declare @month02 varchar(6) declare @month03 varchar(6) declare @month04 varchar(6) declare @month05 varchar(6) declare @month06 varchar(6) declare @month07 varchar(6) declare @month08 varchar(6) declare @month09 varchar(6) declare @month10 varchar(6) declare @month11 varchar(6) declare @month12 varchar(6) declare @decider int declare @Yearr varchar(4) set @decider = datepart(Month,convert(date,getdate())) set @Yearr = datepart(YEAR,Convert(date,Getdate())) -- set @Yearr = case when @decider >= 7 then datepart(YEAR,Convert(date,Getdate())) else @Yearr -1 end set @Beginfiscal = convert(varchar(4),@Yearr) + '0701' set @Endfiscal = dateadd(d,-1,dateadd(Year,1,@beginFiscal)) set @month01 = convert(varchar(4),datepart(Year,@beginFiscal)) + case when len(convert(varchar(2),datepart(Month,@beginFiscal))) = 1 then convert(varchar(2),'0' + convert(varchar(2),datepart(Month,@beginFiscal))) else convert(varchar(2),datepart(Month,@beginFiscal)) end set @month02 = convert(varchar(4),datepart(Year,@beginFiscal)) + case when len(convert(varchar(2),datepart(Month,dateadd(mm,1,@beginFiscal)))) = 1 then convert(varchar(2),'0' + convert(varchar(2),datepart(Month,dateadd(mm,1,@beginFiscal)))) else convert(varchar(2),datepart(Month,dateadd(mm,1,@beginFiscal))) end set @month03 = convert(varchar(4),datepart(Year,@beginFiscal)) + case when len(convert(varchar(2),datepart(Month,dateadd(mm,2,@beginFiscal)))) = 1 then convert(varchar(2),'0' + convert(varchar(2),datepart(Month,dateadd(mm,2,@beginFiscal)))) else convert(varchar(2),datepart(Month,dateadd(mm,2,@beginFiscal))) end set @month04 = convert(varchar(4),datepart(Year,@beginFiscal)) + case when len(convert(varchar(2),datepart(Month,dateadd(mm,3,@beginFiscal)))) = 1 then convert(varchar(2),'0' + convert(varchar(2),datepart(Month,dateadd(mm,3,@beginFiscal)))) else convert(varchar(2),datepart(Month,dateadd(mm,3,@beginFiscal))) end set @month05 = convert(varchar(4),datepart(Year,@beginFiscal)) + case when len(convert(varchar(2),datepart(Month,dateadd(mm,4,@beginFiscal)))) = 1 then convert(varchar(2),'0' + convert(varchar(2),datepart(Month,dateadd(mm,4,@beginFiscal)))) else convert(varchar(2),datepart(Month,dateadd(mm,4,@beginFiscal))) end set @month06 = convert(varchar(4),datepart(Year,@beginFiscal)) + case when len(convert(varchar(2),datepart(Month,dateadd(mm,5,@beginFiscal)))) = 1 then convert(varchar(2),'0' + convert(varchar(2),datepart(Month,dateadd(mm,5,@beginFiscal)))) else convert(varchar(2),datepart(Month,dateadd(mm,5,@beginFiscal))) end set @month07 = convert(varchar(4),datepart(Year,@endFiscal)) + case when len(convert(varchar(2),datepart(Month,dateadd(mm,-5,@endFiscal)))) = 1 then convert(varchar(2),'0' + convert(varchar(2),datepart(Month,dateadd(mm,-5,@endFiscal)))) else convert(varchar(2),datepart(Month,dateadd(mm,-5,@endFiscal))) end set @month08 = convert(varchar(4),datepart(Year,@endFiscal)) + case when len(convert(varchar(2),datepart(Month,dateadd(mm,-4,@endFiscal)))) = 1 then convert(varchar(2),'0' + convert(varchar(2),datepart(Month,dateadd(mm,-4,@endFiscal)))) else convert(varchar(2),datepart(Month,dateadd(mm,-4,@endFiscal))) end set @month09 = convert(varchar(4),datepart(Year,@endFiscal)) + case when len(convert(varchar(2),datepart(Month,dateadd(mm,-3,@endFiscal)))) = 1 then convert(varchar(2),'0' + convert(varchar(2),datepart(Month,dateadd(mm,-3,@endFiscal)))) else convert(varchar(2),datepart(Month,dateadd(mm,-3,@endFiscal))) end set @month10 = convert(varchar(4),datepart(Year,@endFiscal)) + case when len(convert(varchar(2),datepart(Month,dateadd(mm,-2,@endFiscal)))) = 1 then convert(varchar(2),'0' + convert(varchar(2),datepart(Month,dateadd(mm,-2,@endFiscal)))) else convert(varchar(2),datepart(Month,dateadd(mm,-2,@endFiscal))) end set @month11 = convert(varchar(4),datepart(Year,@endFiscal)) + case when len(convert(varchar(2),datepart(Month,dateadd(mm,-1,@endFiscal)))) = 1 then convert(varchar(2),'0' + convert(varchar(2),datepart(Month,dateadd(mm,-1,@endFiscal)))) else convert(varchar(2),datepart(Month,dateadd(mm,-1,@endFiscal))) end set @month12 = convert(varchar(4),datepart(Year,@endFiscal)) + case when len(convert(varchar(2),datepart(Month,dateadd(mm,0,@endFiscal)))) = 1 then convert(varchar(2),'0' + convert(varchar(2),datepart(Month,dateadd(mm, 0,@endFiscal)))) else convert(varchar(2),datepart(Month,dateadd(mm,0,@endFiscal))) end select sum(Revenue) as Revenue,Yearmth into #rawdata1 from [dbo].[AggregatesAndTotals] where [Orderdate] between @beginFiscal and @endFiscal group by yearmth order by yearmth DECLARE @Revenue TABLE (Revenue decimal(15,2),Cumulative decimal(15,2), YearMth varchar(6)) DECLARE @SolutionsArea Varchar(100), @YearMth Varchar(6), @Revenue1 decimal(15,2), @Cumulative decimal(15,2) Set @Cumulative = 0 DECLARE rt_cursor CURSOR FOR Select Revenue, YearMth from #rawdata1 Order By YearMTH OPEN rt_cursor FETCH NEXT FROM rt_cursor INTO @Revenue1,@YearMth WHILE @@FETCH_STATUS = 0 BEGIN begin Set @Cumulative = @Cumulative + @Revenue1 INSERT @Revenue VALUES (@Revenue1,@Cumulative,@YearMTH) end FETCH NEXT FROM rt_cursor INTO @Revenue1,@YearMth END CLOSE rt_cursor DEALLOCATE rt_cursor SELECT * Into #rawdata2 FROM @Revenue Declare @NSQL nvarchar(2000) set @Nsql = ' select name, [' + @month01+ '],[' + @month02+ '],[' +@month03+ '],[' +@month04+ '],[' +@month05 +'],[' + @month06+ '],[' +@month07+ '],[' +@month08+ '],[' +@month09+ '],[' +@month10+ '],[' + @month11+ '],[' +@month12 + '] from ' + ' ( ' + ' select Yearmth, name, value ' + ' from #rawdata2 ' + ' unpivot ' + ' ( ' + ' value for name in ([Revenue],[Cumulative]) ' + --Ensure the [Revenue], {Cumulative] etc. are of the same data format or you will generate a run --time error (see above) ' ) unpiv '+ ' ) src ' + ' pivot ' + ' ( ' + ' sum(value) ' + ' for YearMth in ([' + @month01+ '],[' + @month02+ '],[' +@month03+ '],[' +@month04+ '],[' +@month05 +'],[' + @month06+ '],[' +@month07+ '],[' +@month08+ '],[' +@month09+ '],[' +@month10+ '],[' + @month11+ '],[' +@month12 +'] )) piv ' + ' order by name asc ' CREATE TABLE #rawdata55( [name] [varchar](75) NULL, [Month01] [decimal](15, 2) NULL, [Month02] [decimal](15, 2) NULL, [Month03] [decimal](15, 2) NULL, [Month04] [decimal](15, 2) NULL, [Month05] [decimal](15, 2) NULL, [Month06] [decimal](15, 2) NULL, [Month07] [decimal](15, 2) NULL, [Month08] [decimal](15, 2) NULL, [Month09] [decimal](15, 2) NULL, [Month10] [decimal](15, 2) NULL, [Month11] [decimal](15, 2) NULL, [Month12] [decimal](15, 2) NULL ) insert #rawdata55 exec sp_executesql @NSQL with recompile select * from #rawdata55 order by name desc |
Steve has presented papers at 8 PASS Summits and one at PASS Europe 2009 and 2010. He has recently presented a Master Data Services presentation at the PASS Amsterdam Rally.
Steve has presented 5 papers at the Information Builders' Summits. He is a PASS regional mentor.
View all posts by Steve Simon
- Reporting in SQL Server – Using calculated Expressions within reports - December 19, 2016
- How to use Expressions within SQL Server Reporting Services to create efficient reports - December 9, 2016
- How to use SQL Server Data Quality Services to ensure the correct aggregation of data - November 9, 2016