
Introduction
With Christmas just around the corner, in today’s “get together” I thought that we would have some fun by cataloging a collection of ‘your favorite items’. Whether it be a coin collection, a china plate collection or a stamp collection, the process is the same and certainly something that you will enjoy creating and maintaining. For today’s example, we are going to construct a “Postage Stamp” cataloging system. We are going to see how we are able to get from this…
to this..
Let’s get started.
Initial Preparation
Before we commence, we really need a few images of the stamps that we wish to catalog. These images are readily available on the internet. Obviously, it would be nice to give credit to the source.

Getting Started
There is an old adage that “what one extracts is dependent upon what went in”.
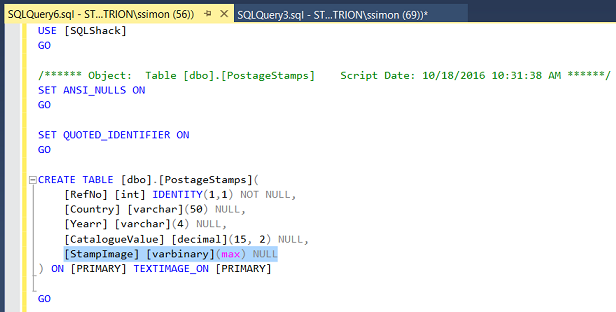
Our first task is to insert our data into our SQLShack database.

We begin by creating a table called “PostageStamps”. The astute reader will note that the image field has been defined as varbinary(max). Other fields include the country of issue (Country), the year that the stamp was issued (Yearr), the current catalog value (CatalogueValue) and last but not least, an identity field (RefNo), which we shall use as a grouping and sorting field within our reporting.
Inserting our raw data
For the sake of simplicity, I created a few lines of T-SQL code which will be utilized to insert our raw data (see below).
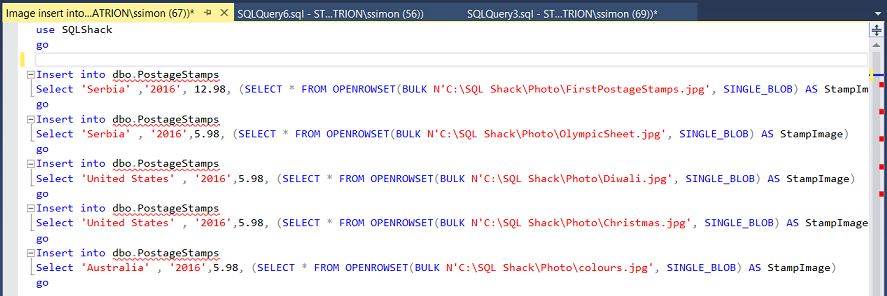
The code snippet may be found in Addenda 1.
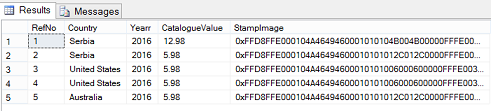
Having executed this code snippet, let us now have a look at the inserted data.
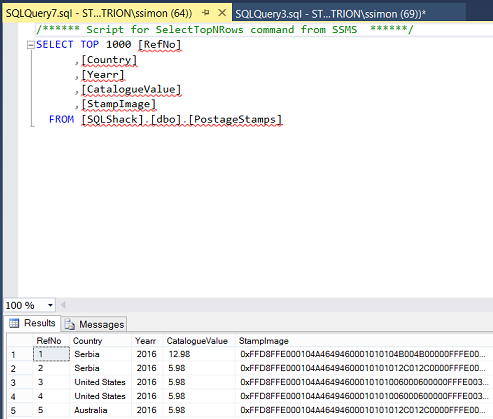
The screen shot above shows the data that we have just inserted. The reader will note that the BLOB related data is not really that “understandable”. This is to be expected due to the nature of the data type.
Creating our report query
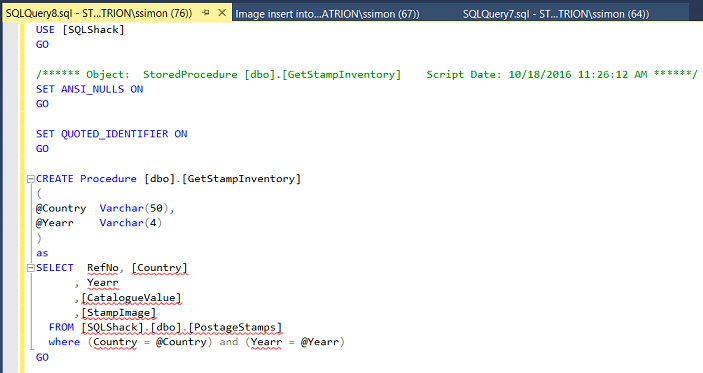
Now that our raw data is present within the “PostageStamps” table, we really must create a stored procedure that will be utilized to extract the necessary data for our reporting. Further, we want to add a simple predicate to the code that will permit the end user to pass the year and the country name of the stamps that he or she wishes to view (see above). The code snippet may be seen in Addenda 2
Now that we have the necessary data (within the SQL Shack database) and now that we have an extract query for our reporting, let us construct a report that we may use on a daily basis to view the contents of our collection.
Creating our report
We begin by bringing up Visual Studio 2015 or SQL Server Data Tools 2010 or greater.
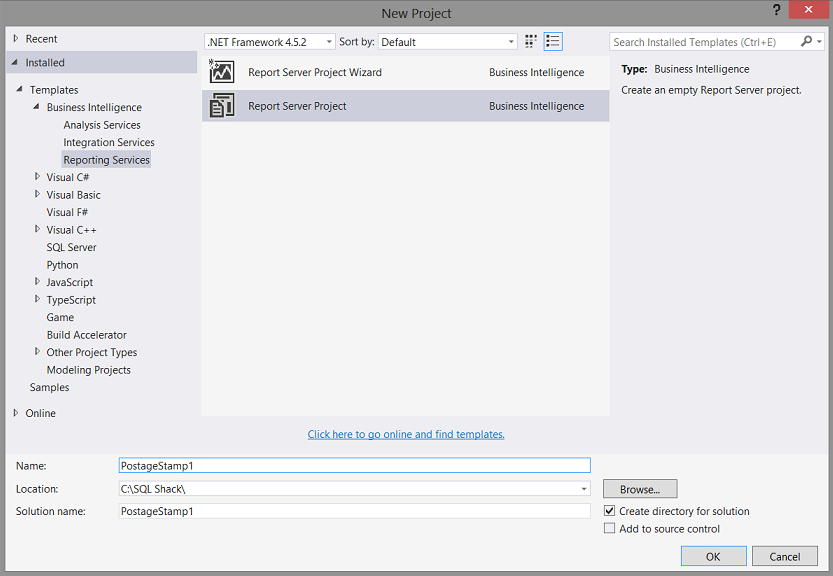
We create a new “New Report Server” project and give it the name “PostageStamp1”. We click “OK” to create the project (see above).
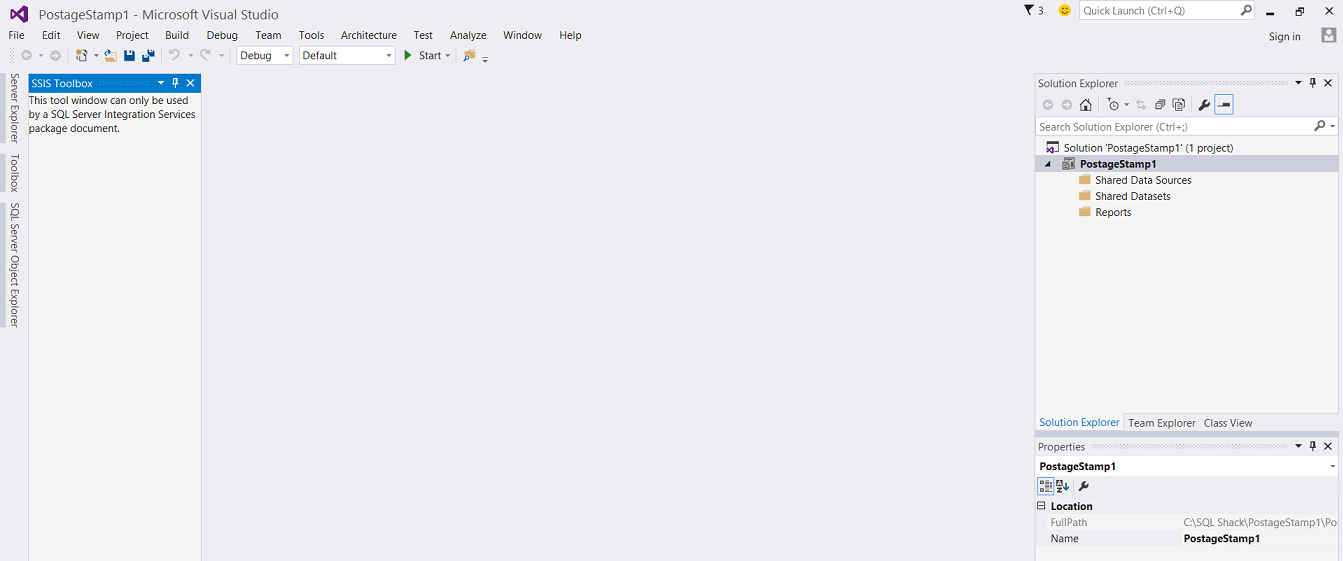
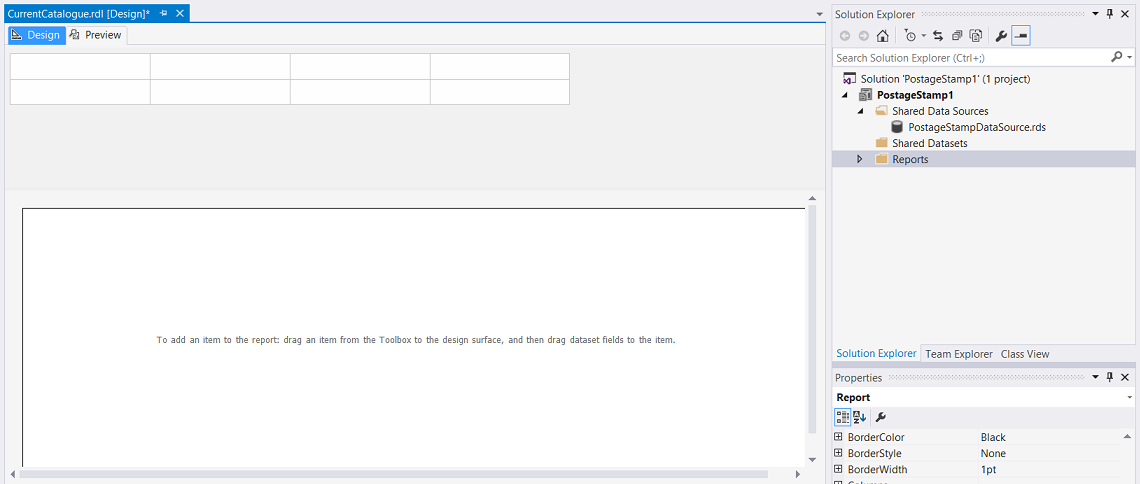
We find ourselves on our design surface.
Creating a connection to the SQL Shack database
Should you be unfamiliar with the process of connecting to a database via SQL Server Reporting Services, please do a look at a SQL Shack article entitled “Now you see it, Now you don’t” where the process is described in detail. The link to this article may be seen here.
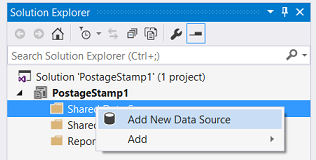
To create a connection to the SQLShack database, we right click on the “Shared Data Sources” tab and select “Add New Data Source” (see above).
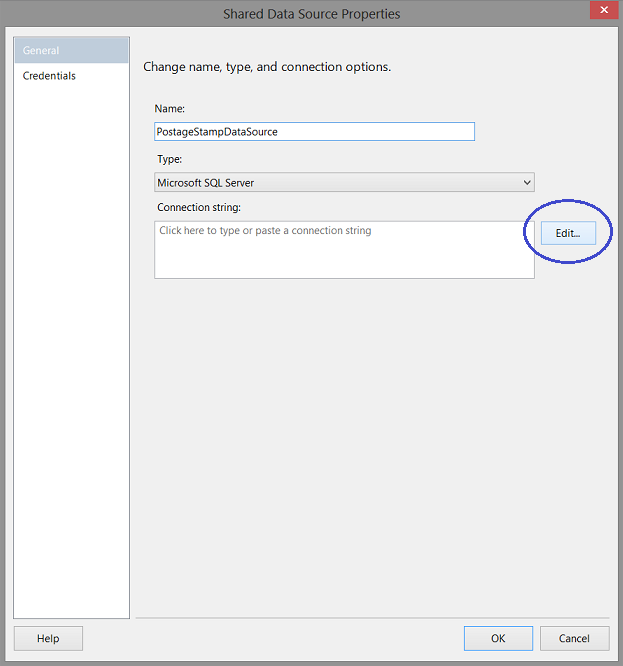
We give our proposed data source a name and click the “Edit” button to create the connection string (see above).
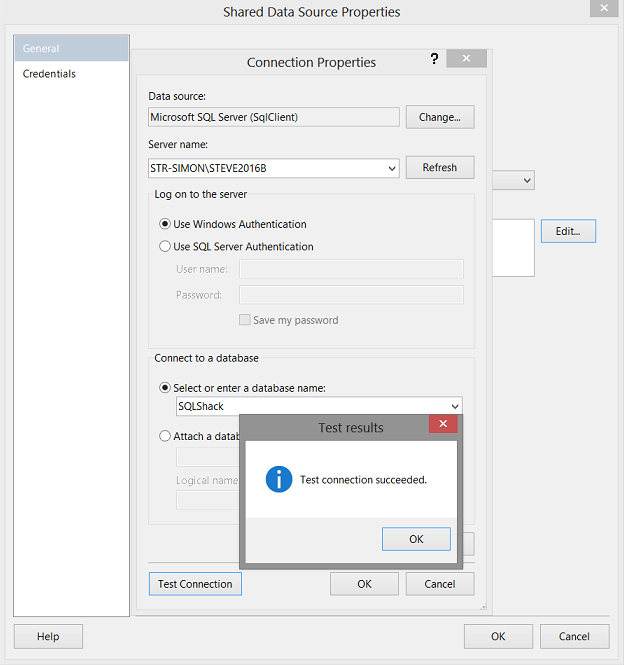
The “Connection Properties” dialogue box opens. We set the server name and select the “SQLShack” database. Next we test our connection (see above). We click “OK” and “OK” to leave the “Shared Data Source Properties” dialogue box.
Creating a new report
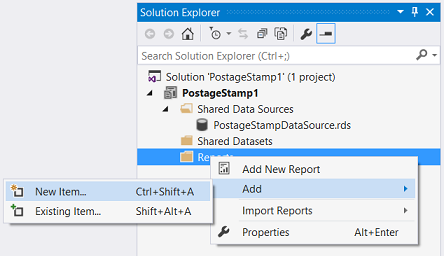
In order to correctly view and evaluate the data within our postage stamp table, we must create a new report. We right click on the “Reports” folder. The “Reports” context menu is brought into view (see above). We select “Add” and “New Item”.
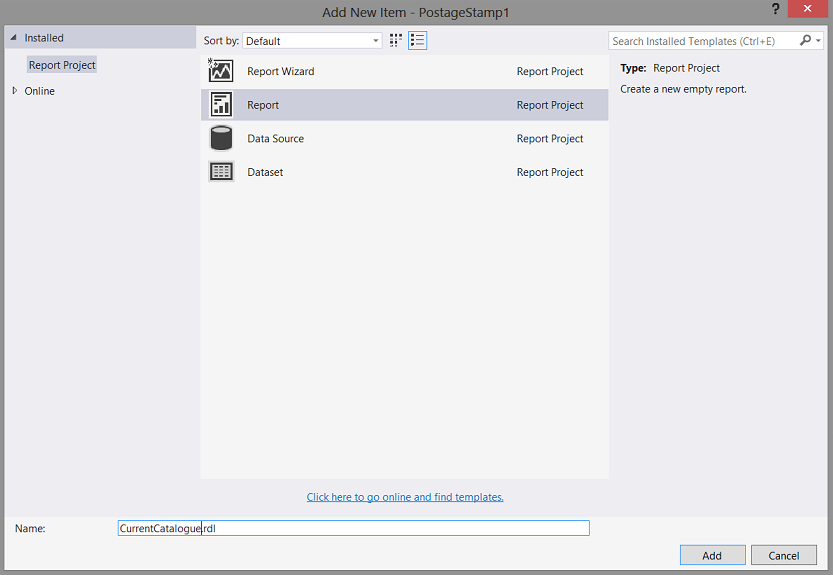
We select the “Report” option and give our proposed report the name “CurrentCatalogue” (see above). We click the “Add” button and we are returned to our design surface (see below).
As the report query expects the end user to pass through a country name and a year, we must create two dataset. The first will contain a complete list of the distinct countries within the “PostageStamps” table and the other, a complete list of distinct “years” that currently exist within the same table. The arguments selected by the user will then be passed to the query / stored procedure.
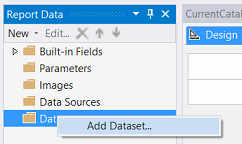
We right click on the “Datasets” folder. The “DataSets” context menu is brought into view. We select “Add Dataset” (see above).
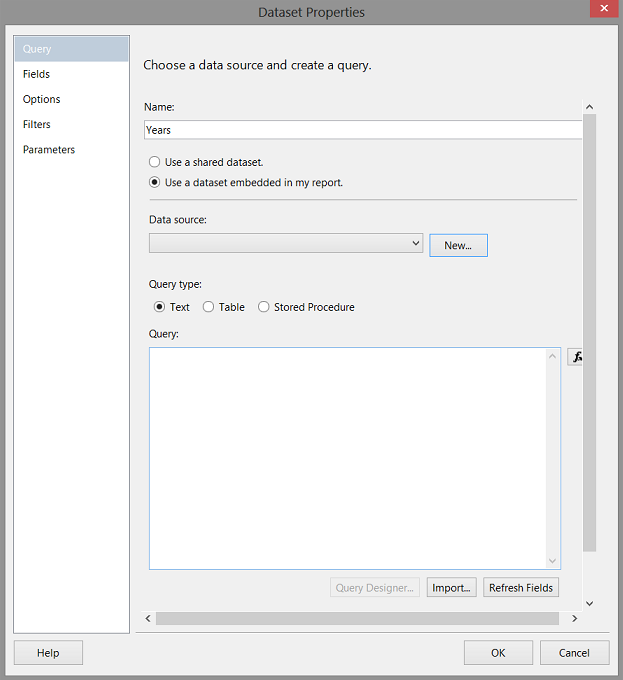
The “Dataset Properties” dialogue box opens. We give our dataset the name “Years”. The values with in this new dataset “Years” will be utilized to provide to the user when he or she selects the “stamp year” to view. We click the “New” button to create a new local data source. This local data source will utilize the shared data source that we recently created. As I have mentioned in past “get togethers”, having a local dataset source is advantageous as it permits report specific customization.
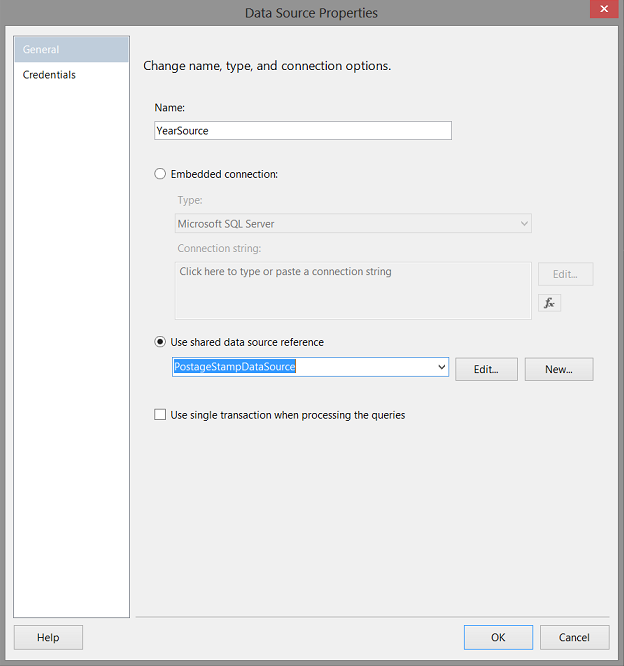
The “Data Source Properties” dialogue box opens. We give our local data source the name “YearSource” and point it to the shared data source “PostageStampDataSource” (see above). We click “OK” to continue.
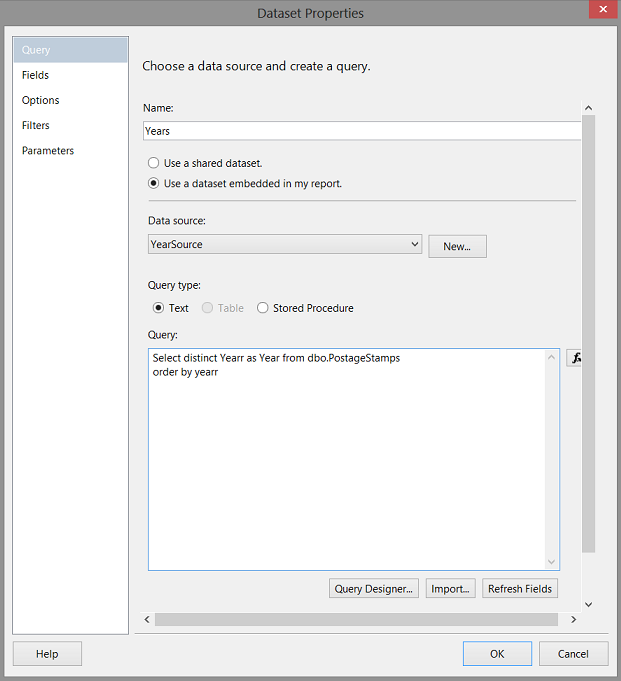
We opt for “Text” as the “Query type” and enter our T-SQL query (see above). Having done this we click the “Refresh Fields” Option to inform the system which database table fields will be returned by the query (see below).
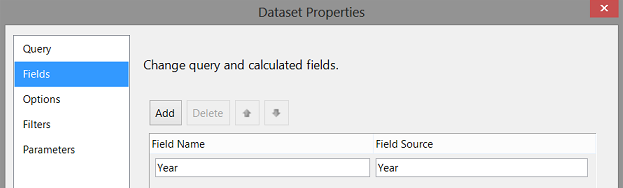
We click “OK” to leave the “Dataset Properties” dialogue box.

We note that our “Years” dataset has been created. In a similar fashion, we create a local dataset for the unique countries that we have within our database table.
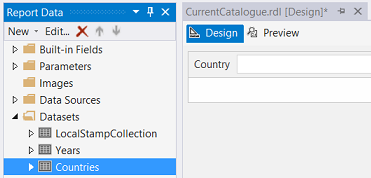
Both datasets may be seen above.
Creating the necessary parameters
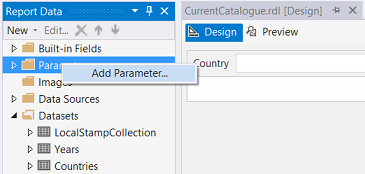
At this point, we must create two parameters which will permit the user a choice of years and countries with which to work. We right click on the “Parameters” folder and select “Add Parameter” (see above).
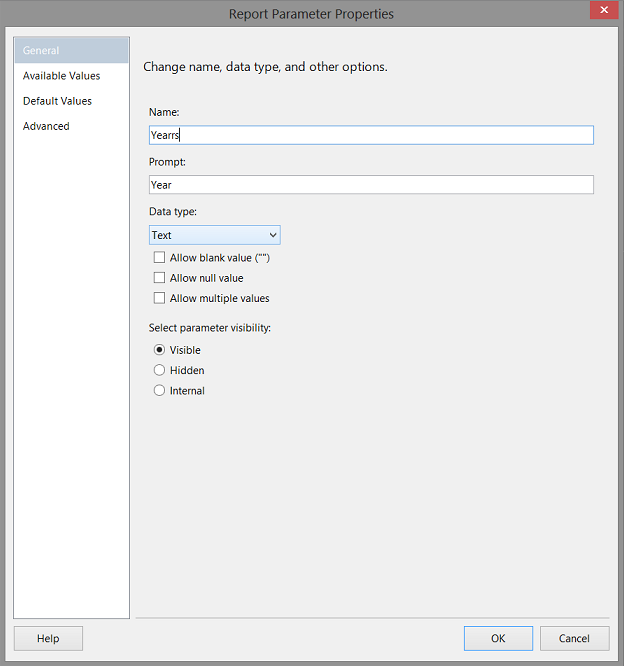
The “Report Parameter Properties” dialogue box is brought into view. We give our new property a name and title (see above).
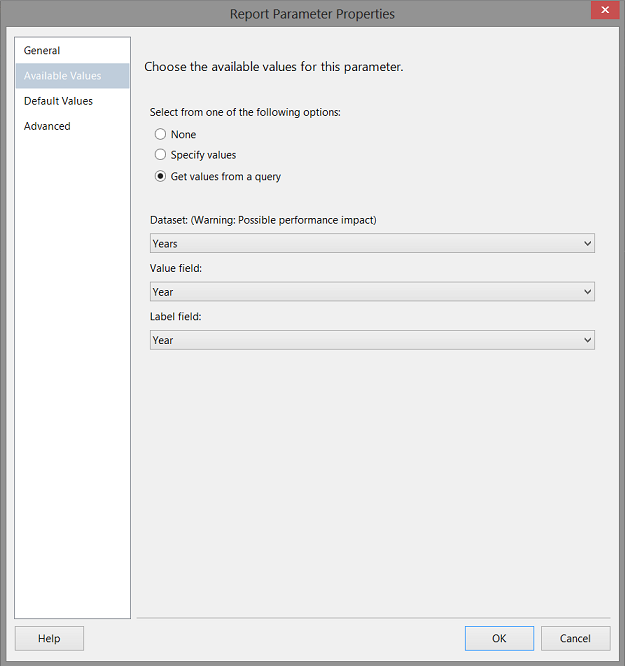
Clicking on the “Available Values” tab, we select “Get values from a query” and set the dataset to “Years” (this is the dataset that we just created). We click “OK” to continue (see above).
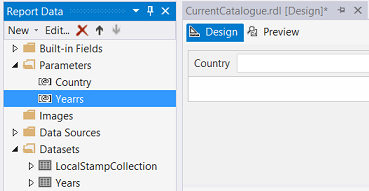
We note our completed “Yearrs” parameter above. In a similar fashion we create the “Country” parameter and connect it to the “Countries” dataset (see above).
Creating the MAIN dataset
Our last dataset related task is to create the main dataset which will contain all of the necessary stamp related data.
Once again we right click upon the “Datasets” folder.
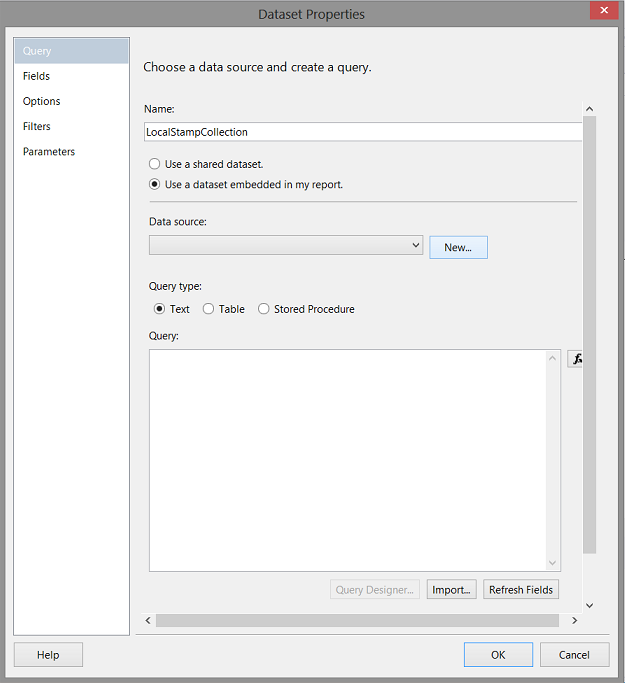
The “Dataset Properties” dialogue box opens. We give our dataset a name and click the “New” button to create a local data source. This local data source will utilize the shared data source that we recently created. As mentioned above, having a local dataset source is advantageous as it permits report specific customization.

The “Data Source Properties” dialogue box is brought into view. We give our local data source the name “LocalStampDataSource” and indicate to the system that we wish to utilize and connect to the database via the Shared Data Source “PostageStampDataSource” (see above). We click “OK” to continue.

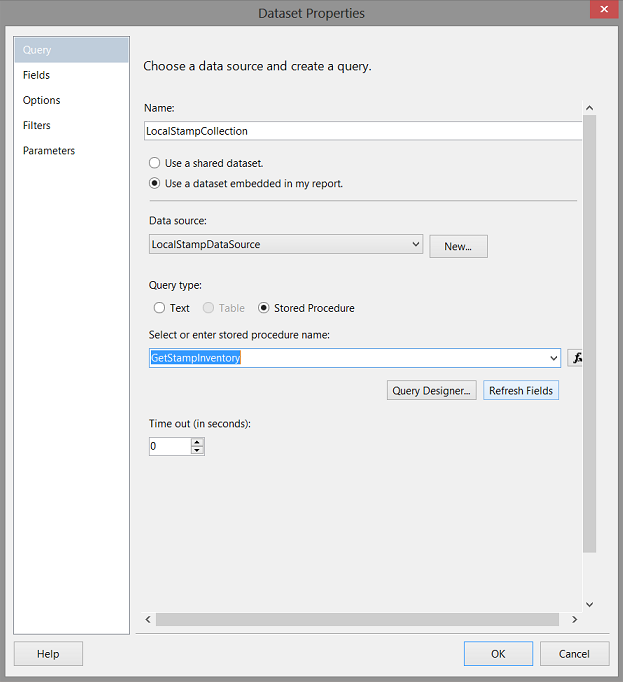
We are returned to the “Dataset Properties” dialogue box. We select “Stored Procedure” for the “Query type” and we select the Stored Procedure “GetStampInventory” (which we created above). We click “OK” to continue (see above).
Our next task is to inform the system which fields will be contained within the query data. We click “Refresh Fields” (see above).
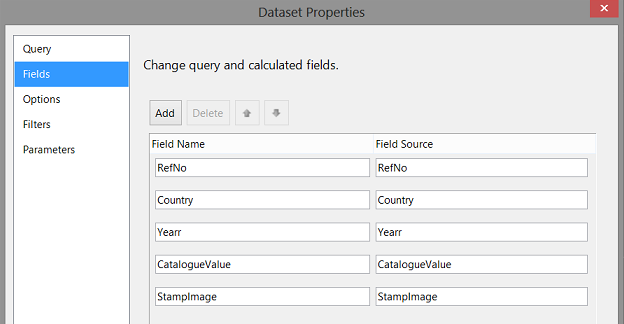
The fields within the dataset may be seen above.
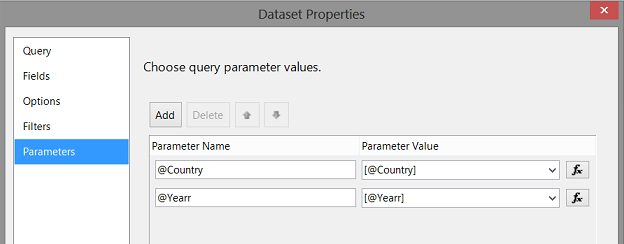
Our last task is to link the dataset to the parameters “year” and “country”. We click on the “Parameters” tab and we note that both parameters appear (see above). The “Parameter Name” refers to the actual parameters that we just created and the “Parameter Value” will be set at the run time when the user selects a year and country. It is these argument values that will be passed to our stored procedure.
We click “OK” to close the “Dataset Properties” dialogue box.
Adding our report controls
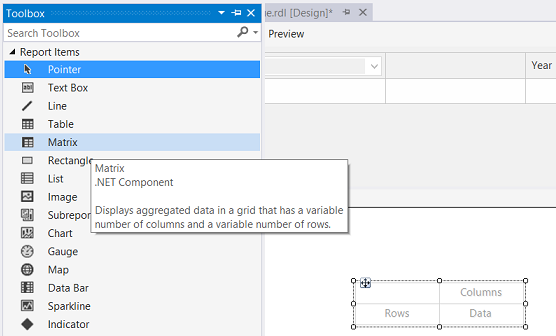
Having constructed the data extract apparatus, we are now in the position to add report controls to our drawing surface. We drag a “Matrix” from the tool box on to our drawing surface (see above)
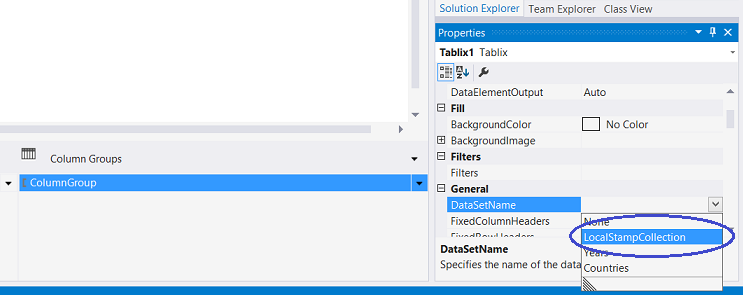
Highlighting the “Matrix” (see above) we open the “Matrix / Tablix” properties box. We set the “DataSetName” Property to the “LocalStampCollection” dataset that we just created (see above).
Adjusting the Column Grouping
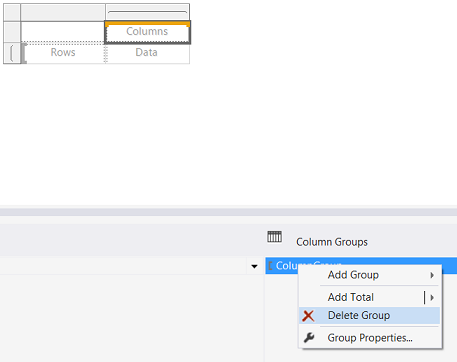
This completed, our next task is to remove the matrix column grouping as we shall NOT be utilizing it. We right click on the “ColumnGroup” tab (see above) and select “Delete Group”.
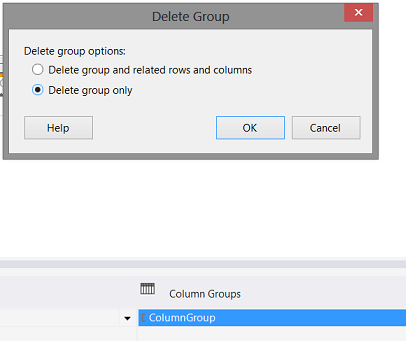
We are asked if we wish to delete the group AND the data or just the “grouping”. We select “Delete group only” (see above). We click “OK” to continue.
Adjusting the Row Grouping
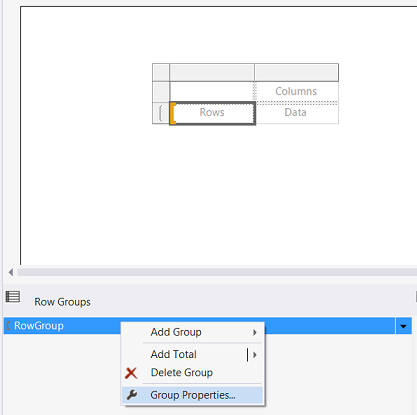
We must now set our row grouping. We right click upon the “RowGroup” and select “Group Properties” (see below).
The “Group Properties” dialogue box opens.
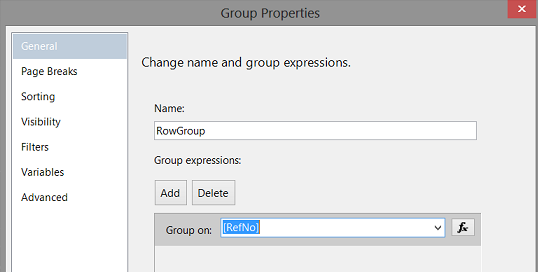
We set the “grouping” at an individual record level as we really wish to see each and every stamp entry that satisfies our selection criteria and NOT a summary figure. By doing it this way, the identity field may be utilized for “grouping” in addition to “sorting”. The grouping may be seen above.
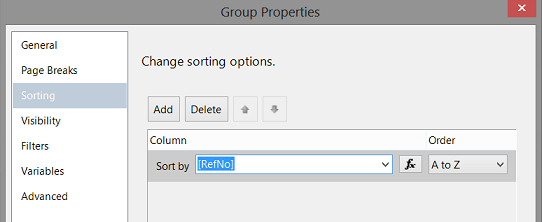
The sorting may be seen above.
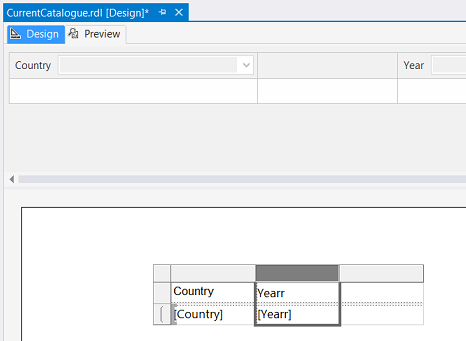
Our final task is to populate the matrix. We first add the country and then the Year (see above).
We must now perform a bit of “magic”, to ensure that the images of the stamps are displayed correctly.
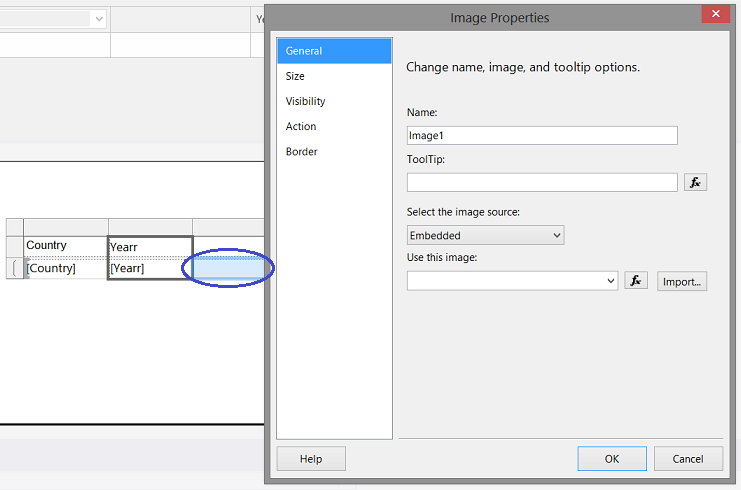
We add an image control to the cell in blue (see above).
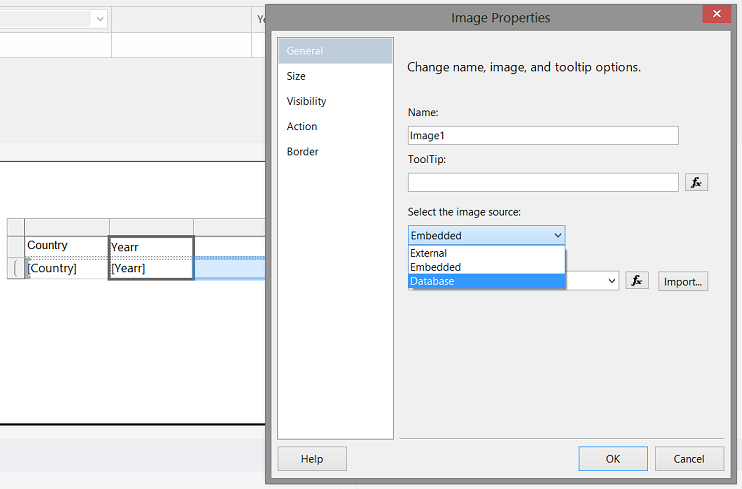
We set the “Select the image source” property to “Database” (see above).
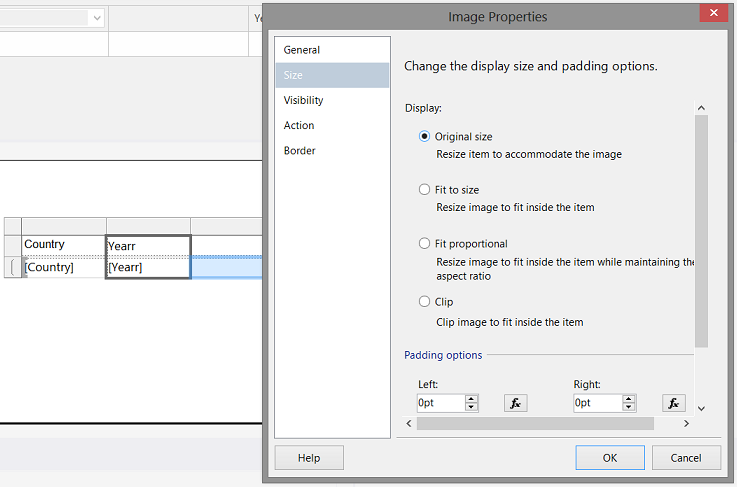
Clicking upon the “Size” tab, we set the display to “Original size” (see above).

Back in the “General” tab, we set the “Use this field” to “StampImage” and the “Use this MIME type to “Image/jpeg” (see above).
We have one last task and that is to add the “CatalogueValue” field.
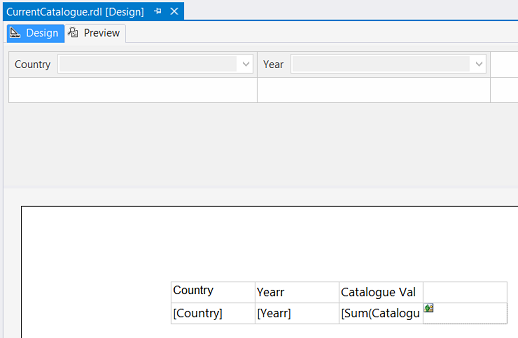
The completed matrix may be seen above.
Believe it or not, we are now done!!!
Let us give have a look at our report!!
Running our report
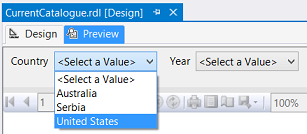
Clicking upon the “Preview” tab, our report now appears. We select a country (see above) and
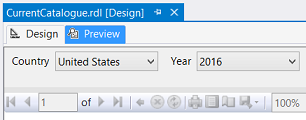
and we select a “Year” (see above).
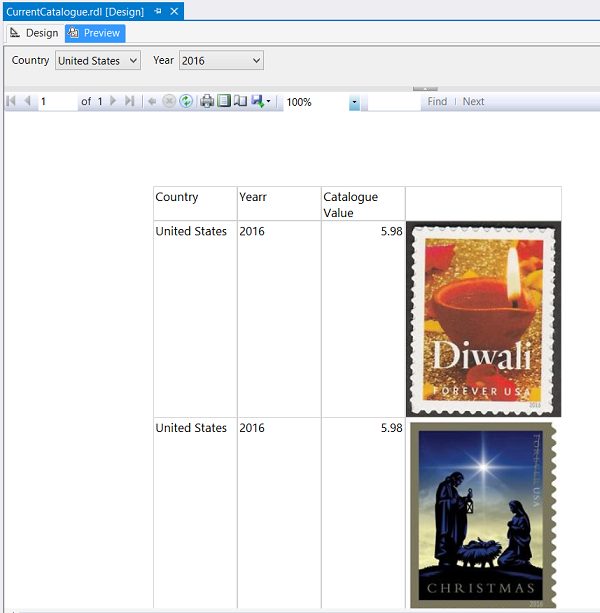
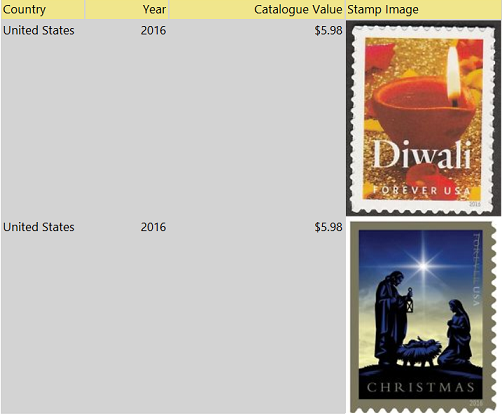
Clicking the “View Report” button our report appears.
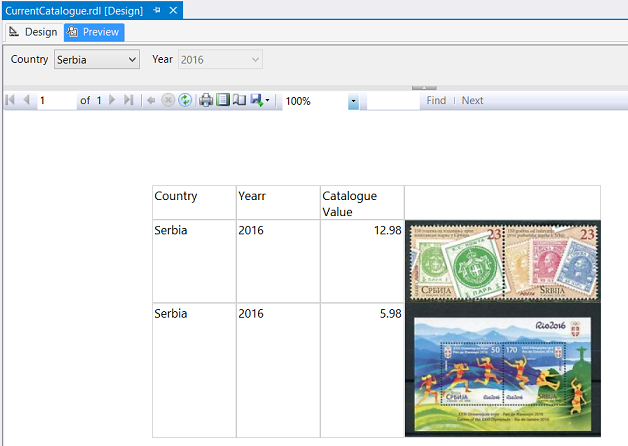
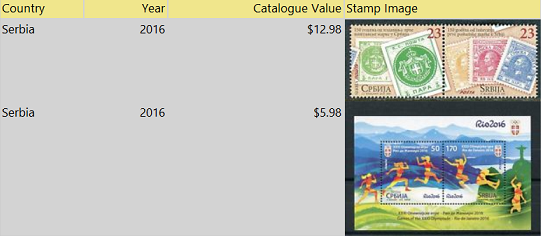
Should we choose “Serbia” and the same year, the following data is displayed.
Conclusions
Images form a vital part in reporting; be it for business purposes or for recreational purposes. Images help describe what we sell and why people should purchase from us. While we attacked this “fire side chat” from a stamp collection point of view, the same techniques may be applied to a corporate product catalog. I sincerely hope that you will try this nifty technique and construct a model that suits your needs.
Until the next time, happy programming!
Addenda 1
|
1 2 3 4 5 6 7 8 9 10 11 12 13 14 15 16 17 18 19 20 |
use SQLShack go Insert into dbo.PostageStamps Select 'Serbia' ,'2016', 12.98, (SELECT * FROM OPENROWSET(BULK N'C:\SQL Shack\Photo\FirstPostageStamps.jpg', SINGLE_BLOB) AS StampImage) go Insert into dbo.PostageStamps Select 'Serbia' , '2016',5.98, (SELECT * FROM OPENROWSET(BULK N'C:\SQL Shack\Photo\OlympicSheet.jpg', SINGLE_BLOB) AS StampImage) go Insert into dbo.PostageStamps Select 'United States' , '2016',5.98, (SELECT * FROM OPENROWSET(BULK N'C:\SQL Shack\Photo\Diwali.jpg', SINGLE_BLOB) AS StampImage) go Insert into dbo.PostageStamps Select 'United States' , '2016',5.98, (SELECT * FROM OPENROWSET(BULK N'C:\SQL Shack\Photo\Christmas.jpg', SINGLE_BLOB) AS StampImage) go Insert into dbo.PostageStamps Select 'Australia' , '2016',5.98, (SELECT * FROM OPENROWSET(BULK N'C:\SQL Shack\Photo\colours.jpg', SINGLE_BLOB) AS StampImage) Go |
Addenda 2
|
1 2 3 4 5 6 7 8 9 10 11 12 13 14 15 16 17 18 19 20 21 22 23 24 25 |
USE [SQLShack] GO /****** Object: StoredProcedure [dbo].[GetStampInventory] Script Date: 10/18/2016 11:26:12 AM ******/ SET ANSI_NULLS ON GO SET QUOTED_IDENTIFIER ON GO CREATE Procedure [dbo].[GetStampInventory] ( @Country Varchar(50), @Yearr Varchar(4) ) as SELECT RefNo, [Country] , Yearr ,[CatalogueValue] ,[StampImage] FROM [SQLShack].[dbo].[PostageStamps] where (Country = @Country) and (Yearr = @Yearr) GO |
References
- OPENQUERY (Transact-SQL)
- Storing Images and Photos in SQL Server
- Add a Background Image (Report Builder and SSRS)
Steve has presented papers at 8 PASS Summits and one at PASS Europe 2009 and 2010. He has recently presented a Master Data Services presentation at the PASS Amsterdam Rally.
Steve has presented 5 papers at the Information Builders' Summits. He is a PASS regional mentor.
View all posts by Steve Simon
- Reporting in SQL Server – Using calculated Expressions within reports - December 19, 2016
- How to use Expressions within SQL Server Reporting Services to create efficient reports - December 9, 2016
- How to use SQL Server Data Quality Services to ensure the correct aggregation of data - November 9, 2016