
Why is my database so slow? This query used to be so much faster. Why does it take so long to rebuild my index? How come it was fine last month? Every day I am asked these types of questions by clients. Every day! A lot of database developers and application developers do not realize that indexes are ever changing entities within your database or rather they need to be monitored closely and managed periodically to remain efficient. I cannot even count the times someone tells me “but we have index’s on this or that column and it was fine last month” and so on. All while they fail to realize or even tell me that the database just took on, updated or deleted 1,000,000 records for example, which would definitely change the footprint of the data, making the index’s unsound or in need of help. Even adding 50 new users that use the data differently could require new indexes. That being said, I decided to automate a quick and easy data gathering and reporting job that helps to answer these questions. Most of the time query performance questions can be answered by determining the fragmentation levels of index’s, if there are missing index’s, duplicate index’s, unused index’s and what are the heavy hitters in regards to queries and are queries running in memory or to disk and how many executions. My favorite thing to do with SQL Server is automate, automate and automate the tasks that are asked of me over and over.
This simple job includes 9 tables used for collecting data, 7 reports, and one SQL agent job to tie it all together and do a cleanup step and finally kick off the tasks. Steps 1-5 below will show how to individually set up the job however, you can also just run “scripts 1-setup tables.sql” and “2-sgent job.sql” that are included here, however, make sure you update the variables with your information prior to running.
Prerequisites:
- I have created a small database on each server that I monitor called DBA_Monitoring, this is where I do most of my DBA tasks. This is optional of course; I like to keep my dba monitoring separate from other production databases. You can call yours whatever you like just be sure to change it in the scripts provided before you run them.
- You must have dbMail enabled on your server that you will be monitoring and note your mail profile name as this will be used to send reports via email.
Creating the Collection Package
Step 1: Create the tables
I have created 9 tables in DBA_Monitoring to house each type of data collected in this job. 7 are for data collection and 2 are staging tables. These will need to be generated only once and will be truncated between data collection runs. Copy / Paste the scripts below and run them in your DBA_Monitoring database.
|
1 2 3 4 5 6 7 8 9 10 11 12 13 14 15 16 17 18 19 20 21 22 23 24 25 26 27 28 29 30 31 32 33 34 35 36 37 38 39 40 41 42 43 44 45 46 47 48 49 50 51 52 53 54 55 56 57 58 59 60 61 62 63 64 65 66 67 68 69 70 71 72 73 74 75 76 77 78 79 80 81 82 83 84 85 86 87 88 89 90 91 92 93 94 95 96 97 98 99 100 101 102 103 104 105 106 107 108 109 110 111 112 113 114 115 116 117 118 119 120 121 122 123 124 125 126 127 128 129 130 131 132 133 134 135 |
--Create the tables USE [DBA_Monitoring] GO -- used to collect the first round of index read counts CREATE TABLE [dbo].[IndexOverviewReadsWithCounts_stage]( [ServerName] [nvarchar](128) NULL, [Database] [nvarchar](128) NULL, [Object] [nvarchar](128) NULL, [execution_count] [bigint] NOT NULL, [total_logical_reads] [bigint] NOT NULL, [total_physical_reads] [bigint] NOT NULL ) ON [PRIMARY] GO --used to collect the first round of index read counts and queries CREATE TABLE [dbo].[IndexOverviewReadsWithQuery_stage]( [ServerName] [nvarchar](128) NULL, [Database] [nvarchar](128) NULL, [Object] [nvarchar](128) NULL, [execution_count] [bigint] NOT NULL, [total_logical_reads] [bigint] NOT NULL, [total_physical_reads] [bigint] NOT NULL, [Statement] [nvarchar](max) NULL ) ON [PRIMARY] TEXTIMAGE_ON [PRIMARY] GO --used as final index reads with counts where database name is updated to the monitored database CREATE TABLE [dbo].[IndexOverviewReadsWithCounts]( [ServerName] [nvarchar](128) NULL, [Database] [nvarchar](128) NULL, [Object] [nvarchar](128) NULL, [execution_count] [bigint] NOT NULL, [total_logical_reads] [bigint] NOT NULL, [total_physical_reads] [bigint] NOT NULL ) ON [PRIMARY] GO ----used as final index reads with statements where database name is updated to the monitored database CREATE TABLE [dbo].[IndexOverviewReadsWithQuery]( [ServerName] [nvarchar](128) NULL, [Database] [nvarchar](128) NULL, [Object] [nvarchar](128) NULL, [execution_count] [bigint] NOT NULL, [total_logical_reads] [bigint] NOT NULL, [total_physical_reads] [bigint] NOT NULL, [Statement] [nvarchar](max) NULL ) ON [PRIMARY] TEXTIMAGE_ON [PRIMARY] GO --used to collect duplicate index CREATE TABLE [dbo].[IndexOverview_DuplicateIndex]( [ServerName] [nvarchar](128) NULL, [DBName] [varchar](100) NOT NULL, [TableName] [sysname] NOT NULL, [IndexName] [sysname] NULL, [OverLappingIndex] [sysname] NULL, [Col1] [nvarchar](128) NULL, [Col2] [nvarchar](128) NULL, [Col3] [nvarchar](128) NULL, [Col4] [nvarchar](128) NULL, [Col5] [nvarchar](128) NULL, [Col6] [nvarchar](128) NULL, [Col7] [nvarchar](128) NULL, [Col8] [nvarchar](128) NULL, [Col9] [nvarchar](128) NULL, [Col10] [nvarchar](128) NULL, [Col11] [nvarchar](128) NULL, [Col12] [nvarchar](128) NULL, [Col13] [nvarchar](128) NULL, [Col14] [nvarchar](128) NULL, [Col15] [nvarchar](128) NULL, [Col16] [nvarchar](128) NULL ) ON [PRIMARY] GO --used to collect fragmentation levels CREATE TABLE [dbo].[IndexOverview_FragLevels]( [ServerName] [nvarchar](128) NULL, [DBName] [varchar](100) NOT NULL, [Table] [sysname] NOT NULL, [Index] [sysname] NULL, [avg_fragmentation_in_percent] [float] NULL, [page_count] [bigint] NULL ) ON [PRIMARY] GO --used to collect the most expensive and longest running queries CREATE TABLE [dbo].[IndexOverview_LongestQueries]( [ServerName] [nvarchar](128) NULL, [DBName] [varchar](100) NOT NULL, [QueryName] [nvarchar](max) NULL, [ExecutionCount] [bigint] NOT NULL, [MaxElapsedTime] [bigint] NOT NULL, [AvgElapsedTime] [bigint] NOT NULL, [LogCreatedOn] [datetime] NOT NULL ) ON [PRIMARY] TEXTIMAGE_ON [PRIMARY] GO --used to collect missing index information CREATE TABLE [dbo].[IndexOverview_MissingIndex]( [ServerName] [nvarchar](128) NULL, [DBName] [varchar](100) NOT NULL, [DatabaseID] [smallint] NOT NULL, [Avg_Estimated_Impact] [float] NULL, [Last_User_Seek] [datetime] NULL, [TableName] [nvarchar](128) NULL, [Create_Statement] [nvarchar](4000) NULL ) ON [PRIMARY] GO --used to collect unused index information CREATE TABLE [dbo].[IndexOverview_UnusedIndex]( [ServerName] [nvarchar](128) NULL, [DBName] [varchar](100) NOT NULL, [ObjectName] [sysname] NOT NULL, [IndexName] [sysname] NULL, [IndexID] [int] NOT NULL, [UserSeek] [bigint] NOT NULL, [UserScans] [bigint] NOT NULL, [UserLookups] [bigint] NOT NULL, [UserUpdates] [bigint] NOT NULL, [TableRows] [bigint] NULL, [drop statement] [nvarchar](790) NULL ) ON [PRIMARY] go |
Step 2: Collect the data
This step will collect data into the tables created in step 1 above. The queries here use data from SQL Server Dynamic Management Views (DMV), so data is only current between server restarts. Because of this, it is a good idea to know when the last server restart was. In my case, restarts for database servers is usually my responsibility or I am in touch with the server guys to verify the last server reboot. This ensures that I have enough data in the DMV’s that my reports are useful. Make sure you change the variables marked with <> throughout the scripts prior to running. In addition to this, some of the queries contain a threshold for the amount of rows to bring back, so do not forget to modify this to your needs as well. Copy/Paste the scripts below to collect data.
|
1 2 3 4 5 6 7 8 9 10 11 12 13 14 15 16 17 18 19 20 21 22 23 24 25 26 27 28 29 30 31 32 33 34 35 36 37 38 39 40 41 42 43 44 45 46 47 48 49 50 51 52 53 54 55 56 57 58 59 60 61 62 63 64 65 66 67 68 69 70 71 72 73 74 75 76 77 78 79 80 81 82 83 84 85 86 87 88 89 90 91 92 93 94 95 96 97 98 99 100 101 102 103 104 105 106 107 108 109 110 111 112 113 114 115 116 117 118 119 120 121 122 123 124 125 126 127 128 129 130 131 132 133 134 135 136 137 138 139 140 141 142 143 144 145 146 147 148 149 150 151 152 153 154 155 156 157 158 159 160 161 162 163 164 165 166 167 168 169 170 171 172 173 174 175 176 177 178 179 180 181 182 183 184 185 186 187 188 189 190 191 192 193 194 195 196 197 198 199 200 201 202 203 204 205 206 207 208 209 210 211 212 213 214 215 216 217 218 219 220 221 222 223 224 225 226 227 228 229 230 231 232 233 234 235 236 237 238 239 240 241 242 243 244 245 246 247 248 249 250 251 252 253 254 255 256 257 258 259 260 261 262 263 264 265 266 267 268 269 270 271 272 273 274 275 276 277 278 279 280 281 282 283 284 285 286 287 288 |
--get the data --need to do this entire script for each db to be monitored USE <add your database name to monitor> -- change this to dbname to collect from Declare @DBName as varchar(100) Set @DBName = '<add your database name to monitor>' --add db name here to be checked --get Index reads with statement INSERT INTO [DBA_Monitoring].[dbo].[IndexOverviewReadsWithQuery_Stage] ([ServerName] ,[Database] ,[Object] ,[execution_count] ,[total_logical_reads] ,[total_physical_reads] ,[Statement]) SELECT @@ServerName, DB_NAME(st.dbid) [Database], OBJECT_NAME(st.objectid, st.dbid) [Object], qs.execution_count, qs.total_logical_reads, qs.total_physical_reads, st.text [Statement] FROM sys.dm_exec_query_stats qs CROSS APPLY sys.dm_exec_sql_text(qs.sql_handle) st INSERT INTO [DBA_Monitoring].[dbo].[IndexOverviewReadsWithQuery] ([ServerName] ,[Database] ,[Object] ,[execution_count] ,[total_logical_reads] ,[total_physical_reads] ,[Statement]) SELECT [ServerName] ,[Database] ,[Object] ,[execution_count] ,[total_logical_reads] ,[total_physical_reads] ,[Statement] FROM [DBA_Monitoring].[dbo].[IndexOverviewReadsWithQuery_Stage] WHERE [Database] = @DBName --get Index reads with counts INSERT INTO [DBA_Monitoring].[dbo].[IndexOverviewReadsWithCounts_Stage] ([ServerName] ,[Database] ,[Object] ,[execution_count] ,[total_logical_reads] ,[total_physical_reads]) SELECT @@ServerName, DB_NAME(database_id) [Database], OBJECT_NAME(object_id, database_id) [Object], execution_count, total_logical_reads, total_physical_reads FROM sys.dm_exec_procedure_stats; INSERT INTO [DBA_Monitoring].[dbo].[IndexOverviewReadsWithCounts] ([ServerName] ,[Database] ,[Object] ,[execution_count] ,[total_logical_reads] ,[total_physical_reads]) SELECT [ServerName] ,[Database] ,[Object] ,[execution_count] ,[total_logical_reads] ,[total_physical_reads] FROM [DBA_Monitoring].[dbo].[IndexOverviewReadsWithCounts_stage] WHERE [Database] = @DBName --get longest running queries INSERT INTO [DBA_Monitoring].[dbo].[IndexOverview_LongestQueries] ([ServerName] ,[DBName] ,[QueryName] ,[ExecutionCount] ,[MaxElapsedTime] ,[AvgElapsedTime] ,[LogCreatedOn]) (SELECT DISTINCT TOP 25 @@SERVERNAME as ServerName, @DBName as DBName, t.TEXT QueryName, s.execution_count AS ExecutionCount, s.max_elapsed_time AS MaxElapsedTime, ISNULL(s.total_elapsed_time / s.execution_count, 0) AS AvgElapsedTime, s.creation_time AS LogCreatedOn FROM sys.dm_exec_query_stats s CROSS APPLY sys.dm_exec_sql_text( s.sql_handle ) t) -- Unused Index Script INSERT INTO [DBA_Monitoring].[dbo].[IndexOverview_UnusedIndex] ([ServerName] ,[DBName] ,[ObjectName] ,[IndexName] ,[IndexID] ,[UserSeek] ,[UserScans] ,[UserLookups] ,[UserUpdates] ,[TableRows] ,[drop statement]) (SELECT TOP 25 @@SERVERNAME as ServerName, @DBName as DBName, o.name AS ObjectName , i.name AS IndexName , i.index_id AS IndexID , dm_ius.user_seeks AS UserSeek , dm_ius.user_scans AS UserScans , dm_ius.user_lookups AS UserLookups , dm_ius.user_updates AS UserUpdates , p.TableRows , 'DROP INDEX ' + QUOTENAME(i.name) + ' ON ' + QUOTENAME(s.name) + '.' + QUOTENAME(OBJECT_NAME(dm_ius.object_id)) as 'drop statement' FROM sys.dm_db_index_usage_stats dm_ius INNER JOIN sys.indexes i ON i.index_id = dm_ius.index_id AND dm_ius.object_id = i.object_id INNER JOIN sys.objects o on dm_ius.object_id = o.object_id INNER JOIN sys.schemas s on o.schema_id = s.schema_id INNER JOIN (SELECT SUM(p.rows) TableRows, p.index_id, p.object_id FROM sys.partitions p GROUP BY p.index_id, p.object_id) p ON p.index_id = dm_ius.index_id AND dm_ius.object_id = p.object_id WHERE OBJECTPROPERTY(dm_ius.object_id,'IsUserTable') = 1 AND dm_ius.database_id = DB_ID() AND i.type_desc = 'nonclustered' AND i.is_primary_key = 0 AND i.is_unique_constraint = 0) -- Missing Index Script INSERT INTO [DBA_Monitoring].[dbo].[IndexOverview_MissingIndex] ([ServerName] ,[DBName] ,[DatabaseID] ,[Avg_Estimated_Impact] ,[Last_User_Seek] ,[TableName] ,[Create_Statement]) (SELECT TOP 25 @@SERVERNAME as ServerName, @DBName as DBName, dm_mid.database_id AS DatabaseID, dm_migs.avg_user_impact*(dm_migs.user_seeks+dm_migs.user_scans) Avg_Estimated_Impact, dm_migs.last_user_seek AS Last_User_Seek, object_name(dm_mid.object_id,dm_mid.database_id) AS [TableName], 'CREATE INDEX [IX_' + object_name(dm_mid.object_id,dm_mid.database_id) + '_' + REPLACE(REPLACE(REPLACE(ISNULL(dm_mid.equality_columns,''),', ','_'),'[',''),']','') + CASE WHEN dm_mid.equality_columns IS NOT NULL AND dm_mid.inequality_columns IS NOT NULL THEN '_' ELSE '' END + REPLACE(REPLACE(REPLACE(ISNULL(dm_mid.inequality_columns,''),', ','_'),'[',''),']','') + ']' + ' ON ' + dm_mid.statement + ' (' + ISNULL (dm_mid.equality_columns,'') + CASE WHEN dm_mid.equality_columns IS NOT NULL AND dm_mid.inequality_columns IS NOT NULL THEN ',' ELSE '' END + ISNULL (dm_mid.inequality_columns, '') + ')' + ISNULL (' INCLUDE (' + dm_mid.included_columns + ')', '') AS Create_Statement FROM sys.dm_db_missing_index_groups dm_mig INNER JOIN sys.dm_db_missing_index_group_stats dm_migs ON dm_migs.group_handle = dm_mig.index_group_handle INNER JOIN sys.dm_db_missing_index_details dm_mid ON dm_mig.index_handle = dm_mid.index_handle WHERE dm_mid.database_ID = DB_ID()) ---fragmentation levels INSERT INTO [DBA_Monitoring].[dbo].[IndexOverview_FragLevels] ([ServerName] ,[DBName] ,[Table] ,[Index] ,[avg_fragmentation_in_percent] ,[page_count]) (SELECT @@SERVERNAME as ServerName, @DBName as DBName, dbtables.[name] as 'Table', dbindexes.[name] as 'Index', indexstats.avg_fragmentation_in_percent, indexstats.page_count FROM sys.dm_db_index_physical_stats (DB_ID(), NULL, NULL, NULL, NULL) AS indexstats INNER JOIN sys.tables dbtables on dbtables.[object_id] = indexstats.[object_id] INNER JOIN sys.schemas dbschemas on dbtables.[schema_id] = dbschemas.[schema_id] INNER JOIN sys.indexes AS dbindexes ON dbindexes.[object_id] = indexstats.[object_id] AND indexstats.index_id = dbindexes.index_id WHERE indexstats.database_id = DB_ID()) GO USE DBA_Monitoring --update to db name to run against go --Duplicate Index WITH MyDuplicate AS (SELECT Obj.[name] AS TableName, Idx.[name] AS IndexName, INDEX_Col(Sch.[name] + '.' + Obj.[name], Idx.index_id, 1) AS Col1, INDEX_Col(Sch.[name] + '.' + Obj.[name], Idx.index_id, 2) AS Col2, INDEX_Col(Sch.[name] + '.' + Obj.[name], Idx.index_id, 3) AS Col3, INDEX_Col(Sch.[name] + '.' + Obj.[name], Idx.index_id, 4) AS Col4, INDEX_Col(Sch.[name] + '.' + Obj.[name], Idx.index_id, 5) AS Col5, INDEX_Col(Sch.[name] + '.' + Obj.[name], Idx.index_id, 6) AS Col6, INDEX_Col(Sch.[name] + '.' + Obj.[name], Idx.index_id, 7) AS Col7, INDEX_Col(Sch.[name] + '.' + Obj.[name], Idx.index_id, 8) AS Col8, INDEX_Col(Sch.[name] + '.' + Obj.[name], Idx.index_id, 9) AS Col9, INDEX_Col(Sch.[name] + '.' + Obj.[name], Idx.index_id, 10) AS Col10 FROM sys.indexes Idx INNER JOIN sys.objects Obj ON Idx.[object_id] = Obj.[object_id] INNER JOIN sys.schemas Sch ON Sch.[schema_id] = Obj.[schema_id] WHERE index_id > 0) SELECT MD1.TableName, MD1.IndexName, MD2.IndexName AS OverLappingIndex, MD1.Col1, MD1.Col2, MD1.Col3, MD1.Col4, MD1.Col5, MD1.Col6, MD1.Col7, MD1.Col8, MD1.Col9, MD1.Col10 INTO ##Duplicates FROM MyDuplicate MD1 INNER JOIN MyDuplicate MD2 ON MD1.tablename = MD2.tablename AND MD1.indexname <> MD2.indexname AND MD1.Col1 = MD2.Col1 AND (MD1.Col2 IS NULL OR MD2.Col2 IS NULL OR MD1.Col2 = MD2.Col2) AND (MD1.Col3 IS NULL OR MD2.Col3 IS NULL OR MD1.Col3 = MD2.Col3) AND (MD1.Col4 IS NULL OR MD2.Col4 IS NULL OR MD1.Col4 = MD2.Col4) AND (MD1.Col5 IS NULL OR MD2.Col5 IS NULL OR MD1.Col5 = MD2.Col5) AND (MD1.Col6 IS NULL OR MD2.Col6 IS NULL OR MD1.Col6 = MD2.Col6) AND (MD1.Col7 IS NULL OR MD2.Col7 IS NULL OR MD1.Col7 = MD2.Col7) AND (MD1.Col8 IS NULL OR MD2.Col8 IS NULL OR MD1.Col8 = MD2.Col8) AND (MD1.Col9 IS NULL OR MD2.Col9 IS NULL OR MD1.Col9 = MD2.Col9) AND (MD1.Col10 IS NULL OR MD2.Col10 IS NULL OR MD1.Col10 = MD2.Col10) Declare @DBName as varchar(100) Set @DBName = '<add your database name to be monitored>' --add db name here to be checked INSERT INTO [DBA_Monitoring].[dbo].[IndexOverview_DuplicateIndex] (ServerName, DBName, [TableName] ,[IndexName] ,[OverLappingIndex] ,[Col1] ,[Col2] ,[Col3] ,[Col4] ,[Col5] ,[Col6] ,[Col7] ,[Col8] ,[Col9] ,[Col10] ) (select @@ServerName, @DBName, [TableName] ,[IndexName] ,[OverLappingIndex] ,[Col1] ,[Col2] ,[Col3] ,[Col4] ,[Col5] ,[Col6] ,[Col7] ,[Col8] ,[Col9] ,[Col10] from ##Duplicates) GO --get Index reads with counts INSERT INTO [DBA_Monitoring].[dbo].[IndexOverviewReadsWithCounts_Stage] ([ServerName] ,[Database] ,[Object] ,[execution_count] ,[total_logical_reads] ,[total_physical_reads]) SELECT @@ServerName, DB_NAME(database_id) [Database], OBJECT_NAME(object_id, database_id) [Object], execution_count, total_logical_reads, total_physical_reads FROM sys.dm_exec_procedure_stats; GO |
Step 3: Generate the reports
Each report is generated with HTML and sent via dbMail. These reports are called from within the SQL Agent Job one at a time after all of the data has been collected. Copy / Paste and run the scripts below to see the reports. Make sure to change the variables marked <> throughout.
Report: Unused Index
This report will provide unused indexes that are currently setup. DMV data is greatly important here as all indexes are not activated all the time. So be careful of your last server restart when reviewing this report. This report will also provide the appropriate drop statement that you can run to remove the unused index following analysis. I highly recommend scripting and saving the indexes prior to removing them in the event you need to add them back later.
|
1 2 3 4 5 6 7 8 9 10 11 12 13 14 15 16 17 18 19 20 21 22 23 24 25 26 27 28 29 30 31 32 33 34 35 36 37 38 39 40 41 42 43 44 45 46 47 48 49 50 51 52 |
SET nocount ON -- DECLARE @Subject VARCHAR (100) SET @Subject='SQL Server - Index Overview_Unused Index ''<Add Server/Database Names>''' DECLARE @Count AS INT SELECT @Count=COUNT(*) FROM DBA_Monitoring.dbo.IndexOverview_UnusedIndex PRINT @Count IF @Count > 0 BEGIN DECLARE @tableHTML NVARCHAR(MAX) ; SET @tableHTML = N'<table border="1">' + N'<tr>' + N'<th>Server Name</th>' + N'<th>DB Name</th>' + N'<th>Object Name</th>' + N'<th>Index Name</th>' + N'<th>User Seek</th>' + N'<th>User Scan</th>' + N'<th>User Lookups</th>' + N'<th>User Updates</th>' + N'<th>Table Rows</th>' + N'<th>Drop Statement</th>' + N'</tr>' + CAST ( ( SELECT td=[ServerName],'' ,td=[DBname],'' ,td=[ObjectName],'' ,td=[IndexName],'' ,td=[USERSeek],'' ,td=[UserScans],'' ,td=[UserLookups],'' ,td=[UserUpdates],'' ,td=[TableRows],'' ,td=[drop statement],'' FROM DBA_Monitoring.dbo.IndexOverview_UnusedIndex order by ServerName, DBName, IndexName FOR XML PATH('tr'), TYPE ) AS NVARCHAR(MAX) ) + N'</table>' ; EXEC msdb.dbo.sp_send_dbmail @profile_name = '<add your mail profile here>', @recipients = '<add your email here>', @subject = @Subject, @body = @tableHTML, @body_format = 'HTML' ; END |
|
|
|
|
|
|
|
|
|
|
|
|
|
|
|
|
|
|
|
|
| DROP INDEX [IX_Samples] ON [dbo].[databaseName] |
Report: Missing Index
This report will contain the missing indexes along with the create statement that could be used following analysis to generate the missing index. DMV data is greatly important here as all indexes are not activated all the time. So be careful of your last server restart when reviewing this report.
|
1 2 3 4 5 6 7 8 9 10 11 12 13 14 15 16 17 18 19 20 21 22 23 24 25 26 27 28 29 30 31 32 33 34 35 36 37 38 39 40 41 42 43 44 |
SET nocount ON -- DECLARE @Subject VARCHAR (100) SET @Subject='SQL Server - Index Overview_Missing Index ''<Add Server/Database Names>''' DECLARE @Count AS INT SELECT @Count=COUNT(*) FROM DBA_Monitoring.dbo.IndexOverview_MissingIndex PRINT @Count IF @Count > 0 BEGIN DECLARE @tableHTML NVARCHAR(MAX) ; SET @tableHTML = N'<table border="1">' + N'<tr>' + N'<th>Server Name</th>' + N'<th>DB Name</th>' + N'<th>Avg Estimated Impact (milliseconds)</th>' + N'<th>Last User Seek</th>' + N'<th>Table Name</th>' + N'<th>Create Statement</th>' + N'</tr>' + CAST ( ( SELECT td=[ServerName],'' ,td=[DBname],'' ,td=Cast([Avg_Estimated_Impact] as varchar(25)),'' ,td=[Last_User_Seek],'' ,td=[TableName],'' ,td=[Create_Statement],'' FROM DBA_Monitoring.dbo.IndexOverview_MissingIndex order by ServerName, DBName, TableName FOR XML PATH('tr'), TYPE ) AS NVARCHAR(MAX) ) + N'</table>' ; EXEC msdb.dbo.sp_send_dbmail @profile_name = '<add your mail profile here>', @recipients = '<add your email here>', @subject = @Subject, @body = @tableHTML, @body_format = 'HTML' ; END |
|
|
|
|
|
|
|
|
|
|
|
|
|
|
Report: Duplicate Index
This report contains duplicate or overlapping indexes and a drop statement to clean them up following analysis. I highly recommend scripting and saving the indexes prior to removing them in the event you need to add them back later.
|
1 2 3 4 5 6 7 8 9 10 11 12 13 14 15 16 17 18 19 20 21 22 23 24 25 26 27 28 29 30 31 32 33 34 35 36 37 38 39 40 41 42 43 44 45 46 47 48 49 50 51 52 53 54 55 56 57 58 59 60 61 |
SET nocount ON -- DECLARE @Subject VARCHAR (100) SET @Subject='SQL Server - Index Overview_Duplicate Index ''<Add Server/Database Names>''' DECLARE @Count AS INT SELECT @Count=COUNT(*) FROM DBA_Monitoring.dbo.IndexOverview_DuplicateIndex PRINT @Count IF @Count > 0 BEGIN DECLARE @tableHTML NVARCHAR(MAX) ; SET @tableHTML = N'<table border="1">' + N'<tr>' + N'<th>Server Name</th>' + N'<th>DB Name</th>' + N'<th>Table Name</th>' + N'<th>Over Lapping Index</th>' + N'<th>Col1</th>' + N'<th>Col2</th>' + N'<th>Col3</th>' + N'<th>Col4</th>' + N'<th>Col5</th>' + N'<th>Col6</th>' + N'<th>Col7</th>' + N'<th>Col8</th>' + N'<th>Col9</th>' + N'<th>Col10</th>' + N'</tr>' + CAST ( ( SELECT td=[servername],'' ,td=[dbname],'' ,td=[OverlappingIndex],'' ,td=[Col1],'' ,td=[Col2],'' ,td=[Col3],'' ,td=[Col4],'' ,td=[Col5],'' ,td=[Col6],'' ,td=[Col7],'' ,td=[Col8],'' ,td=[Col9],'' ,td=[Col10],'' FROM DBA_Monitoring.dbo.IndexOverview_DuplicateIndex ORDER BY ServerName, DBName, TableName,IndexName FOR XML PATH('tr'), TYPE ) AS NVARCHAR(MAX) ) + N'</table>' ; EXEC msdb.dbo.sp_send_dbmail @profile_name = '<add your mail profile here>', @recipients = '<add your email here>', @subject = @Subject, @body = @tableHTML, @body_format = 'HTML' ; END |
The example below has been truncated to only show up to 3 columns however the report will return up to 10 index columns.
|
|
|
|
|
|
|
|
|
|
|
|
|
|
|
|
Report: Longest Running Queries
This report will contain the longest running/most expensive queries. This report is useful to see how many times a query is executed along with how long it takes to run.
|
1 2 3 4 5 6 7 8 9 10 11 12 13 14 15 16 17 18 19 20 21 22 23 24 25 26 27 28 29 30 31 32 33 34 35 36 37 38 39 40 41 42 43 44 |
SET nocount ON -- DECLARE @Subject VARCHAR (100) SET @Subject='SQL Server - Index Overview_Longest Running Queries ''<Add Server/Database Names>''' DECLARE @Count AS INT SELECT @Count=COUNT(*) FROM DBA_Monitoring.dbo.IndexOverview_LongestQueries PRINT @Count IF @Count > 0 BEGIN DECLARE @tableHTML NVARCHAR(MAX) ; SET @tableHTML = N'<table border="1">' + N'<tr>' + N'<th>Server Name</th>' + N'<th>DB Name</th>' + N'<th>Query</th>' + N'<th>Execution Count</th>' + N'<th>Max Elasped Time (ms)</th>' + N'<th>Avg Elsaped Time (ms)</th>' + N'</tr>' + CAST ( ( SELECT td=[ServerName],'' ,td=[DBname],'' ,td=[Queryname],'' ,td=[ExecutionCount],'' ,td=MaxElapsedTime,'' ,td=AvgElapsedTime,'' FROM DBA_Monitoring.dbo.IndexOverview_LongestQueries order by ServerName, DBName, QueryName, ExecutionCount FOR XML PATH('tr'), TYPE ) AS NVARCHAR(MAX) ) + N'</table>' ; EXEC msdb.dbo.sp_send_dbmail @profile_name = '<add your mail profile here>', @recipients = '<add your email here>', @subject = @Subject, @body = @tableHTML, @body_format = 'HTML' ; END |
|
|
|
|
|
|
|
|
|
|
|
|
|
|
Report: Index Reads with Statement
This report will contain statistics against each object executed including the query that ran. In addition to this you will also see total logical reads and total physical reads. These are great for determining if queries are being run in memory or disk. These statistics are useful to determine if adding additional indexes could assist the query to run faster. Another benefit could be in determinig hardware updates such as memory or even server level settings such as the “maximum server memory” setting.
|
1 2 3 4 5 6 7 8 9 10 11 12 13 14 15 16 17 18 19 20 21 22 23 24 25 26 27 28 29 30 31 32 33 34 35 36 37 38 39 40 41 42 43 44 45 46 |
SET nocount ON -- DECLARE @Subject VARCHAR (100) SET @Subject='SQL Server - Index Overview_Index Reads with Statements ''<Add Server/Database Names>''' DECLARE @Count AS INT SELECT @Count=COUNT(*) FROM DBA_Monitoring.dbo.IndexOverviewReadsWithQuery PRINT @Count IF @Count > 0 BEGIN DECLARE @tableHTML NVARCHAR(MAX) ; SET @tableHTML = N'<table border="1">' + N'<tr>' + N'<th>Server Name</th>' + N'<th>DB Name</th>' + N'<th>Object</th>' + N'<th>Execution Count</th>' + N'<th>Total Logical Reads</th>' + N'<th>Total Physical Reads</th>' + N'<th>Statement</th>' + N'</tr>' + CAST ( ( SELECT top 100 td=[ServerName],'' ,td=[DataBase],'' ,td=[Object],'' ,td=[execution_count],'' ,td=total_logical_reads,'' ,td=total_physical_reads,'' ,td=[Statement],'' FROM DBA_Monitoring.dbo.IndexOverviewReadsWithQuery order by ServerName, [Database], [Object] FOR XML PATH('tr'), TYPE ) AS NVARCHAR(MAX) ) + N'</table>' ; EXEC msdb.dbo.sp_send_dbmail @profile_name = '<add your mail profile here>', @recipients = '<add your email here>', @subject = @Subject, @body = @tableHTML, @body_format = 'HTML' ; END |
|
|
|
|
|
|
|
|
|
|
|
|
|
|
|
|
Report: Index Reads with Counts
This report will contain counts for each database object executed against. This is similar to the Index Reads with Statement report however this report shows just the counts. This is great for just a quick peak into what is going on.
|
1 2 3 4 5 6 7 8 9 10 11 12 13 14 15 16 17 18 19 20 21 22 23 24 25 26 27 28 29 30 31 32 33 34 35 36 37 38 39 40 41 42 43 44 |
SET nocount ON -- DECLARE @Subject VARCHAR (100) SET @Subject='SQL Server - Index Overview_Index Reads with Counts ''<Add Server/Database Names>''' DECLARE @Count AS INT SELECT @Count=COUNT(*) FROM DBA_Monitoring.dbo.IndexOverviewReadsWithCounts PRINT @Count IF @Count > 0 BEGIN DECLARE @tableHTML NVARCHAR(MAX) ; SET @tableHTML = N'<table border="1">' + N'<tr>' + N'<th>Server Name</th>' + N'<th>DB Name</th>' + N'<th>Object</th>' + N'<th>Execution Count</th>' + N'<th>Total Logical Reads</th>' + N'<th>Total Physical Reads</th>' + N'</tr>' + CAST ( ( SELECT td=[ServerName],'' ,td=[DataBase],'' ,td=[Object],'' ,td=[execution_count],'' ,td=total_logical_reads,'' ,td=total_physical_reads,'' FROM DBA_Monitoring.dbo.IndexOverviewReadsWithCounts order by ServerName, [Database], [Object] FOR XML PATH('tr'), TYPE ) AS NVARCHAR(MAX) ) + N'</table>' ; EXEC msdb.dbo.sp_send_dbmail @profile_name = '<add your mail profile here>', @recipients = '<add your email here>', @subject = @Subject, @body = @tableHTML, @body_format = 'HTML' ; END |
This report will contain counts for each database object executed.
|
|
|
|
|
|
|
|
|
|
|
|
|
|
Report: Fragmentation Levels
This report will contains index fragmentation % and page count for each index. When looking at the fragmentation %, a good rule of thumb for managing indexes is:
- 0-5% fragmentation leave alone
- 6-30% reorganize the index
- 31% or higher rebuild the index
Also, do not forget to consider page count. Low page count and high fragmentation may not be an issue. For example 80% fragmentation and 5 pages should not cause alarm.
|
1 2 3 4 5 6 7 8 9 10 11 12 13 14 15 16 17 18 19 20 21 22 23 24 25 26 27 28 29 30 31 32 33 34 35 36 37 38 39 40 41 42 43 44 |
SET nocount ON -- DECLARE @Subject VARCHAR (100) SET @Subject='SQL Server - Index Overview_Fragmentation Levels ''<Add Server/Database Names>''' DECLARE @Count AS INT SELECT @Count=COUNT(*) FROM DBA_Monitoring.dbo.IndexOverview_FragLevels PRINT @Count IF @Count > 0 BEGIN DECLARE @tableHTML NVARCHAR(MAX) ; SET @tableHTML = N'<table border="1">' + N'<tr>' + N'<th>Server Name</th>' + N'<th>DB Name</th>' + N'<th>Table</th>' + N'<th>Index</th>' + N'<th>Fragmentation %</th>' + N'<th>Page Count</th>' + N'</tr>' + CAST ( ( SELECT td=[ServerName],'' ,td=[DBname],'' ,td=[Table],'' ,td=IsNull([Index], 'HEAP - no clustered index'),'' ,td=convert(varchar, round([avg_fragmentation_in_percent], 2)),'' ,td=[page_count],'' FROM DBA_Monitoring.dbo.IndexOverview_FragLevels order by ServerName, DBName, [Table], [Index] FOR XML PATH('tr'), TYPE ) AS NVARCHAR(MAX) ) + N'</table>' ; EXEC msdb.dbo.sp_send_dbmail @profile_name = '<add your mail profile here>', @recipients = '<add your email here>', @subject = @Subject, @body = @tableHTML, @body_format = 'HTML' ; END |
|
|
|
|
|
|
|
|
|
|
|
|
|
|
Step 4: Purge Data
Following the data collection you will need to clean up the temp and staging tables before your next run. Paste this script to clean up the temp and staging tables. In the SQL Agent Job, I have this as the first step therefore the previous data is available between runs. If running it manually outside the SQL Agent job, you can just run this after you run reports. Copy / Paste the script below to purge the data prior to the next run.
|
1 2 3 4 5 6 7 8 9 10 11 12 13 14 15 16 17 18 19 20 21 22 23 24 25 26 |
--clean up USE DBA_Monitoring go Truncate Table dbo.IndexOverviewReadsWithCounts go Truncate Table dbo.IndexOverviewReadsWithQuery go Truncate Table dbo.IndexOverviewReadsWithCounts_Stage go Truncate Table dbo.IndexOverviewReadsWithQuery_Stage Truncate Table dbo.IndexOverview_DuplicateIndex go Truncate Table dbo.IndexOverview_FragLevels go Truncate Table dbo.IndexOverview_LongestQueries go Truncate Table dbo.IndexOverview_MissingIndex go Truncate Table dbo.IndexOverview_UnusedIndex go IF OBJECT_ID('tempdb..##Duplicates') IS NOT NULL /*Then it exists*/ DROP TABLE ##Duplicates |
Step 5: SQL Agent Job
The SQL Agent Job ties the entire process together by calling steps 2-4 above. I usually call this job ad-hoc when someone complains about performance, however you could schedule it as well. Again, just a warning the data is only valid between server restarts so if you restarted the server a day or two ago your data will not be as rich as data collected after a month between the last server restart, so be wary of restarts. Below is what the SQL Agent Job looks like:
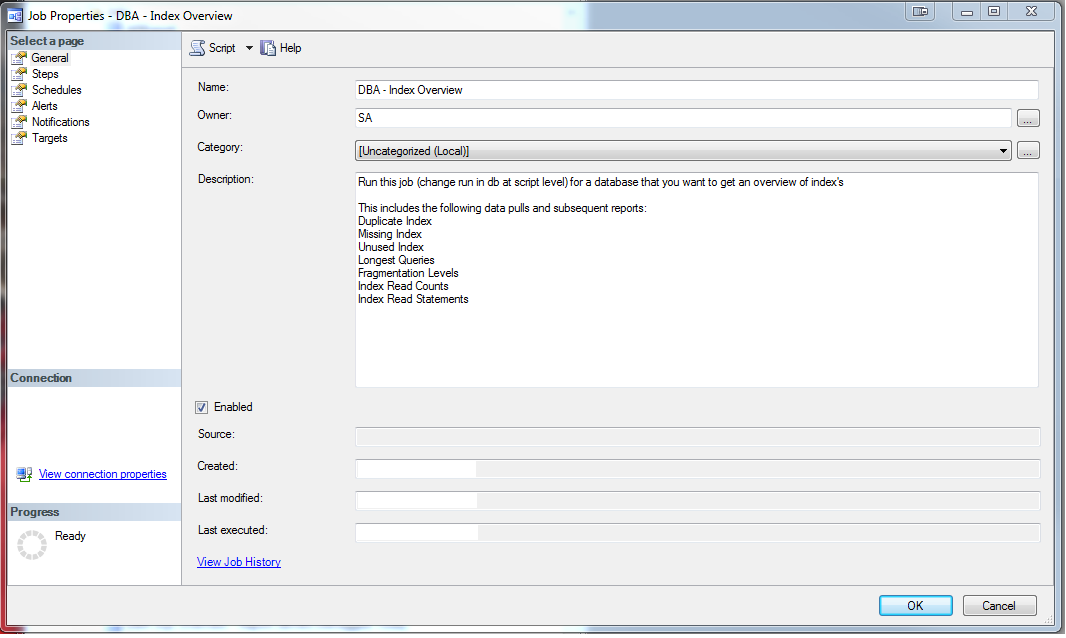
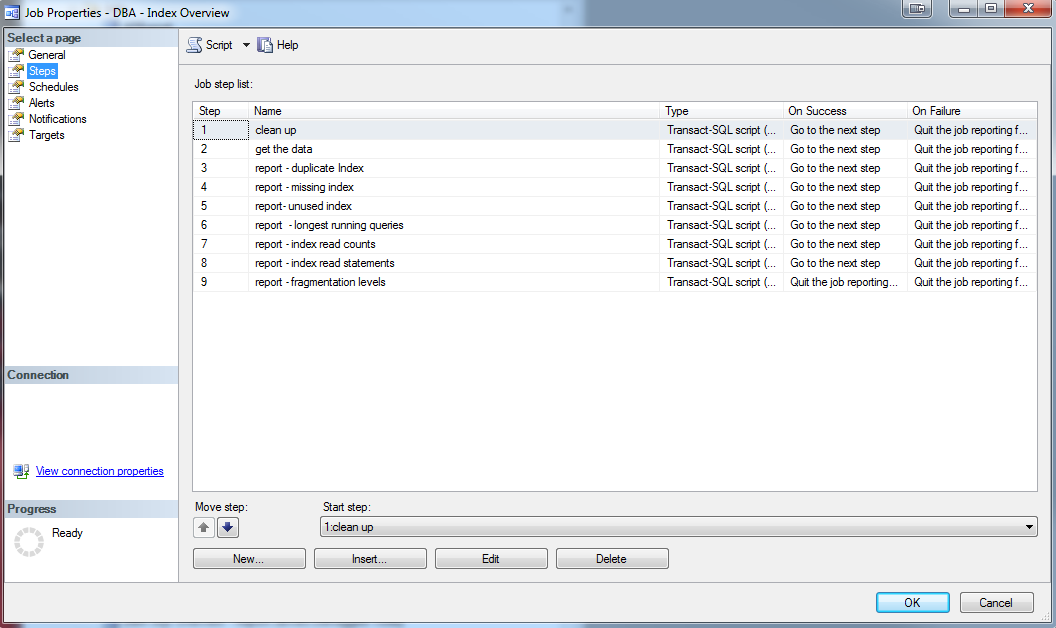
Copy/Paste/Run the script below to create the above SQL Agent Job. Again please change the variables marked with <>
|
1 2 3 4 5 6 7 8 9 10 11 12 13 14 15 16 17 18 19 20 21 22 23 24 25 26 27 28 29 30 31 32 33 34 35 36 37 38 39 40 41 42 43 44 45 46 47 48 49 50 51 52 53 54 55 56 57 58 59 60 61 62 63 64 65 66 67 68 69 70 71 72 73 74 75 76 77 78 79 80 81 82 83 84 85 86 87 88 89 90 91 92 93 94 95 96 97 98 99 100 101 102 103 104 105 106 107 108 109 110 111 112 113 114 115 116 117 118 119 120 121 122 123 124 125 126 127 128 129 130 131 132 133 134 135 136 137 138 139 140 141 142 143 144 145 146 147 148 149 150 151 152 153 154 155 156 157 158 159 160 161 162 163 164 165 166 167 168 169 170 171 172 173 174 175 176 177 178 179 180 181 182 183 184 185 186 187 188 189 190 191 192 193 194 195 196 197 198 199 200 201 202 203 204 205 206 207 208 209 210 211 212 213 214 215 216 217 218 219 220 221 222 223 224 225 226 227 228 229 230 231 232 233 234 235 236 237 238 239 240 241 242 243 244 245 246 247 248 249 250 251 252 253 254 255 256 257 258 259 260 261 262 263 264 265 266 267 268 269 270 271 272 273 274 275 276 277 278 279 280 281 282 283 284 285 286 287 288 289 290 291 292 293 294 295 296 297 298 299 300 301 302 303 304 305 306 307 308 309 310 311 312 313 314 315 316 317 318 319 320 321 322 323 324 325 326 327 328 329 330 331 332 333 334 335 336 337 338 339 340 341 342 343 344 345 346 347 348 349 350 351 352 353 354 355 356 357 358 359 360 361 362 363 364 365 366 367 368 369 370 371 372 373 374 375 376 377 378 379 380 381 382 383 384 385 386 387 388 389 390 391 392 393 394 395 396 397 398 399 400 401 402 403 404 405 406 407 408 409 410 411 412 413 414 415 416 417 418 419 420 421 422 423 424 425 426 427 428 429 430 431 432 433 434 435 436 437 438 439 440 441 442 443 444 445 446 447 448 449 450 451 452 453 454 455 456 457 458 459 460 461 462 463 464 465 466 467 468 469 470 471 472 473 474 475 476 477 478 479 480 481 482 483 484 485 486 487 488 489 490 491 492 493 494 495 496 497 498 499 500 501 502 503 504 505 506 507 508 509 510 511 512 513 514 515 516 517 518 519 520 521 522 523 524 525 526 527 528 529 530 531 532 533 534 535 536 537 538 539 540 541 542 543 544 545 546 547 548 549 550 551 552 553 554 555 556 557 558 559 560 561 562 563 564 565 566 567 568 569 570 571 572 573 574 575 576 577 578 579 580 581 582 583 584 585 586 587 588 589 590 591 592 593 594 595 596 597 598 599 600 601 602 603 604 605 606 607 608 609 610 611 612 613 614 615 616 617 618 619 620 621 622 623 624 625 626 627 628 629 630 631 632 633 634 635 636 637 638 639 640 641 642 643 644 645 646 647 648 649 650 651 652 653 654 655 656 657 658 659 660 661 662 663 664 665 666 667 668 669 670 671 672 673 674 675 676 677 678 679 680 681 682 683 684 685 686 687 688 689 690 691 692 693 694 695 696 697 698 699 700 701 702 703 704 705 706 707 708 709 710 711 712 713 714 715 716 717 718 719 720 721 722 723 724 725 726 727 728 729 730 731 732 |
USE [msdb] GO /****** Object: Job [Index Overview] ******/ BEGIN TRANSACTION DECLARE @ReturnCode INT SELECT @ReturnCode = 0 /****** Object: JobCategory [[Uncategorized (Local)]]] ******/ IF NOT EXISTS (SELECT name FROM msdb.dbo.syscategories WHERE name=N'[Uncategorized (Local)]' AND category_class=1) BEGIN EXEC @ReturnCode = msdb.dbo.sp_add_category @class=N'JOB', @type=N'LOCAL', @name=N'[Uncategorized (Local)]' IF (@@ERROR <> 0 OR @ReturnCode <> 0) GOTO QuitWithRollback END DECLARE @jobId BINARY(16) EXEC @ReturnCode = msdb.dbo.sp_add_job @job_name=N'Index Overview', @enabled=1, @notify_level_eventlog=0, @notify_level_email=0, @notify_level_netsend=0, @notify_level_page=0, @delete_level=0, @description=N'Run this job (change run in db at script level) for a database that you want to get an overview of index''s This includes the following data pulls and subsequent reports: Duplicate Index Missing Index Unused Index Longest Queries Fragmentation Levels Index Read Counts Index Read Statements', @category_name=N'[Uncategorized (Local)]', @owner_login_name=N'SA', @job_id = @jobId OUTPUT IF (@@ERROR <> 0 OR @ReturnCode <> 0) GOTO QuitWithRollback /****** Object: Step [clean up] ******/ EXEC @ReturnCode = msdb.dbo.sp_add_jobstep @job_id=@jobId, @step_name=N'clean up', @step_id=1, @cmdexec_success_code=0, @on_success_action=3, @on_success_step_id=0, @on_fail_action=2, @on_fail_step_id=0, @retry_attempts=0, @retry_interval=0, @os_run_priority=0, @subsystem=N'TSQL', @command=N'--clean up USE DBA_Monitoring go Truncate Table dbo.IndexOverviewReadsWithCounts go Truncate Table dbo.IndexOverviewReadsWithQuery go Truncate Table dbo.IndexOverviewReadsWithCounts_Stage go Truncate Table dbo.IndexOverviewReadsWithQuery_Stage go Truncate Table dbo.IndexOverview_DuplicateIndex go Truncate Table dbo.IndexOverview_FragLevels go Truncate Table dbo.IndexOverview_LongestQueries go Truncate Table dbo.IndexOverview_MissingIndex go Truncate Table dbo.IndexOverview_UnusedIndex go IF OBJECT_ID(''tempdb..##Duplicates'') IS NOT NULL /*Then it exists*/ DROP TABLE ##Duplicates ', @database_name=N'DBA_Monitoring', @output_file_name=N'<add your path>\IndexOverviewErrors.txt', @flags=6 IF (@@ERROR <> 0 OR @ReturnCode <> 0) GOTO QuitWithRollback /****** Object: Step [get the data] ******/ EXEC @ReturnCode = msdb.dbo.sp_add_jobstep @job_id=@jobId, @step_name=N'get the data', @step_id=2, @cmdexec_success_code=0, @on_success_action=3, @on_success_step_id=0, @on_fail_action=2, @on_fail_step_id=0, @retry_attempts=0, @retry_interval=0, @os_run_priority=0, @subsystem=N'TSQL', @command=N'--get the data --need to do this entire script for each db -- change DB name above to collect from Declare @DBName as varchar(100) Set @DBName = ''<Add your db name to be monitored here>'' --add db name here to be checked --get longest running queries INSERT INTO [DBA_Monitoring].[dbo].[IndexOverview_LongestQueries] ([ServerName] ,[DBName] ,[QueryName] ,[ExecutionCount] ,[MaxElapsedTime] ,[AvgElapsedTime] ,[LogCreatedOn]) (SELECT DISTINCT TOP 25 @@SERVERNAME as ServerName, @DBName as DBName, t.TEXT QueryName, s.execution_count AS ExecutionCount, s.max_elapsed_time AS MaxElapsedTime, ISNULL(s.total_elapsed_time / s.execution_count, 0) AS AvgElapsedTime, s.creation_time AS LogCreatedOn FROM sys.dm_exec_query_stats s CROSS APPLY sys.dm_exec_sql_text( s.sql_handle ) t) -- Unused Index Script INSERT INTO [DBA_Monitoring].[dbo].[IndexOverview_UnusedIndex] ([ServerName] ,[DBName] ,[ObjectName] ,[IndexName] ,[IndexID] ,[UserSeek] ,[UserScans] ,[UserLookups] ,[UserUpdates] ,[TableRows] ,[drop statement]) (SELECT TOP 25 @@SERVERNAME as ServerName, @DBName as DBName, o.name AS ObjectName , i.name AS IndexName , i.index_id AS IndexID , dm_ius.user_seeks AS UserSeek , dm_ius.user_scans AS UserScans , dm_ius.user_lookups AS UserLookups , dm_ius.user_updates AS UserUpdates , p.TableRows , ''DROP INDEX '' + QUOTENAME(i.name) + '' ON '' + QUOTENAME(s.name) + ''.'' + QUOTENAME(OBJECT_NAME(dm_ius.object_id)) as ''drop statement'' FROM sys.dm_db_index_usage_stats dm_ius INNER JOIN sys.indexes i ON i.index_id = dm_ius.index_id AND dm_ius.object_id = i.object_id INNER JOIN sys.objects o on dm_ius.object_id = o.object_id INNER JOIN sys.schemas s on o.schema_id = s.schema_id INNER JOIN (SELECT SUM(p.rows) TableRows, p.index_id, p.object_id FROM sys.partitions p GROUP BY p.index_id, p.object_id) p ON p.index_id = dm_ius.index_id AND dm_ius.object_id = p.object_id WHERE OBJECTPROPERTY(dm_ius.object_id,''IsUserTable'') = 1 AND dm_ius.database_id = DB_ID() AND i.type_desc = ''nonclustered'' AND i.is_primary_key = 0 AND i.is_unique_constraint = 0) -- Missing Index Script INSERT INTO [DBA_Monitoring].[dbo].[IndexOverview_MissingIndex] ([ServerName] ,[DBName] ,[DatabaseID] ,[Avg_Estimated_Impact] ,[Last_User_Seek] ,[TableName] ,[Create_Statement]) (SELECT TOP 25 @@SERVERNAME as ServerName, @DBName as DBName, dm_mid.database_id AS DatabaseID, dm_migs.avg_user_impact*(dm_migs.user_seeks+dm_migs.user_scans) Avg_Estimated_Impact, dm_migs.last_user_seek AS Last_User_Seek, object_name(dm_mid.object_id,dm_mid.database_id) AS [TableName], ''CREATE INDEX [IX_'' + object_name(dm_mid.object_id,dm_mid.database_id) + ''_'' + REPLACE(REPLACE(REPLACE(ISNULL(dm_mid.equality_columns,''''),'', '',''_''),''['',''''),'']'','''') + CASE WHEN dm_mid.equality_columns IS NOT NULL AND dm_mid.inequality_columns IS NOT NULL THEN ''_'' ELSE '''' END + REPLACE(REPLACE(REPLACE(ISNULL(dm_mid.inequality_columns,''''),'', '',''_''),''['',''''),'']'','''') + '']'' + '' ON '' + dm_mid.statement + '' ('' + ISNULL (dm_mid.equality_columns,'''') + CASE WHEN dm_mid.equality_columns IS NOT NULL AND dm_mid.inequality_columns IS NOT NULL THEN '','' ELSE '''' END + ISNULL (dm_mid.inequality_columns, '''') + '')'' + ISNULL ('' INCLUDE ('' + dm_mid.included_columns + '')'', '''') AS Create_Statement FROM sys.dm_db_missing_index_groups dm_mig INNER JOIN sys.dm_db_missing_index_group_stats dm_migs ON dm_migs.group_handle = dm_mig.index_group_handle INNER JOIN sys.dm_db_missing_index_details dm_mid ON dm_mig.index_handle = dm_mid.index_handle WHERE dm_mid.database_ID = DB_ID()) ---fragmentation levels INSERT INTO [DBA_Monitoring].[dbo].[IndexOverview_FragLevels] ([ServerName] ,[DBName] ,[Table] ,[Index] ,[avg_fragmentation_in_percent] ,[page_count]) (SELECT @@SERVERNAME as ServerName, @DBName as DBName, dbtables.[name] as ''Table'', dbindexes.[name] as ''Index'', indexstats.avg_fragmentation_in_percent, indexstats.page_count FROM sys.dm_db_index_physical_stats (DB_ID(), NULL, NULL, NULL, NULL) AS indexstats INNER JOIN sys.tables dbtables on dbtables.[object_id] = indexstats.[object_id] INNER JOIN sys.schemas dbschemas on dbtables.[schema_id] = dbschemas.[schema_id] INNER JOIN sys.indexes AS dbindexes ON dbindexes.[object_id] = indexstats.[object_id] AND indexstats.index_id = dbindexes.index_id WHERE indexstats.database_id = DB_ID()) GO --USE DBA_Monitoring --update to db name to run against --go --Duplicate Index WITH MyDuplicate AS (SELECT Obj.[name] AS TableName, Idx.[name] AS IndexName, INDEX_Col(Sch.[name] + ''.'' + Obj.[name], Idx.index_id, 1) AS Col1, INDEX_Col(Sch.[name] + ''.'' + Obj.[name], Idx.index_id, 2) AS Col2, INDEX_Col(Sch.[name] + ''.'' + Obj.[name], Idx.index_id, 3) AS Col3, INDEX_Col(Sch.[name] + ''.'' + Obj.[name], Idx.index_id, 4) AS Col4, INDEX_Col(Sch.[name] + ''.'' + Obj.[name], Idx.index_id, 5) AS Col5, INDEX_Col(Sch.[name] + ''.'' + Obj.[name], Idx.index_id, 6) AS Col6, INDEX_Col(Sch.[name] + ''.'' + Obj.[name], Idx.index_id, 7) AS Col7, INDEX_Col(Sch.[name] + ''.'' + Obj.[name], Idx.index_id, 8) AS Col8, INDEX_Col(Sch.[name] + ''.'' + Obj.[name], Idx.index_id, 9) AS Col9, INDEX_Col(Sch.[name] + ''.'' + Obj.[name], Idx.index_id, 10) AS Col10, FROM sys.indexes Idx INNER JOIN sys.objects Obj ON Idx.[object_id] = Obj.[object_id] INNER JOIN sys.schemas Sch ON Sch.[schema_id] = Obj.[schema_id] WHERE index_id > 0) SELECT MD1.TableName, MD1.IndexName, MD2.IndexName AS OverLappingIndex, MD1.Col1, MD1.Col2, MD1.Col3, MD1.Col4, MD1.Col5, MD1.Col6, MD1.Col7, MD1.Col8, MD1.Col9, MD1.Col10 INTO ##Duplicates FROM MyDuplicate MD1 INNER JOIN MyDuplicate MD2 ON MD1.tablename = MD2.tablename AND MD1.indexname <> MD2.indexname AND MD1.Col1 = MD2.Col1 AND (MD1.Col2 IS NULL OR MD2.Col2 IS NULL OR MD1.Col2 = MD2.Col2) AND (MD1.Col3 IS NULL OR MD2.Col3 IS NULL OR MD1.Col3 = MD2.Col3) AND (MD1.Col4 IS NULL OR MD2.Col4 IS NULL OR MD1.Col4 = MD2.Col4) AND (MD1.Col5 IS NULL OR MD2.Col5 IS NULL OR MD1.Col5 = MD2.Col5) AND (MD1.Col6 IS NULL OR MD2.Col6 IS NULL OR MD1.Col6 = MD2.Col6) AND (MD1.Col7 IS NULL OR MD2.Col7 IS NULL OR MD1.Col7 = MD2.Col7) AND (MD1.Col8 IS NULL OR MD2.Col8 IS NULL OR MD1.Col8 = MD2.Col8) AND (MD1.Col9 IS NULL OR MD2.Col9 IS NULL OR MD1.Col9 = MD2.Col9) AND (MD1.Col10 IS NULL OR MD2.Col10 IS NULL OR MD1.Col10 = MD2.Col10) Declare @DBName as varchar(100) Set @DBName = ''<add your database name here to monitor>'' --add db name here to be checked INSERT INTO [DBA_Monitoring].[dbo].[IndexOverview_DuplicateIndex] (ServerName, DBName, [TableName] ,[IndexName] ,[OverLappingIndex] ,[Col1] ,[Col2] ,[Col3] ,[Col4] ,[Col5] ,[Col6] ,[Col7] ,[Col8] ,[Col9] ,[Col10] ) (select @@ServerName, @DBName, [TableName] ,[IndexName] ,[OverLappingIndex] ,[Col1] ,[Col2] ,[Col3] ,[Col4] ,[Col5] ,[Col6] ,[Col7] ,[Col8] ,[Col9] ,[Col10] from ##Duplicates)', @database_name=N'<add your database name to be monitored here>', @output_file_name=N'<add your path>\IndexOverviewErrors.txt', @flags=2 IF (@@ERROR <> 0 OR @ReturnCode <> 0) GOTO QuitWithRollback /****** Object: Step [report - duplicate Index] ******/ EXEC @ReturnCode = msdb.dbo.sp_add_jobstep @job_id=@jobId, @step_name=N'report - duplicate Index', @step_id=3, @cmdexec_success_code=0, @on_success_action=3, @on_success_step_id=0, @on_fail_action=2, @on_fail_step_id=0, @retry_attempts=0, @retry_interval=0, @os_run_priority=0, @subsystem=N'TSQL', @command=N'SET nocount ON -- DECLARE @Subject VARCHAR (100) SET @Subject=''SQL Server - Index Overview_Duplicate Index ''''Add Server Name'''''' DECLARE @Count AS INT SELECT @Count=COUNT(*) FROM DBA_Monitoring.dbo.IndexOverview_DuplicateIndex PRINT @Count IF @Count > 0 BEGIN DECLARE @tableHTML NVARCHAR(MAX) ; SET @tableHTML = N''<table border="1">'' + N''<tr>'' + N''<th>Server Name</th>'' + N''<th>DB Name</th>'' + N''<th>Table Name</th>'' + N''<th>Over Lapping Index</th>'' + N''<th>Col1</th>'' + N''<th>Col2</th>'' + N''<th>Col3</th>'' + N''<th>Col4</th>'' + N''<th>Col5</th>'' + N''<th>Col6</th>'' + N''<th>Col7</th>'' + N''<th>Col8</th>'' + N''<th>Col9</th>'' + N''<th>Col10</th>'' + N''</tr>'' + CAST ( ( SELECT td=[servername],'''' ,td=[dbname],'''' ,td=[OverlappingIndex],'''' ,td=[Col1],'''' ,td=[Col2],'''' ,td=[Col3],'''' ,td=[Col4],'''' ,td=[Col5],'''' ,td=[Col6],'''' ,td=[Col7],'''' ,td=[Col8],'''' ,td=[Col9],'''' ,td=[Col10],'''' FROM DBA_Monitoring.dbo.IndexOverview_DuplicateIndex ORDER BY ServerName, DBName, TableName,IndexName FOR XML PATH(''tr''), TYPE ) AS NVARCHAR(MAX) ) + N''</table>'' ; EXEC msdb.dbo.sp_send_dbmail @profile_name = ''<add your mail profile>'', @recipients = ''<add your email>'', @subject = @Subject, @body = @tableHTML, @body_format = ''HTML'' ; END', @database_name=N'DBA_Monitoring', @output_file_name=N'<add your path>\IndexOverviewErrors.txt', @flags=0 IF (@@ERROR <> 0 OR @ReturnCode <> 0) GOTO QuitWithRollback /****** Object: Step [report - missing index] ******/ EXEC @ReturnCode = msdb.dbo.sp_add_jobstep @job_id=@jobId, @step_name=N'report - missing index', @step_id=4, @cmdexec_success_code=0, @on_success_action=3, @on_success_step_id=0, @on_fail_action=2, @on_fail_step_id=0, @retry_attempts=0, @retry_interval=0, @os_run_priority=0, @subsystem=N'TSQL', @command=N'SET nocount ON -- DECLARE @Subject VARCHAR (100) SET @Subject=''SQL Server - Index Overview_Missing Index ''''Add Server Name'''''' DECLARE @Count AS INT SELECT @Count=COUNT(*) FROM DBA_Monitoring.dbo.IndexOverview_MissingIndex PRINT @Count IF @Count > 0 BEGIN DECLARE @tableHTML NVARCHAR(MAX) ; SET @tableHTML = N''<table border="1">'' + N''<tr>'' + N''<th>Server Name</th>'' + N''<th>DB Name</th>'' + N''<th>Avg Estimated Impact (milliseconds)</th>'' + N''<th>Last User Seek</th>'' + N''<th>Table Name</th>'' + N''<th>Create Statement</th>'' + N''</tr>'' + CAST ( ( SELECT td=[ServerName],'''' ,td=[DBname],'''' ,td=Cast([Avg_Estimated_Impact] as varchar(25)),'''' ,td=[Last_User_Seek],'''' ,td=[TableName],'''' ,td=[Create_Statement],'''' FROM DBA_Monitoring.dbo.IndexOverview_MissingIndex order by ServerName, DBName, TableName FOR XML PATH(''tr''), TYPE ) AS NVARCHAR(MAX) ) + N''</table>'' ; EXEC msdb.dbo.sp_send_dbmail @profile_name = ''<add your mail profile>'', @recipients = ''<add your email>'', @subject = @Subject, @body = @tableHTML, @body_format = ''HTML'' ; END', @database_name=N'DBA_Monitoring', @output_file_name=N'<add your path>\IndexOverviewErrors.txt', @flags=2 IF (@@ERROR <> 0 OR @ReturnCode <> 0) GOTO QuitWithRollback /****** Object: Step [report- unused index] ******/ EXEC @ReturnCode = msdb.dbo.sp_add_jobstep @job_id=@jobId, @step_name=N'report- unused index', @step_id=5, @cmdexec_success_code=0, @on_success_action=3, @on_success_step_id=0, @on_fail_action=2, @on_fail_step_id=0, @retry_attempts=0, @retry_interval=0, @os_run_priority=0, @subsystem=N'TSQL', @command=N'SET nocount ON -- DECLARE @Subject VARCHAR (100) SET @Subject=''SQL Server - Index Overview_Unused Index ''''Add Server Name'''''' DECLARE @Count AS INT SELECT @Count=COUNT(*) FROM DBA_Monitoring.dbo.IndexOverview_UnusedIndex PRINT @Count IF @Count > 0 BEGIN DECLARE @tableHTML NVARCHAR(MAX) ; SET @tableHTML = N''<table border="1">'' + N''<tr>'' + N''<th>Server Name</th>'' + N''<th>DB Name</th>'' + N''<th>Object Name</th>'' + N''<th>Index Name</th>'' + N''<th>User Seek</th>'' + N''<th>User Scan</th>'' + N''<th>User Lookups</th>'' + N''<th>User Updates</th>'' + N''<th>Table Rows</th>'' + N''<th>Drop Statement</th>'' + N''</tr>'' + CAST ( ( SELECT td=[ServerName],'''' ,td=[DBname],'''' ,td=[ObjectName],'''' ,td=[IndexName],'''' ,td=[USERSeek],'''' ,td=[UserScans],'''' ,td=[UserLookups],'''' ,td=[UserUpdates],'''' ,td=[TableRows],'''' ,td=[drop statement],'''' FROM DBA_Monitoring.dbo.IndexOverview_UnusedIndex order by ServerName, DBName, IndexName FOR XML PATH(''tr''), TYPE ) AS NVARCHAR(MAX) ) + N''</table>'' ; EXEC msdb.dbo.sp_send_dbmail @profile_name = ''<add your mail profile>'', @recipients = ''<add your email>'', @subject = @Subject, @body = @tableHTML, @body_format = ''HTML'' ; END', @database_name=N'DBA_Monitoring', @output_file_name=N'<add your path>\IndexOverviewErrors.txt', @flags=2 IF (@@ERROR <> 0 OR @ReturnCode <> 0) GOTO QuitWithRollback /****** Object: Step [report - longest running queries] ******/ EXEC @ReturnCode = msdb.dbo.sp_add_jobstep @job_id=@jobId, @step_name=N'report - longest running queries', @step_id=6, @cmdexec_success_code=0, @on_success_action=3, @on_success_step_id=0, @on_fail_action=2, @on_fail_step_id=0, @retry_attempts=0, @retry_interval=0, @os_run_priority=0, @subsystem=N'TSQL', @command=N'SET nocount ON -- DECLARE @Subject VARCHAR (100) SET @Subject=''SQL Server - Index Overview_Longest Running Queries ''''Add Server Name'''''' DECLARE @Count AS INT SELECT @Count=COUNT(*) FROM DBA_Monitoring.dbo.IndexOverview_LongestQueries PRINT @Count IF @Count > 0 BEGIN DECLARE @tableHTML NVARCHAR(MAX) ; SET @tableHTML = N''<table border="1">'' + N''<tr>'' + N''<th>Server Name</th>'' + N''<th>DB Name</th>'' + N''<th>Query Name</th>'' + N''<th>Execution Count</th>'' + N''<th>Max Elasped Time (milliseconds)</th>'' + N''<th>Avg Elsaped Time (milliseconds)</th>'' + N''</tr>'' + CAST ( ( SELECT td=[ServerName],'''' ,td=[DBname],'''' ,td=[Queryname],'''' ,td=[ExecutionCount],'''' ,td=MaxElapsedTime,'''' ,td=AvgElapsedTime,'''' FROM DBA_Monitoring.dbo.IndexOverview_LongestQueries order by ServerName, DBName, QueryName, ExecutionCount FOR XML PATH(''tr''), TYPE ) AS NVARCHAR(MAX) ) + N''</table>'' ; EXEC msdb.dbo.sp_send_dbmail @profile_name = ''<add your mail profile>'', @recipients = ''<add your email>'', @subject = @Subject, @body = @tableHTML, @body_format = ''HTML'' ; END', @database_name=N'DBA_Monitoring', @output_file_name=N'<add your path>\IndexOverviewErrors.txt', @flags=0 IF (@@ERROR <> 0 OR @ReturnCode <> 0) GOTO QuitWithRollback /****** Object: Step [report - index read counts] ******/ EXEC @ReturnCode = msdb.dbo.sp_add_jobstep @job_id=@jobId, @step_name=N'report - index read counts', @step_id=7, @cmdexec_success_code=0, @on_success_action=3, @on_success_step_id=0, @on_fail_action=2, @on_fail_step_id=0, @retry_attempts=0, @retry_interval=0, @os_run_priority=0, @subsystem=N'TSQL', @command=N'SET nocount ON -- DECLARE @Subject VARCHAR (100) SET @Subject=''SQL Server - Index Overview_Index Reads with Counts ''''<Add Server/Database Names>'''''' DECLARE @Count AS INT SELECT @Count=COUNT(*) FROM DBA_Monitoring.dbo.IndexOverviewReadsWithCounts PRINT @Count IF @Count > 0 BEGIN DECLARE @tableHTML NVARCHAR(MAX) ; SET @tableHTML = N''<table border="1">'' + N''<tr>'' + N''<th>Server Name</th>'' + N''<th>DB Name</th>'' + N''<th>Object</th>'' + N''<th>Execution Count</th>'' + N''<th>Total Logical Reads</th>'' + N''<th>Total Physical Reads</th>'' + N''</tr>'' + CAST ( ( SELECT td=[ServerName],'''' ,td=[DataBase],'''' ,td=[Object],'''' ,td=[execution_count],'''' ,td=total_logical_reads,'''' ,td=total_physical_reads,'''' FROM DBA_Monitoring.dbo.IndexOverviewReadsWithCounts order by ServerName, [Database], [Object] FOR XML PATH(''tr''), TYPE ) AS NVARCHAR(MAX) ) + N''</table>'' ; EXEC msdb.dbo.sp_send_dbmail @profile_name = ''<add your mail profile here>'', @recipients = ''<add your email here>'', @subject = @Subject, @body = @tableHTML, @body_format = ''HTML'' ; END', @database_name=N'DBA_Monitoring', @output_file_name=N'<add your path>\IndexOverviewErrors.txt', @flags=2 IF (@@ERROR <> 0 OR @ReturnCode <> 0) GOTO QuitWithRollback /****** Object: Step [report - index read statements] ******/ EXEC @ReturnCode = msdb.dbo.sp_add_jobstep @job_id=@jobId, @step_name=N'report - index read statements', @step_id=8, @cmdexec_success_code=0, @on_success_action=3, @on_success_step_id=0, @on_fail_action=2, @on_fail_step_id=0, @retry_attempts=0, @retry_interval=0, @os_run_priority=0, @subsystem=N'TSQL', @command=N'SET nocount ON -- DECLARE @Subject VARCHAR (100) SET @Subject=''SQL Server - Index Overview_Index Reads with Statements ''''<Add Server/Database Names>'''''' DECLARE @Count AS INT SELECT @Count=COUNT(*) FROM DBA_Monitoring.dbo.IndexOverviewReadsWithQuery PRINT @Count IF @Count > 0 BEGIN DECLARE @tableHTML NVARCHAR(MAX) ; SET @tableHTML = N''<table border="1">'' + N''<tr>'' + N''<th>Server Name</th>'' + N''<th>DB Name</th>'' + N''<th>Object</th>'' + N''<th>Execution Count</th>'' + N''<th>Total Logical Reads</th>'' + N''<th>Total Physical Reads</th>'' + N''<th>Statement</th>'' + N''</tr>'' + CAST ( ( SELECT top 100 td=[ServerName],'''' ,td=[DataBase],'''' ,td=[Object],'''' ,td=[execution_count],'''' ,td=total_logical_reads,'''' ,td=total_physical_reads,'''' ,td=[Statement],'''' FROM DBA_Monitoring.dbo.IndexOverviewReadsWithQuery order by ServerName, [Database], [Object] FOR XML PATH(''tr''), TYPE ) AS NVARCHAR(MAX) ) + N''</table>'' ; EXEC msdb.dbo.sp_send_dbmail @profile_name = ''<add your mail profile here>'', @recipients = ''<add your email here>'', @subject = @Subject, @body = @tableHTML, @body_format = ''HTML'' ; END', @database_name=N'DBA_Monitoring', @output_file_name=N'<add your path>\IndexOverviewErrors.txt', @flags=2 IF (@@ERROR <> 0 OR @ReturnCode <> 0) GOTO QuitWithRollback /****** Object: Step [report - fragmentation levels] ******/ EXEC @ReturnCode = msdb.dbo.sp_add_jobstep @job_id=@jobId, @step_name=N'report - fragmentation levels', @step_id=9, @cmdexec_success_code=0, @on_success_action=1, @on_success_step_id=0, @on_fail_action=2, @on_fail_step_id=0, @retry_attempts=0, @retry_interval=0, @os_run_priority=0, @subsystem=N'TSQL', @command=N'SET nocount ON -- DECLARE @Subject VARCHAR (100) SET @Subject=''SQL Server - Index Overview_Fragmentation Levels ''''Add Server Name'''''' DECLARE @Count AS INT SELECT @Count=COUNT(*) FROM DBA_Monitoring.dbo.IndexOverview_FragLevels PRINT @Count IF @Count > 0 BEGIN DECLARE @tableHTML NVARCHAR(MAX) ; SET @tableHTML = N''<table border="1">'' + N''<tr>'' + N''<th>Server Name</th>'' + N''<th>DB Name</th>'' + N''<th>Table</th>'' + N''<th>Index</th>'' + N''<th>Fragmentation %</th>'' + N''<th>Page Count</th>'' + N''</tr>'' + CAST ( ( SELECT td=[ServerName],'''' ,td=[DBname],'''' ,td=[Table],'''' ,td=IsNull([Index], ''HEAP - no clustered index''),'''' ,td=convert(varchar, round([avg_fragmentation_in_percent], 2)),'''' ,td=[page_count],'''' FROM DBA_Monitoring.dbo.IndexOverview_FragLevels order by ServerName, DBName, [Table], [Index] FOR XML PATH(''tr''), TYPE ) AS NVARCHAR(MAX) ) + N''</table>'' ; EXEC msdb.dbo.sp_send_dbmail @profile_name = ''<add your mail profile>'', @recipients = ''<add your email>'', @subject = @Subject, @body = @tableHTML, @body_format = ''HTML'' ; END', @database_name=N'DBA_Monitoring', @output_file_name=N'<add your path>\IndexOverviewErrors.txt', @flags=2 IF (@@ERROR <> 0 OR @ReturnCode <> 0) GOTO QuitWithRollback EXEC @ReturnCode = msdb.dbo.sp_update_job @job_id = @jobId, @start_step_id = 1 IF (@@ERROR <> 0 OR @ReturnCode <> 0) GOTO QuitWithRollback EXEC @ReturnCode = msdb.dbo.sp_add_jobserver @job_id = @jobId, @server_name = N'(local)' IF (@@ERROR <> 0 OR @ReturnCode <> 0) GOTO QuitWithRollback COMMIT TRANSACTION GOTO EndSave QuitWithRollback: IF (@@TRANCOUNT > 0) ROLLBACK TRANSACTION EndSave: GO |
Summary:
This is a step by step method to collect a high level overview of the condition of the Index’s and query executions for a specific database on your server. This information is taken directly from SQL Server making it readily available at any time as long as there has been a reasonable amount of time between server restarts. Data collected may help you answer the ever reoccurring questions about database performance and what you can do to improve it.
Included in this package are the following:
- Tables:
- IndexOverviewReadsWithCounts_stage
- IndexOverviewReadsWithQuery_stage
- IndexOverviewReadsWithCounts
- IndexOverviewReadsWithQuery
- IndexOverview_DuplicateIndex
- IndexOverview_FragLevels
- IndexOverview_LongestQueries
- IndexOverview_MissingIndex
- IndexOverview_UnusedIndex
- Reports
- Duplicate Index
- Missing Index
- Unused Index
- Longest Queries
- Fragmentation Levels
- Index Read Counts
- Index Read Statements
- SQL Agent Job
- Index Overview

For the last 15 years has focused her technology experience within the world of database solutions and specifically with MS SQL Server. She has published numerous articles spotlighting SQL Server and is an expert in monitoring and reporting on SQL Server performance.
View all posts by Kimberly Killian
- How to automatically refresh a SQL Server database - October 4, 2017
- SQL Server Index vs Statistics a consultants woes…or rants - December 29, 2016
- How to Split a Comma Separated Value (CSV) file into SQL Server Columns - December 29, 2016