
In the previous articles of this series (see the index at bottom), we went through many aspects of the SQL Execution Plan, where we discussed how the Execution Plan is generated internally, the different types of plans, the main components and operators and how to read and analyze the plans that are generated using different tools. In this article, we will show how we can use an Execution Plan in tuning the performance of T-SQL queries.
SQL Server query performance tuning is considered as a top priority and an endless battle for database administrators to achieve the best performance for their managed systems, with the least resources consumption. The first method that any database administrator recalls when thinking about the queries performance tuning is using SQL Execution Plans. This is because the plan tells us what to tune, by showing how the query is internally executed with presentation for the execution road map, the most expensive part of the query, signs that help in writing the query in the best way and the recommended indexes.
There are number of general signs in the SQL Execution Plan that indicate potentially bad performance spots on the query. For example, the most expensive operator that has the highest cost, related to the overall query cost, is a good starting point for the query performance troubleshooting. In addition, the fat arrows, that followed with thin ones, indicates large number of records being processed and flowed from one operator to the other to retrieve small number of records, could be also a sign for a missing index or data multiplication performance issue.
After understanding the role of each plan operator discussed in this series, you can recognize the extra operators that degrade the performance of the query due to its addition overhead. Also, the Scan operators that are used for scanning the overall table or index, indicates most of the time that there is a missing index, the index is badly used, or the query contains no filtering condition. Another sign from the Execution Plan for a performance issue in the query, are the Execution Plan Warnings. These messages are used to warn about different problems with the query to troubleshoot, such as tempdb spills issues, missing indexes or bad cardinality estimates.
To understand how to use a SQL Execution Plan in tuning the performance SQL queries, let us go through our practical demo. Before starting with the first example, we will create two new tables using the CREATE TABLE T-SQL statements below:
|
1 2 3 4 5 6 7 8 9 10 11 12 13 14 15 16 17 |
CREATE TABLE Employee_Main ( Emp_ID INT IDENTITY (1,1) PRIMARY KEY, EMP_FirsrName VARCHAR (50), EMP_LastName VARCHAR (50), EMP_BirthDate DATETIME, EMP_PhoneNumber VARCHAR (50), EMP_Address VARCHAR (MAX) ) GO CREATE TABLE EMP_Salaries ( EMP_ID INT IDENTITY (1,1), EMP_HireDate DATETIME, EMP_Salary INT, CONSTRAINT FK_EMP_Salaries_Employee_Main FOREIGN KEY (EMP_ID) REFERENCES Employee_Main (EMP_ID), ) GO |
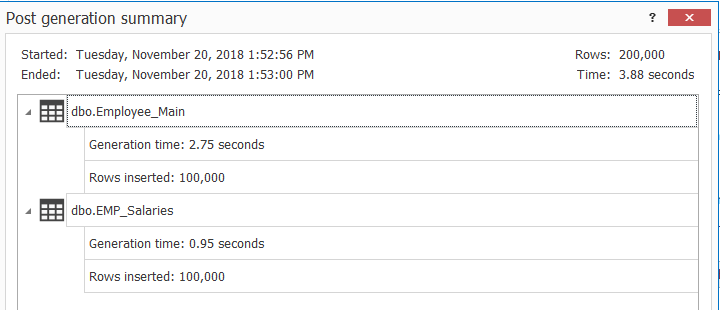
After creating the tables, we will fill each table with 100K records, using ApexSQL Generate, as shown below:
Tuning Simple Query
Now the tables are ready for the demo. Assume that we need to tune the performance of the following badly behaving SELECT statement:
|
1 2 3 4 5 |
SELECT [EMP_ID] ,[EMP_HireDate] ,[EMP_Salary] FROM [AdventureWorks2016CTP3].[dbo].[EMP_Salaries] WHERE [EMP_ID]< 1000 |
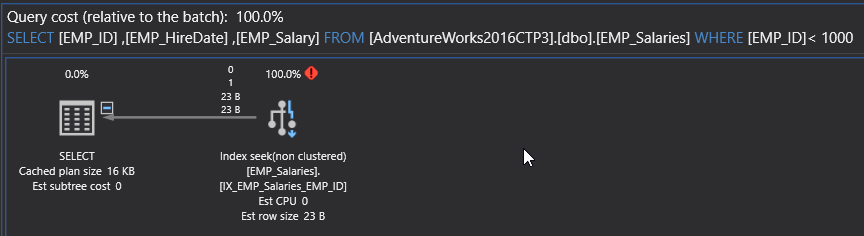
The best way of tuning the previous query performance, is studying the SQL Execution Plan of that query. If you execute the previous SELECT query, including the Actual Execution Plan, the generated plan in our case will be like:
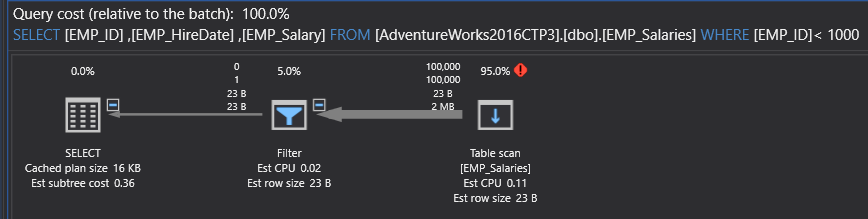
It is clear from the generated plan, that the SQL Server Engine scans all the table rows (100K records) to retrieve the requested data (1 record). This is obvious from three signs:
- the Table Scan operator
- the high cost for that operator
- and the transition from the fat arrow, that flows the data from the Table Scan to the next operator, to the think arrow of the flows the output data.
Using ApexSQL Plan, SQL Execution plan analysis tool, you can check the execution statistics of the query, such as the number of reads, the duration and the CPU cost, that are high for that query, as shown below:

The three signs derived from the previous plan direct us to the main cause of the query’s bad performance, which is the absence of an index, in the EMP_Salary table, that can speed up the data retrieval process from that table. We will go ahead and create an index on the EMP_ID column of the EMP_Salary table, using the CREATE INDEX T-SQL statement below:
|
1 |
CREATE NONCLUSTERED INDEX IX_EMP_Salaries_EMP_ID ON EMP_Salaries (EMP_ID) |
… then run the same T-SQL statement, including the Actual Execution Plan.
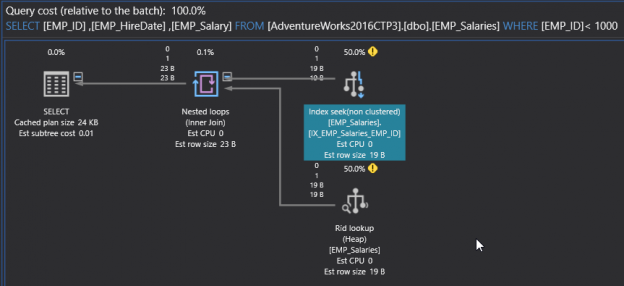
You will see from the generated Execution Plan that, that the SQL Server Engine will Seek for the requested data in the created index directly, without the need to scan the overall underlying table, with the cost of the Index Seek reduced to 50%. In addition, the number of records flowed from the Index Seek operator to the next operator was reduced significantly, that is clear from the thickness of the arrow, as shown in the plan below:
Checking the execution statistics of the query, you will see how the number of rows was reduced to 2 with negligible duration and CPU cost, as shown below:

If you look deeply in the previous plan, you can find another sign for a performance issue, which is the extra expensive RID Lookup and Nested Loops operators. Recall from the previous article about the Execution Plan operators that, the SQL Server Engine used the NonClustered index to retrieve the EMP_ID column and returns for the underlying table to retrieve the rest of columns. This issue can be fixed by creating a covering index, that allows the SQL Server Engine to retrieve all the columns from that sorted index, without the need to check the underlying table.
The below CREATE INDEX T-SQL statement can be used to create a covering index for that query:
|
1 |
CREATE NONCLUSTERED INDEX IX_EMP_Salaries_EMP_ID ON EMP_Salaries (EMP_ID) INCLUDE (EMP_HireDate,EMP_Salary ) WITH DROP_EXISTING |
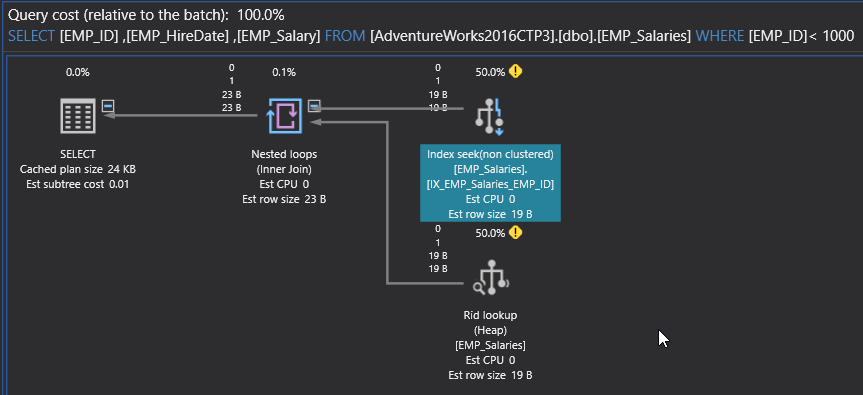
Running the same SELECT statement, including the Actual Execution Plan of the query, you will see that the RID Lookup and the Nested Loops operators are no longer appeared, as the SQL Server Engine found all requested data in the sorted covering plan, as shown below:
Tuning Complex Query
We saw how the SQL Execution plan helped us in tuning the performance of a simple query. Will it help us with more complex query in the same way?
Let us drop the index that was created on the EMP_Salaries table to start a clear scenario, using the DROP INDEX T-SQL statement below:
|
1 |
DROP INDEX IX_EMP_Salaries_EMP_ID ON EMP_Salaries |
Assume that we need to tune the performance of the below SELECT query, that joins the two EMP test tables created previously, to retrieve the employee’s information:
|
1 2 3 4 5 |
SELECT EMP_FirsrName, EMP_LastName, EMP_BirthDate, EMP_Address, EMP_HireDate, EMP_Salary FROM [dbo].[Employee_Main] EM JOIN [dbo].[EMP_Salaries] ES ON EM.[EMP_ID] =ES.[EMP_ID] WHERE EM.[EMP_ID] > 2470 AND ES.EMP_Salary >450 |
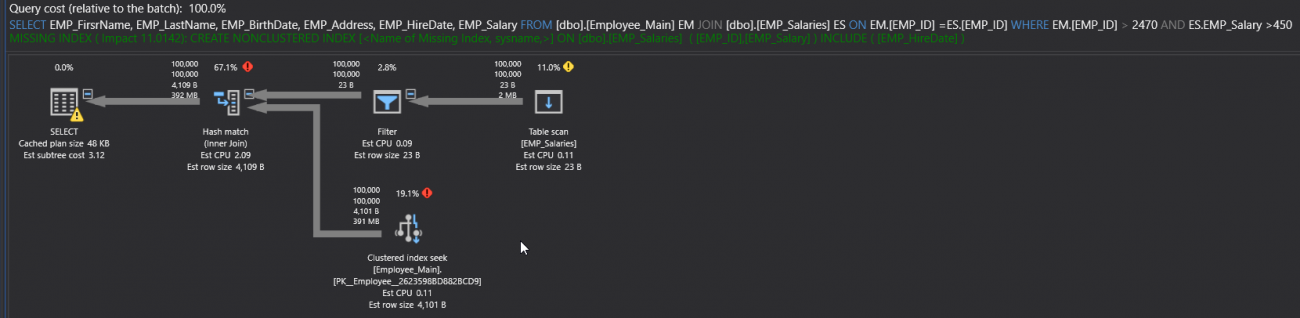
If you execute the SELECT query, including the Actual Execution Plan of the query. You will see from the generated plan number of performance issue signs, such as the Table Scan operator, due to scanning the overall underlying table, the fat arrow, due to large number of rows flowing between the operators and the extra expensive operators such as the Hash Match operator, as shown in the SQL Execution Plan below:
Checking the execution statistics of the query, you will see the large number of reads, the long duration and the high CPU cost, as shown below:

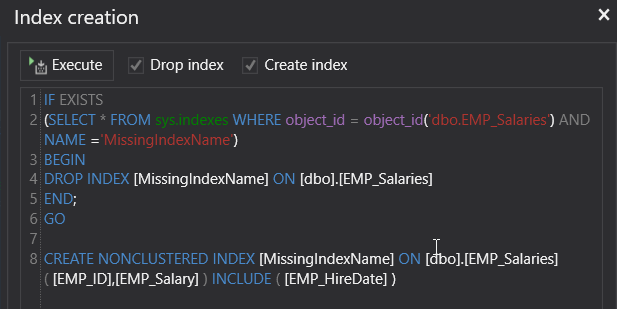
From the upper part of the Execution Plan, you will see, in green, a CREATE INDEX T-SQL statement for a recommended index that will enhance the performance of the query, as shown below:
If we create the suggested index, then execute the SELECT statement again, including the Actual Execution Plan of the query. The generated SQL Execution Plan will show that, the Table Scan operator changed to Index Seek operator. But the arrow still fat, which is a normal behavior here, as there is no transition from fat arrow to thin arrow, as shown below:
With the minimal enhancements in the execution duration and PU cost, as shown in the execution statistics of the query below:

At this step, the enhancement that can be performed in the query performance, can be achieved by writing the query in a better way. For example, the thickness of the arrow can be reduced using the TOP clause that limits the number of returned rows. On the other hand, the Filter operator can be removed by creating a new index on the EMP_Salaries table, using the CREATE INDEX T-SQL statement below:
|
1 |
CREATE NONCLUSTERED INDEX [IX_EMP_Salaries_EMP_Salary] ON [dbo].[EMP_Salaries] ([EMP_Salary] ) |
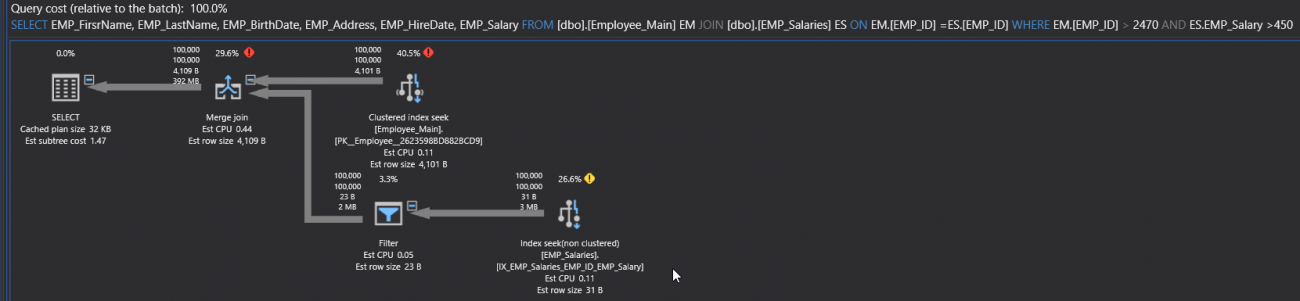
And the generated Execution Plan, after these modifications, will be like:
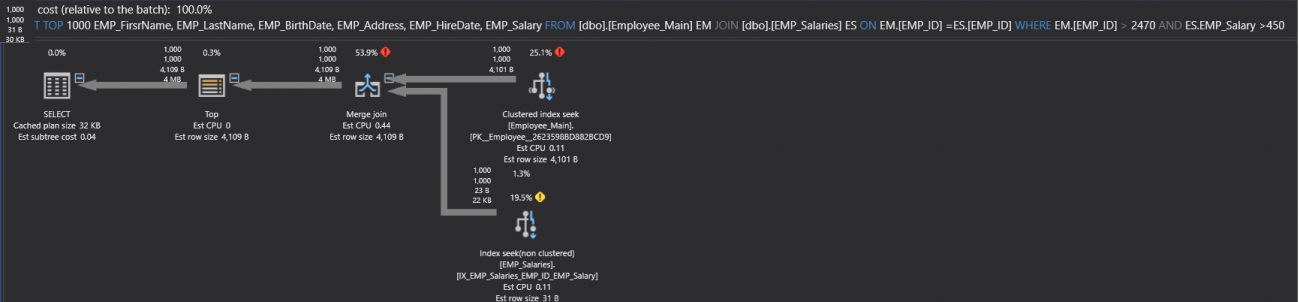
It is clear from the previous examples, the importance of the SQL Execution Plans in tuning the performance of the different T-SQL queries. Stay tuned for the next article in which we will show where the plans are saved in SQL Server memory and how to save the execution plans for reuse!
Table of contents

He is a Microsoft Certified Solution Expert in Data Management and Analytics, Microsoft Certified Solution Associate in SQL Database Administration and Development, Azure Developer Associate and Microsoft Certified Trainer.
Also, he is contributing with his SQL tips in many blogs.
View all posts by Ahmad Yaseen
- Azure Data Factory Interview Questions and Answers - February 11, 2021
- How to monitor Azure Data Factory - January 15, 2021
- Using Source Control in Azure Data Factory - January 12, 2021