
Troubleshooting SQL Server is all about gathering the right evidence. Ordinarily we utilise a variety of different methods and analyse their output to look for specific areas where we would focus our diagnostic efforts. We could for example, use the results of various DMVs to look at wait statistic and resource information to help us focus our investigation in a particular area of SQL Server.
One available option that I haven’t seen commonly used is a system stored procedure introduced in SQL Server 2012 called sys.sp_server_diagnostics. This stored procedure provides a quick assessment of a SQL instance by capturing and returning health and event related information that is conveniently categorised for us.
To execute, using a regular or admin connection, run the following T-SQL command:
|
1 2 3 |
EXEC sp_server_diagnostics |
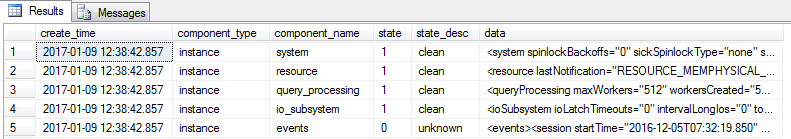
By default the capture process lasts for duration of five seconds before the output is returned to the results grid as displayed in the image below:
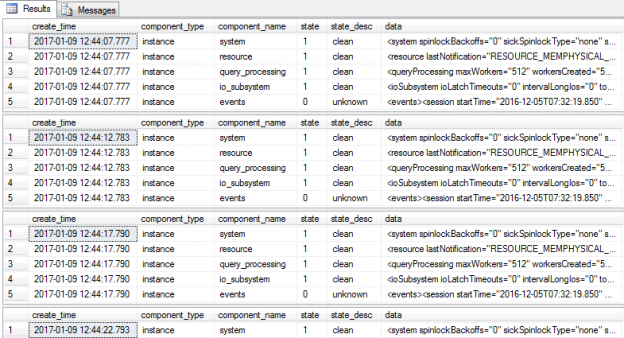
The stored procedure can also be executed in a repeated mode where a time interval can be passed and execution will repeat continuously (until cancelled) and the output will be sent to the results pane each stated interval duration:
|
1 2 3 |
EXEC sp_server_diagnostics 5 |
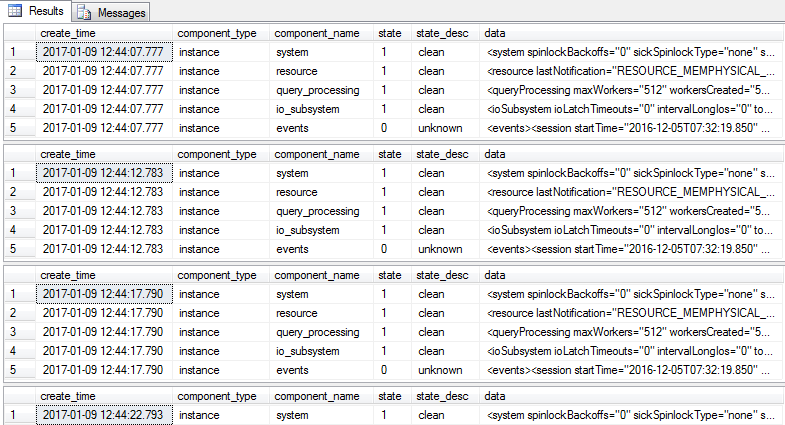
Each returned row represents a particular category of health-related information:
System
Returns system data on items such as spinlocks, latch warnings, page faults, CPU utilisation and other performance conditions.
Resource
The resource category focuses on memory related objects including, amongst other items, available physical and virtual memory, free page information and memory low flags.
Query_Processing
Query Processing returns cumulative wait statistic information including the top preemptive and non-preemptive waits ordered by both count and wait duration.
IO_Subsystem
Returns IO information such as IO related timeouts and pending IO requests.
Events
The events category returns comprehensive event information retrieved during the execution duration.
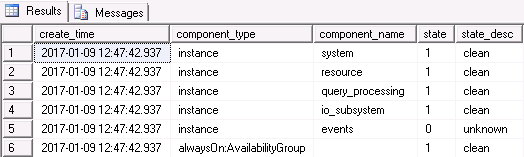
A sixth category is present when running the stored procedure on an instance where Always On Availability Groups are implemented (component name is cleared in this example):
By using the state and state_desc columns we can very quickly see if the process has detected any potential errors in any of the categories that warrant further investigation. Whilst the health scoring calculations are a relative unknown the possible values for state are the following:
0: Unknown
1: Clean
2: Warning
3: Error
Please note that the event category has a default state value of 0.
When running the stored procedure, the data column returned uses a varchar(MAX) data type by default however we can insert the output into a table converting the column into a more readable XML type without too much overhead using code like the following:
|
1 2 3 4 5 6 7 8 9 10 11 12 13 14 15 16 17 18 19 |
CREATE TABLE #ServerDiagnostics ( create_time DateTime, component_type sysname, component_name sysname, state int, state_desc sysname, data xml ) INSERT INTO #ServerDiagnostics EXEC sp_server_diagnostics SELECT * FROM #ServerDiagnostics DROP TABLE #ServerDiagnostics |
However, there is a pretty big restriction when using this method, when using INSERT INTO the stored procedure cannot be executed in a repeated mode and the following error message is displayed:
Msg 17073, Level 16, State 1, Procedure sp_server_diagnostics, Line 1 Executing ‘sp_server_diagnostics’ stored procedure in repeat mode with ‘insert into’ clause is not allowed.
The advantage of using an XML data type though is that we can view data much easier within Management Studio and by looking into the following results obtained from one of my test instances we can get a great insight into the health of my SQL Server instance very quickly:
System
From this example I can see that my instance has not detected and fixed any bad pages, CPU utilisation is at 3% whilst the utilisation for my SQL instance is at 0%. Amongst other items, no latch warnings or spinlocks have been detected.
|
1 2 3 4 5 6 |
<system spinlockBackoffs="0" sickSpinlockType="none" sickSpinlockTypeAfterAv="none" latchWarnings="0" isAccessViolationOccurred="0" writeAccessViolationCount="0" totalDumpRequests="0" intervalDumpRequests="0" nonYieldingTasksReported="0" pageFaults="4014" systemCpuUtilization="3" sqlCpuUtilization="0" BadPagesDetected="0" BadPagesFixed="0" LastBadPageAddress="0x0" /> |
Resource
Resource returns memory related information for my instance. Using these results I can see how much memory is available in the machine, I can see page allocation information and it contains the memory high/low flags that you would using system objects such as the sys.dm_os_sys_memory DMV.
|
1 2 3 4 5 6 7 8 9 10 11 12 13 14 15 16 17 18 19 20 21 22 23 24 25 26 27 28 29 30 31 32 33 34 35 |
<resource lastNotification="RESOURCE_MEMPHYSICAL_HIGH" outOfMemoryExceptions="0" isAnyPoolOutOfMemory="0" processOutOfMemoryPeriod="0"> <memoryReport name="Process/System Counts" unit="Value"> <entry description="Available Physical Memory" value="3147677696" /> <entry description="Available Virtual Memory" value="8778267361280" /> <entry description="Available Paging File" value="11173236736" /> <entry description="Working Set" value="789082112" /> <entry description="Percent of Committed Memory in WS" value="100" /> <entry description="Page Faults" value="7745683" /> <entry description="System physical memory high" value="1" /> <entry description="System physical memory low" value="0" /> <entry description="Process physical memory low" value="0" /> <entry description="Process virtual memory low" value="0" /> </memoryReport> <memoryReport name="Memory Manager" unit="KB"> <entry description="VM Reserved" value="16990872" /> <entry description="VM Committed" value="711040" /> <entry description="Locked Pages Allocated" value="0" /> <entry description="Large Pages Allocated" value="0" /> <entry description="Emergency Memory" value="1024" /> <entry description="Emergency Memory In Use" value="16" /> <entry description="Target Committed" value="3351712" /> <entry description="Current Committed" value="711040" /> <entry description="Pages Allocated" value="324624" /> <entry description="Pages Reserved" value="0" /> <entry description="Pages Free" value="320112" /> <entry description="Pages In Use" value="338392" /> <entry description="Page Alloc Potential" value="3646200" /> <entry description="NUMA Growth Phase" value="0" /> <entry description="Last OOM Factor" value="0" /> <entry description="Last OS Error" value="0" /> </memoryReport> </resource> |
Query Processing
As you can see the query processing category is centred on task counts and those important wait statistics. Waits are supplied in top ten lists and are broken down into pre-emptive and non-pre-emptive types. Pre-emptive waits, also referred to as non-cooperative waits are caused outside of SQL by an interruption of a task by the Operating System. Non-pre-emptive or co-operative waits simply mean that SQL Server is managing the thread scheduling.
Each category of wait has two lists; waits ordered by count and waits ordered by wait duration. There are two very important points when looking at this type of information; first, these are cumulative values. If you are running sp_server_diagnostics in repeated mode the values are not cleared down at each specified interval and will continue to add up. This actually applies in non-repeated mode as well, the values represent the total wait counts and duration since they were last cleared either manually or by an instance restart.
Secondly there is no way to filter out what we might consider benign waits. The top two non-pre-emptive waits that I have in my instance are HADR_FILESTREAM_IOMGR_IOCOMPLETION and QDS_SHUTDOWN_QUEUE which relate to the filestream manager and the query store respectively; both of which both can safely be ignored in this instance.
|
1 2 3 4 5 6 7 8 9 10 11 12 13 14 15 16 17 18 19 20 21 22 23 24 25 26 27 28 29 30 31 32 33 34 35 36 37 38 39 40 41 42 43 44 45 46 47 48 49 50 51 52 53 54 55 56 57 58 59 60 61 62 63 |
<queryProcessing maxWorkers="512" workersCreated="55" workersIdle="20" tasksCompletedWithinInterval="22" pendingTasks="0" oldestPendingTaskWaitingTime="0" hasUnresolvableDeadlockOccurred="0" hasDeadlockedSchedulersOccurred="0" trackingNonYieldingScheduler="0x0"> <topWaits> <nonPreemptive> <byCount> <wait waitType="HADR_FILESTREAM_IOMGR_IOCOMPLETION" waits="4283983" averageWaitTime="503" maxWaitTime="671" /> <wait waitType="QDS_SHUTDOWN_QUEUE" waits="35925" averageWaitTime="60003" maxWaitTime="60057" /> <wait waitType="OLEDB" waits="6172" averageWaitTime="8" maxWaitTime="1213" /> <wait waitType="PAGELATCH_EX" waits="2464" averageWaitTime="0" maxWaitTime="1" /> <wait waitType="PAGELATCH_SH" waits="2319" averageWaitTime="0" maxWaitTime="0" /> <wait waitType="ASYNC_NETWORK_IO" waits="1569" averageWaitTime="4" maxWaitTime="918" /> <wait waitType="MSQL_DQ" waits="1174" averageWaitTime="23" maxWaitTime="1216" /> <wait waitType="MSQL_XP" waits="415" averageWaitTime="0" maxWaitTime="7" /> <wait waitType="WRITELOG" waits="192" averageWaitTime="0" maxWaitTime="4" /> <wait waitType="PAGEIOLATCH_UP" waits="185" averageWaitTime="0" maxWaitTime="4" /> </byCount> <byDuration> <wait waitType="QDS_SHUTDOWN_QUEUE" waits="35925" averageWaitTime="60003" maxWaitTime="60057" /> <wait waitType="HADR_FILESTREAM_IOMGR_IOCOMPLETION" waits="4283983" averageWaitTime="503" maxWaitTime="671" /> <wait waitType="OLEDB" waits="6172" averageWaitTime="8" maxWaitTime="1213" /> <wait waitType="MSQL_DQ" waits="1174" averageWaitTime="23" maxWaitTime="1216" /> <wait waitType="ASYNC_NETWORK_IO" waits="1569" averageWaitTime="4" maxWaitTime="918" /> <wait waitType="MSQL_XP" waits="415" averageWaitTime="0" maxWaitTime="7" /> <wait waitType="WRITELOG" waits="192" averageWaitTime="0" maxWaitTime="4" /> <wait waitType="PAGEIOLATCH_UP" waits="185" averageWaitTime="0" maxWaitTime="4" /> <wait waitType="WRITE_COMPLETION" waits="41" averageWaitTime="0" maxWaitTime="4" /> <wait waitType="PAGELATCH_EX" waits="2464" averageWaitTime="0" maxWaitTime="1" /> </byDuration> </nonPreemptive> <preemptive> <byCount> <wait waitType="PREEMPTIVE_XE_CALLBACKEXECUTE" waits="431072" averageWaitTime="0" maxWaitTime="8" /> <wait waitType="PREEMPTIVE_OS_QUERYREGISTRY" waits="35896" averageWaitTime="0" maxWaitTime="64" /> <wait waitType="PREEMPTIVE_OS_AUTHENTICATIONOPS" waits="8290" averageWaitTime="0" maxWaitTime="18" /> <wait waitType="PREEMPTIVE_XE_GETTARGETSTATE" waits="7259" averageWaitTime="7" maxWaitTime="39" /> <wait waitType="PREEMPTIVE_OS_REVERTTOSELF" waits="5556" averageWaitTime="0" maxWaitTime="1" /> <wait waitType="PREEMPTIVE_OS_AUTHORIZATIONOPS" waits="3051" averageWaitTime="0" maxWaitTime="0" /> <wait waitType="PREEMPTIVE_OS_SECURITYOPS" waits="2505" averageWaitTime="0" maxWaitTime="3" /> <wait waitType="PREEMPTIVE_COM_QUERYINTERFACE" waits="1174" averageWaitTime="23" maxWaitTime="1216" /> <wait waitType="PREEMPTIVE_OS_DELETESECURITYCONTEXT" waits="551" averageWaitTime="0" maxWaitTime="4" /> <wait waitType="PREEMPTIVE_OS_DISCONNECTNAMEDPIPE" waits="551" averageWaitTime="0" maxWaitTime="3" /> </byCount> <byDuration> <wait waitType="PREEMPTIVE_XE_GETTARGETSTATE" waits="7259" averageWaitTime="7" maxWaitTime="39" /> <wait waitType="PREEMPTIVE_COM_QUERYINTERFACE" waits="1174" averageWaitTime="23" maxWaitTime="1216" /> <wait waitType="PREEMPTIVE_OS_QUERYREGISTRY" waits="35896" averageWaitTime="0" maxWaitTime="64" /> <wait waitType="PREEMPTIVE_XE_CALLBACKEXECUTE" waits="431072" averageWaitTime="0" maxWaitTime="8" /> <wait waitType="PREEMPTIVE_OS_AUTHENTICATIONOPS" waits="8290" averageWaitTime="0" maxWaitTime="18" /> <wait waitType="PREEMPTIVE_OS_REVERTTOSELF" waits="5556" averageWaitTime="0" maxWaitTime="1" /> <wait waitType="PREEMPTIVE_OS_SECURITYOPS" waits="2505" averageWaitTime="0" maxWaitTime="3" /> <wait waitType="PREEMPTIVE_OS_WRITEFILE" waits="48" averageWaitTime="1" maxWaitTime="3" /> <wait waitType="PREEMPTIVE_OS_AUTHORIZATIONOPS" waits="3051" averageWaitTime="0" maxWaitTime="0" /> <wait waitType="PREEMPTIVE_OS_DELETESECURITYCONTEXT" waits="551" averageWaitTime="0" maxWaitTime="4" /> </byDuration> </preemptive> </topWaits> <cpuIntensiveRequests /> <pendingTasks /> <blockingTasks /> </queryProcessing> |
IO Subsystem
Here we see information on latch timeouts and long I/O requests. For this particular category the information is surprisingly rather limited and therefore not that useful to us and we would expect to use other methods to investigate further. That said, by using the state and state description columns we can very make quickly make a decision if I/O is an area we want to look into in more detail.
|
1 2 3 4 5 |
<ioSubsystem ioLatchTimeouts="0" intervalLongIos="0" totalLongIos="0"> <longestPendingRequests /> </ioSubsystem> |
Events
This is a very small subset of the information returned by the session. The part of the process is incredibly in-depth by design and it records and retrieves a lot of information. The downside of this of course is the effort involved in going through it all to find something useful.
|
1 2 3 4 5 6 7 8 9 10 11 12 13 14 15 16 17 18 |
<data name="timestamp"> <type name="uint64" package="package0" /> <value>0</value> </data> <data name="process_utilization"> <type name="uint32" package="package0" /> <value>0</value> </data> <data name="system_idle"> <type name="uint32" package="package0" /> <value>97</value> </data> <data name="user_mode_time"> <type name="uint64" package="package0" /> <value>0</value> </data> |
Conclusion
Overall sp_server_diagnostics is a very useful process that provides a quick assessment of a SQL instance. Repeat mode enables us to view periodic results which can aid us when we want to investigate the on-going conditions within a SQL Server.
The information though can be returned by using other methods and often in more detail. It does have limitations on important areas like I/O and the wait statistics do not allow any filtering of waits we might want to ignore so in this case we would certainly use alternative options like DMV queries.
The key point is that it is native functionality to SQL Server and it does return useful information very quickly and therefore is a practical addition to a troubleshooting toolkit.

He has over 10 years experience working with SQL Server in different roles such as DBA, Database Developer and BI specialist. He has worked as Technical Lead on numerous mission critical projects in various sectors such as local government, finance, charities and retail.
David is extremely passionate about SQL Server and keeps his own blog at http://sqlclarity.blogspot.com/ where he shares his views on the Data Platform. In his spare time he loves spending time with his family, watching movies and cooking Asian cuisine!
View all posts by David Alcock
- Monitoring SQL Server with Dynamic Management Objects – Requests - May 17, 2017
- Monitoring SQL Server with Dynamic Management Objects – Sessions and connections - May 12, 2017
- CHECKSUM page verification in SQL Server - March 21, 2017